http://www.scirp.org/journal/ojl ISSN Online: 2167-7751
ISSN Print: 2167-7743
DOI: 10.4236/ojl.2017.62002 June 8, 2017
Ethnicity in Kenyan Universities
Simon Thuranira Taaliu
School of Education and Social Sciences, University of Embu, Embu, Kenya
Abstract
In Kenya, ethnicity has been one of the social problems since independence. It cuts across all sectors of the economy including education. Ethnicity is wit-nessed in forms of recruitment, promotion, transfer and deployment of lec-turers and other non-teaching members of staff. In the universities there is ethnic consideration in recruitment of Chairs of the Council, Vice Chancel-lors and their Deputies and other top leaders. Politicians in many cases have tried to influence appointments of the top leaderships of public universities. The public universities have more lecturers and the non-teaching staff from the local ethnic group. Ethnicity has also impacted university students as well, especially when electing their student leaders. This paper examines the causes of ethnicity and some of the recommendations on how to tackle the vice. Some of the recommendations include empowering the National Cohesion and Integration Commission (NCIC) and vetting of Vice Chancellors and Council members.
Keywords
Ethnicity, Government, Education, Schools, University, Kenya
1. Introduction
Ethnicity can be defined as belonging to a social group that has common so-cio-cultural values like culture, religion and languages. A tribe is group of people within a geo-political region with common ancestry. Ethnicity is associated with culture, while tribe is related to common ancestors. In the context of this paper ethnicity and tribalism will be used interchangeably. Race is associated with bio-logical origin of a particular group of people like African race, White/Caucasian race, Asian race, or Arab race. In Kenya, there are a total of 42 ethnic groups living in the 47 counties across the country. The country is made up of four main races that include the Africans, Asians, Whites and Arabs. Racism is not a pronounced phenomenon in Kenya like in the United States or in Europe. Many How to cite this paper: Taaliu, S. T. (2017).
Ethnicity in Kenyan Universities. Open Jour- nal of Leadership, 6, 21-33.
https://doi.org/10.4236/ojl.2017.62002
Received: April 11, 2017 Accepted: June 5, 2017 Published: June 8, 2017
Copyright © 2017 by author and Scientific Research Publishing Inc. This work is licensed under the Creative Commons Attribution International License (CC BY 4.0).
22
people in Kenya have grown up seeing fellow Africans and since majority lack exposure to other countries where racism is visibly present; racism is not pro-nounced in the country. Instead, ethnicity has taken the role of racism in Kenya in terms of discrimination in many places e.g. in employment, provision of ser-vices in public office and admission to schools and universities. There is regional and ethnic imbalance in representations in the universities in the number of students admitted to public universities, employment and leadership positions in the public universities, and the number of public universities and constituent colleges located in specific regions in terms of ethnic groups occupying those areas (Mwiria, 2006). This paper sheds lights on the issue of ethnicity in Kenyan universities and the different approaches in which the government has endea-vored to tackle the problem. The article discusses the causes of ethnicity in Ke-nyan universities and also examines different approaches to curbing this prob-lem. The article recommends a multi-facetted approach to tackling the issue of ethnicity which affects universities and in turn the entire education system, since universities serve humanity in Kenya and internationally.
2. Ethnicity in Kenya Universities
2.1. Introduction
In this section, the issue of ethnicity in Kenya is illuminated in terms of the his-torical perspective and how the colonial government perpetuated divisions among the indigenous groups in Kenya. Other pertinent issues discussed in-clude; students’ admission, employment of staff, composition of the university councils, appointment of Vice Chancellors and Chairs of university councils, and location of universities and constituent colleges in various counties in the country.
2.2. Historical Background of Ethnicity in Kenyan
23
2.3. Students’ Admissions
The current education system in Kenya tends to promote ethnicity through ad-mission to high schools. The policy of admitting students to high schools follow system whereby the best students are admitted to national high schools from all counties, extra-county schools admit students from the region and county schools admit students from the county1. The national schools admit students
from all over the country unlike the extra-county and county schools. This sys-tem promotes ethnicity in that there are less than 100 national schools in the whole country, which means most of the students are admitted in extra-county and county schools which are within their locality, limiting their chances of in-teracting with students from other parts of the country. There are negative eth-nic/tribal stereo-types which have negative connotations against each tribe and if students do not have a chance of interacting with others from different tri-bes/ethnic groups then they might grow up believing in the biased information about other tribes which is passed from generation to generation. Students from different parts of the country are admitted to any public universities in the country not necessarily the one in their county. This promotes national cohesion and integration at the university level because students are able to interact with students from all parts of the country. These interactions at the university level sometimes even lead to ethnic intermarriages which is a good thing for the country, which is highly divided into tribal lines (MoEST, 2017).
[image:3.595.205.540.479.665.2]From Table 1, the Kikuyu ethnic group with 17.7% of the total population has a 37.8% of the total number of students in the public universities and constituent colleges. The Kikuyu, Kamba, Luhya, and the Luo constitute 72.8% of the total number of students in the public universities and colleges while the remaining
Table 1. Ethnic composition of students in public universities in Kenya.
S/N Ethnicity Pop (2009) Pop % Students’ %
1 Kikuyu 6,622,576 17.7 37.8
2 Kamba 3,893,157 10.4 13
3 Luo 4,044,440 10.8 12
4 Luhya 5,338,666 14.2 10
5 Kalenjin 4,967,328 13.3 8
6 Meru 1,658,108 4.4 7
7 Kisii 2,205,669 5.9 4
9 Embu 324,092 0.9 3
10 Others 273,519 22.4 5.2
Total 31,288,129 83.5 100
Source: British Council (2006).
1Students are admitted to high school after sitting for the Kenya Certificate of Primary Education
24
Table 2. Ethnic composition of employees in public universities in Kenya.
S/N Ethnicity (2009) Pop Pop % Employees Employment % No. of % Pop Ratio & Employment
1 Kikuyu 6,622,576 17.7 7050 23.6 5.9
2 Luo 4,044,440 10.8 4658 15.6 4.8
3 Kalenjin 4,967,328 13.3 4586 15.4 2.0
4 Luhya 5,338,666 14.2 4562 15.3 1.1
5 Kisii 2,205,669 5.9 2470 8.3 2.4
6 Kamba 3,893,157 10.4 2393 8.7 −2.4
7 Meru 1,658,108 4.4 1348 4.5 0.1
8 Mijikenda 1,960,574 5.2 652 2.3 −3.1
9 Embu 324,092 0.9 419 1.4 0.5
10 Taita 273,519 0.7 370 1.2 0.5
Total 31,288,129 83.5 96.3
Source: NCIC (2016).
38 ethnic groups have only 27.2% to share amongst themselves. This is big mi-srepresentation of the minority ethnic groups which are majorly marginalized. This translates into employment in the public sector including in the public universities as shown in Table 2 in the next section which shows the Kikuyu having 23.6% of all employees in the public universities and constituent colleges (Mwiria, 2006).
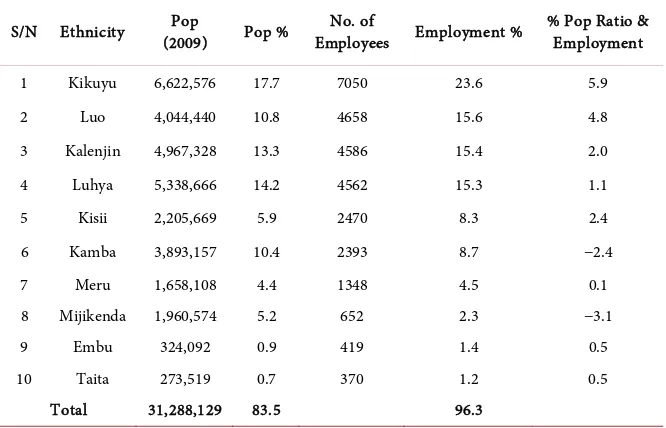
2.4. Employment in the Universities
There is regional imbalance in terms of employment in the public universities and constituent colleges. According to the National Cohesion and Integration Commission (NCIC) Act of Kenya no public establishment should recruit more than one third of its staff members from one tribe.
From Table 2 it is clear the Kikuyu is the largest ethnic group in Kenya in terms of the proportion of the total population (17.7%) but takes up 23.6% of all the jobs in the public universities and constituent colleges in Kenya. The Kikuyu, Luo, Luhya, Kalenjin, Kisii and Kamba make up 72.3% of the Kenyan population but constitute 86.9% of the total workforce in public universities and constituent colleges. This denies opportunities to enhance the face of Kenya in the public universities by excluding 36 other ethnic groups who reside within the country. Table 2 shows that the universities have in their workforce members from 10 ethnic groups in Kenya which take up 96.3% of the total workforce in the public universities and constituent colleges (NCIC, 2016: p. 124).
25
Table 3. Ethnic representation of vice chancellors and principals of public universities
and constituent colleges in Kenya.
S/N Ethnic Group Frequency %
1 Luo 6 19.4
2 Kamba 4 12.9
3 Kikuyu 4 12.9
4 Luhya 4 12.9
5 Meru 4 12.9
6 Mijikenda 3 9.7
7 Kalenjin 2 6.5
8 Kisii 2 6.5
9 Somali 1 3.2
10 Teso 1 3.2
Total 31 100
Source: NCIC (2016).
tion of the institution and should give priority to the marginalized groups. (NCIC, 2016: p. 25).
According to Section 7(2) of the NCIC Act of Kenya, no public establishment should recruit more than one third of its employees from one ethnic group. Ta-ble 4 shows a study carried out in 2016 by the National Cohesion and Integra-tion Commission (NCIC) where only Six (6) out of the thirty one (31) Public Universities and constituent colleges complied with the above provision. The universities that complied are; Multimedia University of Kenya, Technical Uni-versity of Kenya, Egerton UniUni-versity, UniUni-versity of Nairobi, The Cooperative University of Kenya and Moi University. The 2016 study, entitled “Ethnic and Diversity Audit of Public Universities and Constituent Colleges”, carried out by NCIC in 31 public universities and constituent university colleges on employees and their ethnic affiliation, revealed ethnic imbalance in employment. Table 4 also indicates that where the Vice Chancellor or Principal is from a certain tribe and he/she is appointed in a university within his/her own locality, then majority of the employees are recruited from his/her tribe. In universities where the Vice Chancellor or Principal is from a different tribe other than the one in the locali-ty, then again the majority of the employees are from the local community or tribe (NCIC, 2016: p. 25).
2.5. Academic Ethnicity
26
Table 4. Ethnic representation of vice chancellors/principals and majority ethnic group
among staff members of public universities and constituent colleges in Kenya.
S/N University Ethnicity of the VC/Principal Majority Ethnic group (Staff) the staff Compliance % of
1 Kirinyaga University Kikuyu Kikuyu 82.7 Contravenes
2 Kibabii University Teso Luhya 79 Contravenes
3 Murang’a University Kisii Kikuyu 76.1 Contravenes 4 Jaramogi Oginga Odinga University Luo Luo 75.1 Contravenes
5 Rongo University Luo Luo 72.5 Contravenes
6 Kisii University Kisii Kisii 72.1 Contravenes
7 Meru University Meru Meru 70.9 Contravenes
8 Dedan Kimathi University Kikuyu Kikuyu 70.1 Contravenes 9 Masinde Muliro University Luo Luhya 69.9 Contravenes 10 University of Kabianga Kalenjin Kalenjin 68.8 Contravenes 11 Machakos University Kamba Kamba 67.4 Contravenes
12 Maseno University Luo Luo 63.4 Contravenes
13 Karatina University Kikuyu Kikuyu 61.8 Contravenes 14 Moi University Kalenjin Kalenjin 60.6 Contravenes 15 South Eastern Kenya University Kamba Kamba 57.5 Contravenes
16 Chuka University Meru Meru 53.1 Contravenes
17 University of Eldoret Luhya Kalenjin 51.5 Contravenes 18 Garissa University College Somali Somali 51.4 Contravenes 19 Jomo Kenyatta University Luhya Kikuyu 45.3 Contravenes 20 Kenyatta University Kikuyu Kikuyu 39.8 Contravenes 21 Maasai Mara University Luhya Maasai 38.8 Contravenes 22 Taita Taveta University Mijikenda Taita 38 Contravenes 23 Laikipia University Kamba Kikuyu 37.6 Contravenes
24 University of Embu Meru Embu 37.2 Contravenes
25 Pwani University Mijikenda Mijikenda 36.8 Contravenes 26 Technical University of Mombasa Mijikenda Mijikenda 34.5 Complies 27 Cooperative University of Kenya Luhya Kikuyu 33.1 Complies 28 University of Nairobi Kamba Kikuyu 30.1 Complies
29 Egerton University Luhya Kikuyu 27.1 Complies
30 Technical University of Kenya Luo Kikuyu 26.8 Complies 31 Multi-Media University Meru Kikuyu 21.8 Complies
Source: NCIC (2016).
27 supervising students make sure students who are from their tribe graduate faster (Taaliu, 2011). The post-graduate students who come from “other tribes” may drop out or take more time to graduate because of frustration of supervisors who are not members of the students’ ethnic group. When it comes to theses exami-nation for post-graduate students, sometimes the panel members have to vote on whether the students has failed or passed and this voting often is done on ethnic lines. This means that faculty members who belong to the students’ ethnic group will vote for the student to pass and hence marginalizing those who come from minority groups. The fact that the main tribes have more professors and senior staff in the academic departments and schools and also sitting in thesis examina-tion panels will ensure that the students from those tribes will pass more often than those from the marginalized communities (Chapman, 2003).
2.6. Ethnic Languages in Universities
It is common to walk in the corridors and offices of some of the public universi-ties and constituent colleges and find that language being used is not Kiswahili which is the national language nor is it English the official language but local language spoken in that region. Some of the office staff members will even ask clients what they need in the vernacular language of the region (CUE, 2017). Notwithstanding the fact that students in public universities and constituent colleges are admitted and drawn from all parts of the country. The lecturers are not spared as well. Some of the public universities have bulk of the lecturers coming from the county and it is not uncommon to hear them conversing in the local language with their colleagues and students (TSC, 2017).
2.7. University Students and Ethnicity
28
tribes and even ending up getting married from the same community. Instead of university students having friends from other ethnic groups they tend to asso-ciate with the students from their tribes or those they went to school with. When walking in the corridors of some of the public universities or constituent colleges you will hear all kinds of languages being spoken in the campuses instead of Kiswahili or English.
2.8. University Lecturers and Ethnicity
Lecturers in public universities in Kenya are recruited by the individual univer-sity’s councils. The Commission for University Education (CUE) is mandated by law to regulate higher education in Kenya and has outlined the criteria for quali-fication for each category of the faculty in both public and private universities. Every year when there is general election in Kenya tensions and sometimes fighting and tension has erupted between ethnic groups emanating from election disputes. This was witnessed in 2007/2008 post-election violence (PEV) that left over 1300 people dead in various parts of the country.2 In the violence that
oc-curred, the public universities were not spared in terms of students and staff members. The main contest was on the presidential results between Mr. Mwai Kibaki (Kikuyu) and the opposition leader Mr. Raila Odinga (Luo). Mr. Raila was supported by Mr. William Ruto (Kalenjin) and Mr. Kibaki had Mr. Uhuru Kenyatta (Kikuyu) as his supporter. In some instances, the Kikuyu lecturers who were teaching in universities located in Luo or Kalenjin land and vice versa feared for their lives. Some had their homes torched and others even lost their lives and property. In fear of their lives, many sought employment in universities which were in their locality where they felt safe. Today, in the public universities, faculty members from one ethnic group are found to be more in a university which is located in their county. One of the reasons attributed to this is the fact that the lecturers feel safer working in “their” university than if they were work-ing in a “foreign” university located in another county. The situation is made worse by the fact that the Vice Chancellors in some of the public universities and constituent colleges are drawn from the local community. It is not surprising therefore; in 2016 the political leaders in Uasin Gishu County were demonstrat-ing against the newly appointed actdemonstrat-ing Vice Chancellor of Moi University whom they were accusing of not being from their tribe. The political leaders wanted the Cabinet Secretary to appoint a Kalenjin as Vice Chancellor from among the top Kalenjin professors in the university (TI-K, 2015).
2.9. University Councils
The university councils are appointed and constituted by the Cabinet Secretary (CS) for Education. Each university council has two representatives from the Government, one from the Ministry of Education and another from the Ministry
2During the 2007/2008 post-election violence, PEV many people fled where they had been settled
29
Table 5. Ethnic representation of council members of public universities and constituent
colleges in Kenya.
S/N Ethnic Group Frequency Percentage
1 Kikuyu 25 14.3
2 Kalenjin 24 13.7
3 Luo 20 11.4
4 Luhya 17 9.7
5 Kamba 13 7.4
6 Somali 11 6.3
7 Mijikenda 11 6.3
8 Meru 11 6.3
9 Taita 7 4
10 Kisii 6 3.4
11 Embu 6 3.4
12 Maasai 5 2.9
13 Teso 3 1.7
14 Swahili 3 1.7
15 Asians 2 1.1
16 Samburu 2 1.1
Total 168 100
Source: NCIC (2016).
of Finance. The other members of the university council are appointed by the CS. The Vice Chancellor is an ex-official member of the university council by the virtue of being the Chief Executive Officer (CEO) of the university. The univer-sity councils ideally are composed of nine (9) members, which include the Vice Chancellor. The university councils are charged with the responsibility of the general governance of the university. The role of the day-to-day running of the university is left to the CEO of the university, the Vice Chancellor (CUE, 2017).
From Table 5 it is evident that 50% of the council members and their chair-persons come from the top four largest communities, namely; the Kikuyu, the Kalenjin, the Luhya, and the Luo. This leaves the other 50% to be shared by the 38 of the rest of the ethnic groups within the country. It is worth noting that those communities which were exposed to the missionaries first had their child-ren going to school. This means these communities have more eligible members appointed as council members, hence the dominance of the more educated tri-bes in the university councils.3
2.10. Geographical Location of Public Universities
According to the Constitution of Kenya (2010) education including higher edu-3The Cabinet Secretary for Education in Kenya has instituted changes (2017) in the appointment of
30
cation is mainly the responsibility of the National Government not the County Governments. Devolution is covered under Chapter 11 of the Kenya Constitu-tion and the powers and funcConstitu-tions of the two levels of Government are clearly spelt out in the Fourth Schedule. The Universities Act (2012) places the respon-sibility of management of higher education to the Commission for University Education (CUE). The Commission ensures the establishment of public univer-sities and constituent colleges in each of the Counties, giving priority to Coun-ties that do not have universiCoun-ties (Constitution of Kenya, 2010: p. 174).
The coding of the counties was done starting from the coastal region of Mombasa to upcountry. Therefore, Mombasa was given county number 001 and Nairobi 047 as shown in Table 6. It is worth noting that apart from Nairobi County, which is the capital city of the country, all the counties are ethnically based. This means that if you examine composition of each and every county in Kenya, the residents therein share a common history, race, religion, language or dialect, physical appearance, political affiliation and culture. The location of universities and constituent colleges in Kenya, is mostly politically motivated. This means the government of the day will locate a university or a constituent college in particular region for political gain. In most cases, the counties inhi-bited by the ethnic group/tribe which supports that government are rewarded with a public university or a constituent colleges being located there. If a county is regarded as an opposition zone to the government in power, then a public university might be denied. In some instances, the ethnic group might be an opposition county and therefore be rewarded or promised a public university if they support the current regime in general elections. The rationale behind this reward is that there are real or imagined benefits of having a public university or a constituent colleges within a county and “it is our time to eat syndrome, whe-reby the leaders of the day want to reward their people when in power”. Some of these benefits include, employment of the local people in the university, local entrepreneurs can benefit by doing business with the university, students from the county can benefit by attending the local university whereby they can save on going to universities in far areas in terms of transportation, food and ac-commodation (they can commute from their homes).
Out of the 47 counties, 20 have a public university or a constituent college and 17 do not have a single one located there. Nairobi alone has 5 major public uni-versities namely, University of Nairobi, Kenyatta University, Multimedia Uni-versity of Kenya, the Cooperative UniUni-versity of Kenya, and Technical UniUni-versity of Kenya. Not to mention that Jomo Kenyatta University of Science and Tech-nology though in Kiambu County is less than 10 kilometers away from Kenyatta University.
31
Table 6. Distribution of universities in the 47 counties in Kenya.
S/N County No. of Univ. Universities
1 Mombasa 1 Technical University of Mombasa
2 Kwale N/A N/A
3 Kilifi 1 Pwani University
4 Tana River N/A N/A
5 Lamu N/A N/A
6 Taita Taveta 1 Taita Taveta University College
7 Garissa 1 Garissa University College
8 Wajir N/A N/A
9 Mandera N/A N/A
10 Marsabit N/A N/A
11 Isiolo N/A N/A
12 Meru 1 Meru University of Science and Technology
13 Tharaka Nithi 1 Chuka University
14 Embu 1 University of Embu
15 Kitui 1 South Eastern Kenya University
16 Machakos 1 Machakos University
17 Makueni N/A N/A
18 Nyandarua N/A N/A
19 Nyeri 2 Karatina University, Dedan Kimathi University of Technology 20 Kirinyaga 1 Kirinyaga University of Science and Technology
21 Murang’a 1 Murang’a University of Science and Technology
22 Kiambu 1 Gatundu University College, Jomo Kenyatta University of Science and Technology
23 Turkana 1 Turkana University College
24 West Pokot N/A N/A
25 Samburu N/A N/A
26 Trans Nzoia N/A N/A
27 Uasin Gishu 2 Moi University, University of Eldoret
28 Elgeyo Marakwet N/A N/A
29 Nandi 1 Koitalel Samoei University College
30 Baringo N/A N/A
31 Laikipia 1 Laikipia University
32 Nakuru 1 Egerton University
33 Narok 1 Maasai Mara University
34 Kajiado N/A N/A
35 Kericho 1 University of Kabianga
36 Bomet 1 Bomet University College
32 Continued
38 Vihiga 1 Kaimosi University College
39 Bungoma 1 Kibabii University
40 Busia 1 Alupe University
41 Siaya N/A N/A
42 Kisumu 3 Jaramogi Oginga Odinga University of Science and Technology, Maseno University
43 Homa Bay 1 Tom Mboya University College
44 Migori 1 Rongo University
45 Kisii 1 Kisii University
46 Nyamira N/A N/A
47 Nairobi 5 The University of Nairobi, Multimedia University of Kenya, Technical University of Kenya, Kenyatta University, Co-operative University of Kenya
TOTAL 38
Source: NCIC (2016).
nomically viable in terms of agriculture. This development includes setting up of schools and other institutions of learning, infrastructural development and ap-pointment/employment in top government positions. This trend of marginaliza-tion was entrenched further by the independence governments which were led by African presidents (all the four presidents in Kenya since independence have rotated from within the two majority ethnic groups Kikuyus and the Kalenjins, because even voting in general elections is done on ethnic lines).
3. Conclusion
33
References
Commission for University Education (CUE) (2017). Academic Staff Qualifications.
http://www.cue.or.ke/
Constitution of Kenya (2010). The Fourth Schedule.
https://www.kenyaembassy.com/pdfs/the%20constitution%20of%20kenya.pdf Kenya National Bureau of Statistics (KNBS) (2009). Census.
https://www.knbs.or.ke/
Ministry of Education, Science and Technology (MOEST) (2017). Access to Education.
http://www.education.go.ke/index.php/online-services/form-one-selection
Mwiria, K. M. (2006). Public & Private Universities in Kenya. New Challenges, Issues & Achievements. Nairobi: East African Educational Publishers.
National Cohesion and Integration Commission (NCIC) (2016). Publication No. 3/2016. Taaliu, S. T. (2011). Perspectives on the Teaching Profession in Kenya: Perception, Status,
and Job (Dis) Satisfaction. Germany: Lambert Academic Publishers. Teachers Service Commission (TSC) (2017). https://www.tsc.go.ke
Transparency International Kenya (TI-K) (2015). Promoting Integrity in Schools.
http://www.tikenya.org/
Submit or recommend next manuscript to SCIRP and we will provide best service for you:
Accepting pre-submission inquiries through Email, Facebook, LinkedIn, Twitter, etc. A wide selection of journals (inclusive of 9 subjects, more than 200 journals)
Providing 24-hour high-quality service User-friendly online submission system Fair and swift peer-review system
Efficient typesetting and proofreading procedure
Display of the result of downloads and visits, as well as the number of cited articles Maximum dissemination of your research work
Submit your manuscript at: http://papersubmission.scirp.org/