Munich Personal RePEc Archive
Local government spending and
multidimensional poverty in Senegal:
insight from the fuzzy approach
Séne, Ligane and Cissé, Momath
International Food Policy Research Institute (IFPRI), West and
Central Africa, National Agency of Statistics and Demography
(ANSD) , Senegal
15 September 2014
Online at
https://mpra.ub.uni-muenchen.de/58972/
1
Local government spending and multidimensional poverty in
Senegal: insight from the fuzzy approach
Ligane Sene1 and Momath Cissé2
1
International Food Policy Research Institute (IFPRI), West and Central Africa. Dakar, Senegal. jalimase@yahoo.fr
2
2
Abstract
The majority of African countries, included Senegal, continue to face widespread poverty. The objective of poverty reduction is accompanied by a set of initiatives and programs that might be reflected in the government budget allocation. A crucial point is to explore, in a context of severely limited resources, how to optimize budget allocation between different sectors and therefore get higher impact without necessarily much financial resources. In an effort to inform this discussion, this paper examines the linkage between disaggregated government expenditures and poverty using the most recent poverty monitoring survey in Senegal. Unlike most previous studies, our analysis is based on fuzzy set theory in the aim to find a suitable, complete and reliable way of measuring poverty, to overcome the limitations of the one-dimensional framework, and better assess the impact of prior government expenditures. High heterogeneity in poverty appears from the decomposition of the overall poverty by location and by household head’s characteristics. The results from the model, elucidate that previous government spending in infrastructure and spending on social development and women entrepreneurship yielded some positive impacts on poverty.
These results provide useful policy insights for helping to improve the effectiveness of expenditures in reducing poverty.
3
1. Introduction
Senegal’s economy has returned to growth during recent years. The Gross Domestic Product (GDP) on average grew by around 5% since 1995. However, the recorded economic performance has not contributed as much as we hoped to improve the living conditions of populations and to a substantial reduction of poverty. Indeed, with a Human Development Indicator (HDI) of 0.459 in 2011 Senegal remains among the least developed countries, despite the increase of government willingness to fight against poverty and food insecurity through several development programs implemented since the late 1900s in addition to the Millennium Development Goas (MDGs), which call for a reduction of the proportion of people with less than US$1 per day. The national poverty rate was estimated at 46.7% in 2011 according to the traditional measurement approach with a small improvement in 2012 to 5 out of eleven men (45.39%) living below the poverty line. Figures show disparities across places of residence and regions. The present paper is related to two strands of the literature. It explores the linkages between public expenditure and poverty reduction at the household level by taking a fuzzy approach for poverty measurement.
Public investments have beneficial welfare effects for households, as they can positively impact on the quantity, availability as well as the quality of goods and services. To take into account this we assume a household utility function of the form:
) (1)
Where is the utility of household living in the community , the household characteristics, are the prices of the various market goods and services and represents various good and services publicly provided at community level and consumed by households. We disaggregate government spending in the aim to allow comparison between policy options. This analysis wants to assess ex-post the impact of past regional public spending on household poverty, in a perspective of evaluating ex-ante potential future investments.
4
authors (Sala-i-Martin, 1997). The impact of public spending on productivity was also examined in the literature with evidence of positive impacts (Mitra et al, 1998; Binswanger et al. 1993; Badiane and Ulimwengu 2013; Allen et al., 2014). Some authors have also estimated the effect of public investment on poverty. Fan et al. (1999) using cross-state data, particularly in India found that agricultural R&D, rural roads, rural education and targeted rural development expenditures have a negative and significant effect on rural poverty. Fan et al. (2004) assess also the effects of different types of government expenditure on agricultural growth and rural poverty in Uganda using district-level data for 1992, 1995, and 1999. Their findings show that government spending on agricultural research and extension had the largest measured returns to growth in agricultural production and impact on poverty reduction. Government spending on roads, mainly low grade roads and also Education had been established to have an impact on poverty reduction. Using cross-country data, Gomanee et al. (2003) and Mosley et al. (2004) have estimated the effects of government expenditure in different sectors on the poverty headcount. Their findings show that government expenditure on education, agriculture and housing and amenities (water, sanitation and social security) all have a negative impact on poverty.
This paper moves towards these thematic researches by using government budget data that come from SIGFIP (Integrated Management System of Public Finance) and the most recent household poverty survey in Senegal, ESPS II (Poverty Monitoring Survey in Senegal). The purpose is to shed light on the relationship between the composition of the government spending at a disaggregated level and poverty reduction after computing an appropriate poverty measurement as it is widely recognized that poverty and development are multidimensional and go beyond the economic growth and household incomes.
5
expenditures that potentially have implications other than effects on household’s disposable income.
The adopted fuzzy approach tries to improve the vague and dichotomous classification that separates poor individuals from non-poor based on a poverty line. Instead of this simplistic approach, poverty status is gradually represented with membership function corresponding to a number between zero (non-poor without ambiguity) and one (clearly poor). The theory of fuzzy sets was first conceptualized by Lotfi Zadeh in 1965. It is a mathematical theory that represents the vagueness and the uncertainty of certain classes of objects and is often applied in classes where the definition of membership is not accurate. Cerioli and Zani (1990) are the first who adapt this concept to poverty analyses. In the traditional theory of poverty analysis, there are two possible situations for individuals or households: belonging and not belonging. By introducing a degree of membership of an element in a set, Zadeh wanted to go beyond the Boolean logic with the new concept of weighted membership of an element to a set that classify elements according to their level of membership.
The rest of the paper is structured as follows. The fuzzy approach used to compute poverty measure is presented firstly. Secondly the theoretical framework is exposed. Finally, the last section presents and provides discussions on the results.
2. Key features of Senegal economy
Agriculture is the main economic activity in rural areas (60% of the population), accounts for around 45% of the workforce in 2012 (EPSPS, 2011) with a contribution to GDP of around 15% in general. Nevertheless, the sector faces to several problems and the production growth has fallen since from the late 1960s. The annual growth rate of the national GDP between 2005 and 2008 is around 3.5% and below the government target of 7% as specified in the Strategy of Accelerate Growth (SCA).
6
There is a need to underline the challenges that the government face up with this small decline of poverty which went along with an absolute increase in the number of poor during this period.
3. Methodology
3.1.Fuzzy set concept
A brief mathematical exposition of the fuzzy sets principle follows. Let be a set. A fuzzy subset of can be defined as the set of couples
{ } For all ε A
is the membership function corresponding to an application applied to ε and representing the degree of belonging of in .
{ , δ ∈
] 0, 1[ (2)
In case of the traditional approach of poverty analysis this function takes its value in { } where individuals are whether poor or whether non-poor. However, as poverty is not a sharp concept we can use the same above method to define the fuzzy set of poor.
3.2.Membership function and weighting system
7
with the different modalities. These modalities are ordered in ascending order regarding poverty risk.
Let’s consider a set of K indicators , ).
To define the membership function, consider a set of individuals or households in deprivation considering the indicator where K is the total number of deprivation indicators.
Let’s suppose the variable has modalities , ,…, ).
Each individual in the population takes a value for the variable . After ordering these modalities, such that an increase denotes a worsening of the privation status, we can associate a score for each modality as described in the following relationship:
< …<
In general, the first integers are chosen as scores associated with these modalities. However, this method is based on the assumption that the corresponding degrees of depreciation are spaced by one (1) meaning that =1, , or even equally spaced.
Given the ordinal nature of the variable , one possibility is to find a modality that corresponds to a situation favorable enough to exclude poverty and similarly to choose a modality associated with such bad conditions that poverty cannot be denied. Thus, let’s define and the corresponding scores such that for any value below there is no poverty and for any value above there is poverty. The membership function as proposed by Cerioli and Zani is then expressed as follows:
{
8
is the corresponding score for the modality that takes individual i regarding the variable . The degree of belonging to the fuzzy set increases proportionally to the proximity to poverty. Say in other worlds, individuals or households who have conditions that are best associated with degradation of well-being have the larger scores.
Regarding continuous variables, such as income or household out-of-pocket expenditures, there are also several methods that try to consider the uncertainty of the poverty line (Atkinson, 1987; Foster and Shorrocks 1988; Kakwani, 1995). Cheli and Lemmi (1995) proposed the totally fuzzy and relative method for categorical and continuous variables. Their approach is not based on the choice of a limit. They reason in relative terms taking into account the overall situation in the society and suggest the following membership function:
{
( ) ( ) ( )
( )
(4)
Where ( ) represents the degree of belonging to the set of an individual showing modality for the variable and stands for the cumulative distribution function of the variable , the modalities being ranked by increasing risk of poverty. corresponds to the ordered modalities of .
Cheli and Lemmi establish the following membership functions for continuous variables:
9
Discussion on the complexity reduction that transforms all individual membership functions described previously is provided in what follows.
The value of membership to the fuzzy subset of multidimensional poverty ( ) of an individual depends on its degree of belonging to the different fuzzy sets , corresponding to the specific deprivation indicators . The general membership function takes the following form
). The function can be defined in different ways like the
specification below.
) = [∑ ( ) ] , 0 , ∑ (5)
is the weights assigned to the different deprivation indicators in the aggregation process. It captures the importance of each indicator in the description of the overall poverty status of individuals.
Cerioli and Zani propose the following weighting system as an inverse function of average deprivation level. This approach gives more importance to the less frequent indicator describing poverty:
∑ ⁄̅̅̅̅̅
⁄̅̅̅̅̅
(6)
̅̅̅̅ ∑ represents the fuzzy proportion of deprived individuals according to the
indicator (for more details see Cheli and Lemmi,1995; Miceli, 1998).
3.3. Modeling poverty and regional public spending
Similarly to the equation (1), a multilevel mixed-effects linear model is estimated in order to take into account the nested structure of our data. We specified a model with the logit transformation3 of the multidimensional poverty index as dependent variable, which is expressed as a linear
3
10
function of household characteristics ( and the average disaggregated prior public expenditures over the period 2007-2010 .
Assuming heterogeneity in poverty level across individuals and across regions, our empirical model takes the form described below, in which represent the household identifier and household location.
+ ∑
corresponds to government actions that may lower poverty ( by raising income or by affecting other deprivation indicators, is specified as a random disturbance. Therefore, government expenditures at community level appear as a factor that might lower specific poverty through their effects on the intercept.
4. Results and discussions
4.1.Poverty description
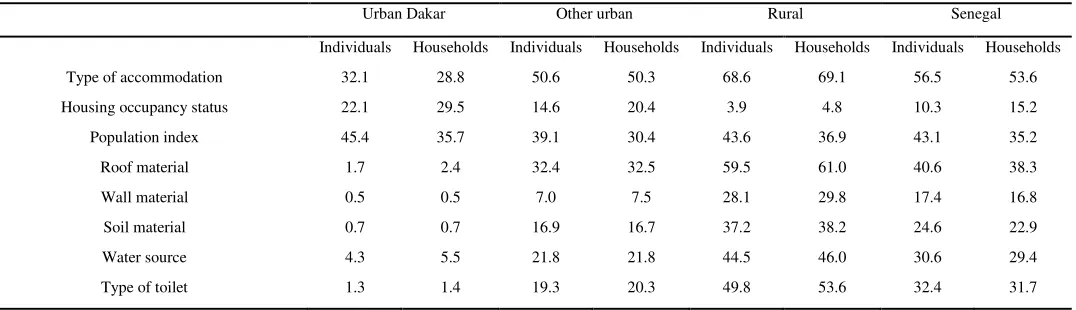
The decomposition of the multidimensional poverty index in the fuzzy one-dimensional index is presented in Table 1 and allows measuring the poverty level with regards to each specific dimension. The poverty level is unevenly distributed across places of residence. In urban Dakar, the fuzzy proportion of poverty is higher with the durable good deprivation indicator (82.9% household level and 81.5% when measured at the individual level). For this same dimension, the fuzzy proportion of households is estimated at 85.7% when considering the overall country. These values reflect a relative low level of ownership of durable goods by households living in urban Dakar. The fuzzy proportion related to the wall material dimension equals to 0.5%, while it is estimated at 7.5% for households living in other urban areas and 29.8% for households in rural areas.
11
46.5% for individuals. Both analyses yield similar measures with regard to the consumption dimension.
[Place Table 1 here]
Results indicate that rural households are the poorest and show that the fuzzy proportions obtained when reasoning in terms of household are very close to those obtained at the individual level.
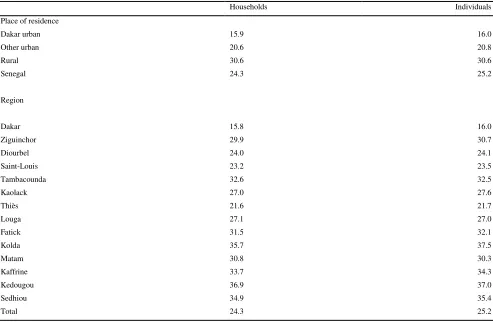
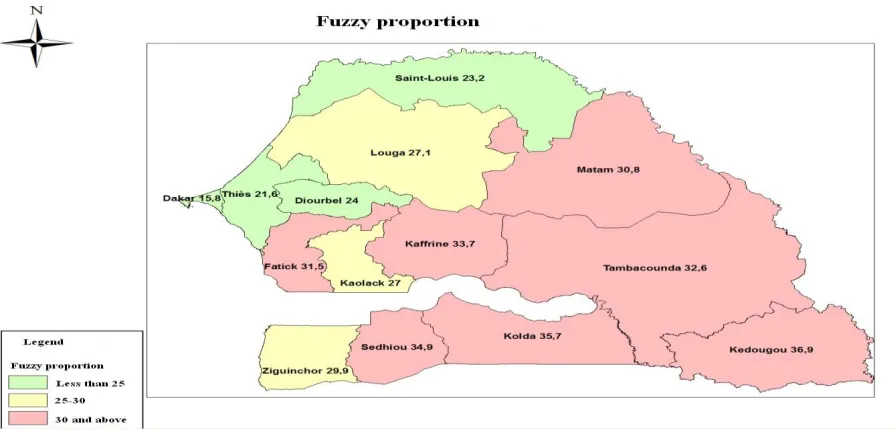
The overall poverty rate of households is estimated at 24.3% with high heterogeneity across locations. In rural areas the fuzzy proportion of poor households is evaluated at 30.6%, while it equals 20.6% in the other urban areas and 15.9% in urban Dakar. These differences between areas might reflect disparities in urbanization, financial and market opportunities between these types of location.
The regional decomposition presented in Table 2 reveals the poorest regions in the country. In fact, it appears that Kedougou contains the largest proportion of poor households (36.9%) among regions, whereas Dakar is the least poor with a fuzzy proportion of poor households estimated at 15.8%.
[Place Table 2 here]
The decomposition of the fuzzy proportion of poor households by sex shows that households headed by women are less poor (20.3) than those headed by men (25.8). This trend is the same in all strata except in Dakar (Table 3).
12
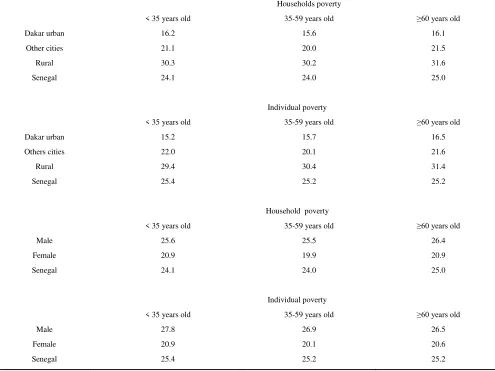
Age of the household head is an important factor explaining poverty and offers possibility for welfare comparison between people living in households headed by the elderly and those headed by younger individuals. Households headed by individuals aged less than 35 years represents 11.3%, 62.3% for those headed by men aged 35-59 years and 26.3% for those headed by persons older than 60 years (National Agency of Statistics and Demography/ANSD, ESPS 2011). In Dakar the fuzzy proportion of poor households is more pronounced among households headed by young people (under 35 years) with 16.2%, while in rural and other urban areas it is estimated respectively at 30.3% and 21.1%. There is a similar poverty distribution regarding age within the different locations (Urban Dakar, Other urban areas and rural areas) at the individual level (see Appendix A1).
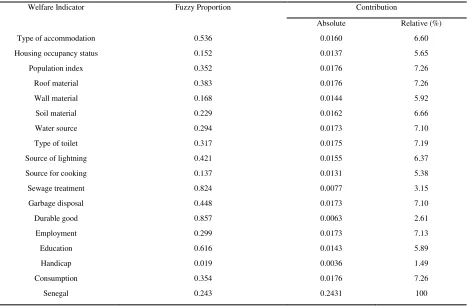
A breakdown of the poverty indicator provides information about the contribution of each individual indicator. Population size index, roof material and consumption are the factors that contribute the most to the fuzzy proportion of poor households each of them accounting for 7.26% (Appendix Table A2).
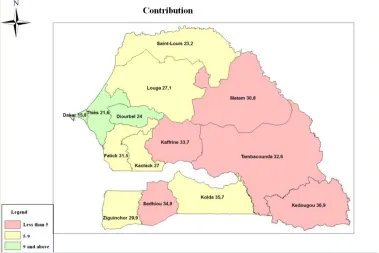
Dakar region is the least poor region, but has the highest contribution to poverty. This could be explained by its important weight relative to the total number of households (29% of the total number of households in Senegal). Contrarily, Kedougou is the poorest region (36.9%) but contributes less to the fuzzy proportion of poor households in Senegal (1.53%). We find that the newly created regions (Kedougou, Kaffrine, Sedhiou and Matam) are those who have the lowest contributions (Appendix Table A3). Figures A1 and A2 allows visualization of regional contributions and the magnitude of poverty across space through a more comprehensive and homogenous classification.
4.2. Government spending and poverty outcomes
13
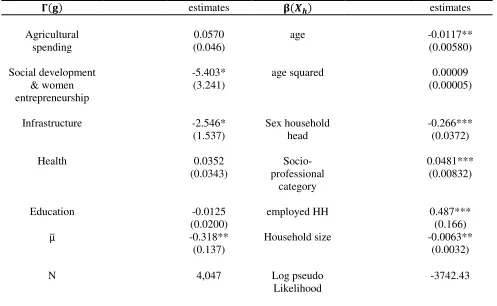
socio-professional category and household size, on poverty. Significant effects of spending on social development and women entrepreneurship are also found.
Encouraging and supporting entrepreneurial initiatives of women has a valuable contribution to poverty reduction and can be a fruitful strategy. This might reflect the important role of entrepreneurship that can increase income, raise the standards of living and housing conditions among individuals and then has in general returns on the society. Women are able to contribute to child education, household overall health and can boost family finances, such as food production. This finding seems to support ideas found in many earlier studies. Sylvia and Pedwell (2008) in their study on Women, Gender and the Informal Economy states that women in developed countries have become a positive influence on poverty reduction by engaging in
business activities. Women’s activities, particularly in business empower them economically
and enable them to contribute more to overall development (Brindley, 2005). The challenge for government is a more prominent gender focus through a better integration of women as beneficiaries in development programs and to establish a favorable framework to encourage entrepreneurial activities.
The analyses also elucidate that previous government spending in infrastructure yielded some positive impact on poverty. Indeed, infrastructure can create employment and income opportunities, reduce transaction costs and facilitate market access for smallholders. Poverty reduction is likely be hastened by promoting government infrastructure projects and by targeting interventions.
No evidence in poverty reduction is found in health, education and agriculture public expenditures. However, caution should be taken when interpreting the results for agriculture spending since the recent poor performance in agriculture sector owing to the bad rainy seasons may lower the impact of public spending and overwhelm the role of agricultural spending as one of the poverty reduction drivers.
14
In a context of limited government budget, these results provide useful policy insights for helping to improve the effectiveness of expenditures in reducing poverty.
5. Conclusion
Using the most recent household survey data, this paper explored the linkage between disaggregated public expenditures at regional level and multidimensional poverty measure, which is computed applying the fuzzy set approach. The fuzzy set index of poverty is a more realistic and appropriate measures than the traditional monetary approach because it considers all potential dimensions that describe deprivation. The objective was to evaluate poverty in its all aspects and provide a country-led strategic framework for action.
The results obtained from the poverty decomposition indicate the heterogeneous poverty level across regions and show that households living in rural areas and with old heads have the highest level of deprivation. While there is evidence of the positive effect of prior infrastructure spending, social development and women entrepreneurship spending on poverty, we found no significant effect of spending in health, education and agriculture. However, this can be highly nuanced giving the last poor performance in the agricultural sector that may substantially affect the efficiency of public expenditures.
Attention has to be focused on the composition of government budget with a substantial part devoted to infrastructure. The government can also reach its goals regarding poverty reduction by emphasizing the importance of supporting social development and women entrepreneurship.
15
Bibliography
Allen, S., Badiane, O., Sene, L. and Ulimwengu, J. (2014), Government Expenditures, Health Outcomes and Marginal Productivity of Agricultural Inputs: The Case of Tanzania. Journal of Agricultural Economics, 65: 637–662. doi: 10.1111/1477-9552.12063.
Atkinson, A.B. 1987. On the measurement of poverty. Econometrica, vol. 55, no. 4, pp. 749–64.
Badiane, O., and J. Ulimwengu. (2009). The growth–poverty convergence agenda: Optimizing social expenditures to maximize their impact on agricultural labor productivity, growth, and poverty reduction in Africa. Discussion Paper 00906. Washington, D.C.: International Food Policy Research Institute.
Badiane, O. and Ulimwengu, J. (2013). Malaria incidence and agricultural efficiency in Uganda.
Agricultural Economics, 44(1), 15-23.
Barro, R. (1991). Economic Growth in a Cross-section of Countries. Quarterly Journal of Economics 106 (2): 407–43.
Binswanger, H. P., Khandler, S. R. and Rosenzweig, M. R. (1993). How Infrastructure and Financial Institutions Affect Agricultural Output and Investment in India. Journal of Development Economics 41: 337-66.
Brindley, C. (2005). Barriers to women achieving their entrepreneurial potential: Women and Risk. International Journal of Entrepreneurial Behaviour, 11(2), 144-61.
Cerioli, A. and Zani, S. (1990). A fuzzy approach to the measurement of poverty, in Dagum, C. and Zenga, M. (eds), Income and Wealth Distribution, Inequality and Poverty, Studies in Contemporary Economics, Springer Verlag, Berlin, pp. 272–84.
16
Devarajan, S., Swaroop, V. and Zou, H. (1996). The Composition of Public Expenditure and Economic Growth. Journal of Monetary Economics 37: 313–44.
Edward Anderson, Paolo de Renzio and Stephanie Levy. (2006). The Role of Public Investment in Poverty Reduction: Theories, Evidence and Methods. Working Paper 263. Overseas Development Institute.
Elias, V. (1985). Government expenditures on agriculture and agricultural growth in Latin America. Research Report 50. Washington, D.C.: International Food Policy Research Institute.
Fan, S., P. Hazell, and S. Thorat. (1999). Linkages between government spending, growth, and poverty in rural India. Research Report 110. Washington, DC: International Food Policy Research Institute.
Fan, S., X. Zhang, and N. Rao. (2004). Public expenditure, growth, and poverty reduction in rural Uganda. Development Strategy and Governance Division Discussion Paper No. 4. Washington, DC: International Food Policy Research Institute.
Foster, J.E. and Shorrocks, A.F. (1988). Inequality and poverty orderings. European Economic Review, vol. 32, nos 2–3, pp. 654–62.
Gomanee, K., Morrissey, O., Mosley, P. and Verschoor, A. (2003). Aid, Pro-poor Government Spending and Welfare. CREDIT Research Paper 3. Nottingham: University of Nottingham, CREDIT.
Kakwani, N.C. (1995). Measuring poverty with uncertain poverty line. Journal of Income Distribution, vol. 5, no. 2, pp. 201–10.
Miceli , D. (1998). University of Canberra. National Centre for Social and Economic Modelling. Discussion paper no. 38.
17
Mitra, A., Varoudakis, A. and Veganzones, M. (1998). Croissance de la Productivité et Efficacité Technique dans L'industrie Manufacturière des Etats de l'Inde. Le Rôle des Infrastructures, Revue Economique, 49 (3): 845–55.
Misango, S., and orpha k. Ongiti, O. (2013). Do Women Entrepreneurs Play a Role in Reducing Poverty? A Case in Kenya. International review of management and business Research, vol. 2 issue. 1.
Mosley, P., Hudson, J. and Verschoor, A. (2004). Aid, Poverty Reduction and the New Conditionality. Economic Journal 114, June: F217–F243.
Pardey, P. G., J. Roseboom, and N. M. Beintema. (1997). Investments in African agricultural research. World Development 25(3): 409–23, March.
Sala-i-Martin, X. (1997). I Just Ran Two Million Regressions. American Economic Review 87 (2): 178–83.
Sylvia, C., and Pedwell, C. (2008). Women, gender and the informal economy: An assessment of ILO research and suggested ways forward/Sylvia International Labor Office. Geneva: ILO, 2008.
Zadeh, L.A. (1965). Fuzzy sets. Information and Control. vol. 8, pp. 338–53.
[image:18.612.43.581.565.720.2]Tables
Table 1: Poverty, household location and terms
Urban Dakar Other urban Rural Senegal
Individuals Households Individuals Households Individuals Households Individuals Households
Type of accommodation 32.1 28.8 50.6 50.3 68.6 69.1 56.5 53.6
Housing occupancy status 22.1 29.5 14.6 20.4 3.9 4.8 10.3 15.2
Population index 45.4 35.7 39.1 30.4 43.6 36.9 43.1 35.2
Roof material 1.7 2.4 32.4 32.5 59.5 61.0 40.6 38.3
Wall material 0.5 0.5 7.0 7.5 28.1 29.8 17.4 16.8
Soil material 0.7 0.7 16.9 16.7 37.2 38.2 24.6 22.9
Water source 4.3 5.5 21.8 21.8 44.5 46.0 30.6 29.4
18
Source of lightning 6.5 7.2 15.2 16.7 71.0 72.3 44.8 42.1
Source for cooking 27.1 32.0 10.5 13.3 2.6 3.4 9.9 13.7
Sewage treatment 57.7 55.8 82.5 82.1 97.9 97.8 85.5 82.4
Garbage disposal 29.0 28.3 27.4 27.8 61.9 61.3 47.3 44.8
Durable good 81.5 82.9 83.6 84.7 86.9 87.7 85.0 85.7
Employment 42.5 36.5 42.8 39.0 22.8 22.4 31.4 29.9
Education 63.4 58.8 61.8 59.6 71.3 70.3 65.0 61.6
Handicap 1.5 1.0 2.7 2.3 2.3 2.3 2.2 1.9
[image:19.612.40.580.71.210.2]Consumption 25.7 17.1 41.3 32.0 56.8 47.3 46.5 35.4
Table 2: Poverty and household location
Households Individuals
Place of residence
Dakar urban 15.9 16.0
Other urban 20.6 20.8
Rural 30.6 30.6
Senegal 24.3 25.2
Region
Dakar 15.8 16.0
Ziguinchor 29.9 30.7
Diourbel 24.0 24.1
Saint-Louis 23.2 23.5
Tambacounda 32.6 32.5
Kaolack 27.0 27.6
Thiès 21.6 21.7
Louga 27.1 27.0
Fatick 31.5 32.1
Kolda 35.7 37.5
Matam 30.8 30.3
Kaffrine 33.7 34.3
Kedougou 36.9 37.0
Sedhiou 34.9 35.4
Total 24.3 25.2
Table 3: Poverty and sex of household head
[image:19.612.60.553.319.641.2]19
Male Female Male Female
Urban Dakar 15.6 16.3 15.6 16.7
Other urban 20.8 20.3 20.9 20.5
Rural 31.9 24.9 31.9 23.8
[image:20.612.59.556.235.541.2]Senegal 25.8 20.3 26.8 20.4
Table 4: Public spending and poverty
estimates estimates
Agricultural spending
0.0570 (0.046)
age -0.0117**
(0.00580) Social development & women entrepreneurship -5.403* (3.241)
age squared 0.00009
(0.00005)
Infrastructure -2.546*
(1.537)
Sex household head
-0.266*** (0.0372)
Health 0.0352
(0.0343) Socio-professional category 0.0481*** (0.00832)
Education -0.0125
(0.0200)
employed HH 0.487***
(0.166)
̅ -0.318**
(0.137)
Household size -0.0063**
(0.0032)
N 4,047 Log pseudo
Likelihood
-3742.43
20
[image:21.612.58.553.273.644.2]Appendix
Table A1: Poverty and age of household head
Households poverty
< 35 years old 35-59 years old ≥60 years old
Dakar urban 16.2 15.6 16.1
Other cities 21.1 20.0 21.5
Rural 30.3 30.2 31.6
Senegal 24.1 24.0 25.0
Individual poverty
< 35 years old 35-59 years old ≥60 years old
Dakar urban 15.2 15.7 16.5
Others cities 22.0 20.1 21.6
Rural 29.4 30.4 31.4
Senegal 25.4 25.2 25.2
Household poverty
< 35 years old 35-59 years old ≥60 years old
Male 25.6 25.5 26.4
Female 20.9 19.9 20.9
Senegal 24.1 24.0 25.0
Individual poverty
< 35 years old 35-59 years old ≥60 years old
Male 27.8 26.9 26.5
Female 20.9 20.1 20.6
21
Table A2: Contribution to poverty
Welfare Indicator Fuzzy Proportion Contribution
Absolute Relative (%)
Type of accommodation 0.536 0.0160 6.60
Housing occupancy status 0.152 0.0137 5.65
Population index 0.352 0.0176 7.26
Roof material 0.383 0.0176 7.26
Wall material 0.168 0.0144 5.92
Soil material 0.229 0.0162 6.66
Water source 0.294 0.0173 7.10
Type of toilet 0.317 0.0175 7.19
Source of lightning 0.421 0.0155 6.37
Source for cooking 0.137 0.0131 5.38
Sewage treatment 0.824 0.0077 3.15
Garbage disposal 0.448 0.0173 7.10
Durable good 0.857 0.0063 2.61
Employment 0.299 0.0173 7.13
Education 0.616 0.0143 5.89
Handicap 0.019 0.0036 1.49
Consumption 0.354 0.0176 7.26
Senegal 0.243 0.2431 100
Table A3: Contribution to poverty of regions
Region Fuzzy proportion Contribution
Absolute Relative (%)
Dakar 0.158 0.046 19.129
Ziguinchor 0.299 0.021 8.896
Diourbel 0.24 0.024 9.825
Saint-Louis 0.232 0.015 6.238
Tambacounda 0.326 0.013 5.513
[image:22.612.69.546.589.714.2]22
Thiès 0.216 0.024 9.764
Louga 0.271 0.016 6.483
Fatick 0.315 0.015 6.145
Kolda 0.357 0.015 6.220
Matam 0.308 0.012 4.940
Kaffrine 0.337 0.011 4.499
Kedougou 0.369 0.004 1.535
Sedhiou 0.349 0.010 4.186
[image:23.612.65.544.270.366.2]Senegal 0.243 0.243 100
Table A4: Contribution to poverty by strata
strata Fuzzy proportion Contribution
Absolute Relative (%)
Urban Dakar 0.159 0.046 18.85
Other Urban 0.206 0.044 17.53
Rural 0.306 0.154 63.60
Senegal 0.243 0.243 100.00
[image:23.612.73.521.454.669.2]
23
Figure A2: Regional contribution to poverty