Munich Personal RePEc Archive
Are You Experienced?
Shachat, Jason and Wang, Hang
Xiamen University
29 June 2014
Online at
https://mpra.ub.uni-muenchen.de/57672/
Are You Experienced?
Jason Shachat
✯and Hang Wang
❸July 29, 2014
Abstract: We evaluate how traders’ asset market activities are distributed in time impacts pricing efficiency, volume, and individual portfolio holdings. Through the first con-trolled experiment on such timing, we find that cohorts who participate in a sequence of three markets in a single experimental session generate more mispricing and bubbles - but the same trade volume and variability in portfolio values - than cohorts whose three markets are spaced a week apart. We further find that experience gained through spaced repetitions, as opposed to massed repetitions, leads to smaller price bubbles when subjects are recruited to a new cohort and participate in a market for a different asset.
Keywords: Spacing effects; learning; asset market; bubble; laboratory experiment
JEL Classification Numbers: C92, G12, D03
✯e-mail: [email protected]. Wang Yanan Institute for Studies in Economics and the Finance and Economics Experimental Laboratory, Xiamen University
1
Introduction
Less experienced individuals make poorer financial decisions, ceritus paribus, than
expe-rienced ones (Feng and Seasholes, 2005; Chen et al., 2007; Nicolosi et al., 2009; Seru et al.,
2010). Additionally, the larger the contingency of inexperienced traders populating an asset
market, the more likely the occurrences of inefficiencies like bubbles and other mispricing
(Kandel et al., 1993; Greenwood and Nagel, 2009; Korniotis and Kumar, 2011). But what
constitutes experience? Is it purely the amount of market participation, or does the calendar
time this participation spans matter as well? Using laboratory experiments, we address these
questions by controlling the number and timing of cohorts’ participation in asset markets.
Overpricing and then crashing to fundamental value is a robust phenomenon in
experi-mental markets for assets with declining fundaexperi-mental value, which was first discovered by
Smith et al.(1988).1 Their study - and a variety subsequent ones - showed that when traders
have repeated experience in markets with the identical asset the formation of bubbles
re-duces. The procedures for how subjects are exposed to market repetitions have varied across
these studies. Some studies (Smith et al., 1988; Porter and Smith, 1995; Fisher and Kelly,
2000; Hussam et al., 2008) use spaced exposures in which subjects participate in a series of experimental sessions, each on a different day, with only one market per session. Other
studies (Dufwenberg et al., 2005; Haruvy and Noussair, 2006; Haruvy et al., 2007; Kirchler
et al., 2012) use massed exposures in which subjects attend a single session and participate in consecutive markets.
Our interest in the timing of market exposures stems from the psychology literatures on
memory recall such as name learning (Carpenter and DeLosh, 2005; Ofen-Noy et al., 2003)
and advertising effectiveness (Janiszewski et al.,2003); and skills learning such as classroom
instruction (Smith and Rothkopf,1984) and motor skills (Lee and Genovese,1988). In both
of these literatures, it is well documented that spaced repeated presentations of a stimulus
1
lead to better learning outcomes - such as recall, retention, and performance - than massed
repeated presentations.
There are a multitude of proposed mechanisms for why spaced presentation is more
effective than massed presentation. Some mechanisms concern moving knowledge from short
run (working) to long run memory. For example, elaborative rehearsal is the process of
reflecting on the meaning of a new item in short term memory and associating it with
other items in memory; this assists with moving items to long term memory. The rehearsal
hypothesis (Rundus,1971), argues there is a capacity on the items that can be held in short
term and a massed presentation can disrupt elaborative rehearsal. Other mechanisms argue
that spacing leads to a reconstruction of previous repetitions which are stored in long term
memory (Jacoby,1983). This reconstruction reinforces the previous exposure and establishes
cues for future recall. However, when there is a previous exposure already in the short term
memory, as in a massed presentation, no reconstruction is required and cues are not formed.
Neuroscientists have also found correlated differences in neural activity under spaced versus
massed presentations (Xue et al., 2010, 2011).
Asset market participation differs from the learning activities considered in this vast
literature as it is an interactive, as well as a complex, task. Further, in practice, asset
markets are rarely pure replications of past market instances - perhaps equity markets more
so than bond markets - thus understanding the effectiveness of alternative ways of garnering
experience extends to similar but not identical scenarios is important.
In this study, we assess the relative effectiveness of spaced versus massed presentation of
market experience in a controlled way. First, we compare the market and trader performance
of cohorts when inexperienced, experienced, and twice experienced in replications of an asset
market. One set of trader cohorts experiences these repetitions in a massed sequence. A
second set of trader cohorts experiences them spaced exactly one week apart. The
environ-ment of the asset market - endowenviron-ments, information, and dividend process - is the same
call market. The only difference we observe between spaced and massed cohorts, conditional
upon market repetition, is greater pricing efficiency in the third participation - particularly
in the last 10 trading periods - for the spaced versus massed cohorts.
Next we test whether thrice-experienced traders create bubbles in an altered
environ-ment, as Hussam et al. do with twice experienced subjects, where subjects within the same
sequencing paradigm are mixed to form new cohorts and a different asset structure employed.
In this case both massed and spaced experienced groups create price bubbles, but the massed
one creates more severe bubbles. This provides evidence that learning from spaced
repeti-tions better extrapolates to a marker for a similar, but not identically structured, asset.
2
Experimental Design
Our experimental design consists of a baseline and a follow-up study. In the baseline
study, eighteen cohorts of nine subjects each participate in a sequence of three asset markets
with fifteen trading periods apiece. The primary treatment variable is the timing between
market instances. Ten cohorts experience the massed sequencing of markets in a single
session. The other eight cohorts experience the sequencing with exactly one week spacing.
For each of these cohorts, sessions were scheduled for the same day and time for three
consecutive weeks.
In the follow-up study, which we call rekindled, we create two new types of cohorts. We invite randomly selected members of the top seven highest earners in each baseline massed
and baseline spacing cohorts to join a new study. This gives us three rekindled massed and
three rekindled spacing cohorts. Each of these cohorts attends a single session with a single
asset market. This session is approximately four weeks after the participants attended their
first session. In this session, endowments and the distribution of the dividend are changed.
The specifics of the asset structure and endowments are as follows. In the baseline study,
set of peso amounts2 {0,0.8,2.8,6}, each equally likely. Accordingly, the expected dividend
in each period is 2.4 pesos, the fundamental value - defined as the sum of all expected
dividends remaining - is 36 pesos in the first period of a market and 0 pesos at the end of
the fifteenth period. There are three different endowment portfolio types, varying in their
cash/equity ratio but having the same expected value. See Table 1. Three subjects within
a cohort are assigned to each portfolio endowment type. Recall, a subject will receive the
same endowment in each of the three baseline markets.
In the rekindle study, we change two things. One, the dividend distribution is uniform
over the five potential peso amounts {0,0.1,0.8,2.8,9.8}. Hence, the expected dividend
amount is 2.7 pesos, and the initial fundamental value is 40.5 pesos. Second, we change
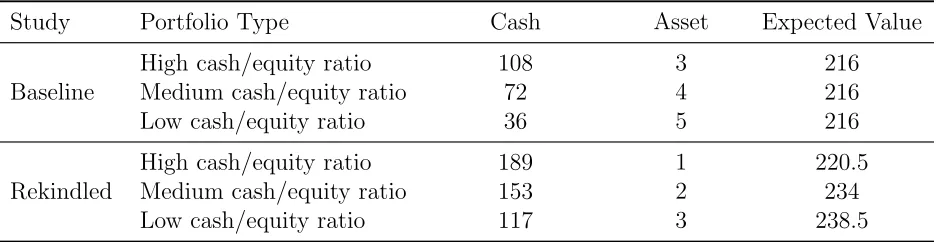
the set of three different endowment portfolio types. Again, see Table 1. Notice these two
[image:6.612.73.541.411.532.2]changes respectively increase the dividend variance and the market cash/equity ratio.
Table 1: Endowment portfolios in the markets of the baseline and rekindle studies
Study Portfolio Type Cash Asset Expected Value
High cash/equity ratio 108 3 216
Baseline Medium cash/equity ratio 72 4 216
Low cash/equity ratio 36 5 216
High cash/equity ratio 189 1 220.5
Rekindled Medium cash/equity ratio 153 2 234
Low cash/equity ratio 117 3 238.5
Trading in each market takes place in a continuous double auction.3 Each of the fifteen
periods lasts one minute and forty-five seconds. Subjects may submit limit orders (bids and
asks) for a single unit subject to improving upon the current bid or ask. The order book
is open. Subjects may also make a market buy (sale) at the current bid (ask) if available.
The order book is flushed at the conclusion of each trading period. All of the actions are
2
Prices and earnings in our experiments are measured in pesos. The conversion rate to the local currency Renminbi is 1 RMB per 7 pesos.
3
restricted by the absence of borrowing or leveraged purchasing, and a prohibition on short
sales. The user interface provides a graphic display and list of all contract prices. The
experimental software was developed in z-Tree (Fischbacher,2007).
All sessions were conducted at, and cohorts recruited from, Xiamen University, China.
Potential subjects were randomly selected from a database4 of undergraduate and graduate
students. These selected individuals were sent invitations to join either a cohort of the
massed baseline or spacing baseline study. At the conclusion of massed baseline session, a
subject received the sum of his earnings from the three markets plus a 10 RMB show-up fee.
A subject in a spacing cohort received the sum of his earnings from the three markets plus a
30 RMB show-up fee, 10 RMB for each session, only at the conclusion of the third session.5
Subjects in a rekindled session received their earnings from the single market participation
plus a 10 RMB show-up fee.
3
Hypotheses
The fundamental value of an asset in our experiment comes solely from its expected
future dividends. So, theoretically, subjects should calculate the same fundamental value for
the asset in each period, given the common knowledge of the asset structure. Furthermore,
if we assume that subjects are all risk neutral, they will be willing to pay the same maximum
price for the asset, which is equal to its fundamental value. Therefore trading with others
would not bring more profits than just holding assets through all periods. So the market
will reach a no-trade equilibrium.
The predictions of this theorem have been systematically wrong. Previous studies all
show that subjects do trade with each other, and that trade prices deviate from the
fun-4
The database is managed using the ORSEE system (Greiner, 2004).
5
damental value. However, increased collective experience amongst the traders does lead to
outcomes closer to that predicted in equilibrium. We expect to replicate such results in
our baseline treatments. In addition, we also hypothesize this experience is more effectively
gained through spaced participation in markets than massed participation. This greater
effectiveness should reflect in greater price efficiency, lower trade volume, and less variation
in final portfolio valuations in the baseline spacing treatment in both the second and third
market repetitions when compared to the baseline massed treatment.
Our first hypothesis concerns pricing efficiency.
Hypothesis 1 In the baseline study, pricing efficiency is greater for spacing cohorts than massed cohorts in market repetitions two and three.
Our second hypothesis states that the trading volume of markets for spacing cohorts
smaller than that of markets for massed cohorts. This hypothesis reflects the convergence
towards a no-trade equilibrium. If the spacing of repetitions leads to more effective learning
than massed repetitions, then subjects in spacing cohorts should understand the structure
of the market faster and better than those in the massed cohorts. Having better information
about the markets, spacing cohorts would trade less than massed cohorts.
Hypothesis 2 In the baseline study, there is lower trade volume in market repetitions two and three for spacing cohorts than massed cohorts.
Also consistent with the more rapid convergence toward the no trade equilibrium, is the
decreasing opportunities for expected wealth improving trades. Thus, we should expect lower
variance in the terminal portfolio values - earnings - of traders in spacing baseline cohorts.
Hypothesis 3 In the baseline study, the variance of traders’ final portfolio value is lower in market repetitions two and three for spacing cohorts than massed cohorts.
Our final hypothesis concerns the extent to which experience translates to non-identical
cohorts of the same experience to break common knowledge of rationality, increasing the
dividend variance, and greatly increasing the cash/equity ratio in an asset market leads to
price bubbles with twice-experienced subjects. In this study, we execute the same design
with thrice-experienced subjects, a continuous double auction rather than a call auction, and
introduce a treatment for whether experience is garnered in massed or spaced presentations.
Given, the findings in psychology that spaced presentations lead to greater cue formations
and stronger commitment to long run memory, we formulate our last hypothesis.
Hypothesis 4 In the rekindled study, there will be greater pricing efficiency in the spacing cohorts than in the massed cohorts.
4
Data Analysis
4.1
Baseline study
We start with a data visualization of the baseline cohort market price data that informally
exhibits the typical pattern of bubbles with inexperienced subjects that greatly dissipates
by the third repetition. Figure 1 is an array of eighteen data plots: one for each of the
ten baseline massed cohorts, and one for each of the eight baseline spacing cohorts. Each
data plot has three time series, one for each market repetition, of the deviation of the
me-dian period price from the fundamental value. Casually stated, markets with inexperienced
subjects start with initial underpricing which doesn’t change much, eventually becoming
overpricing. In the majority of cases, the price crashes to the fundamental value in the last
period or two. Typically in the second market repetition, we still observe early underpricing,
the overpricing that collapses sooner. This leads to smaller bubbles of a shorter duration.
The third repetition usually reflects even less mispricing.6
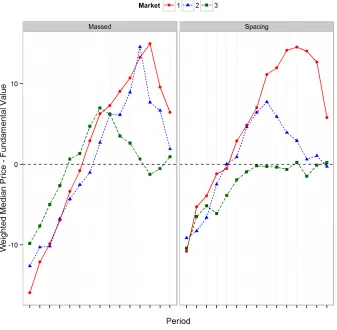
When we aggregate the three time series across cohorts we find similarities and
differ-ences between the impacts of massed and spaced presentations. Figure2shows the
volume-6
Figure 1: Time series of the difference in median period price and fundamental value for all baseline cohorts and market repetitions
weighted average across cohorts of the difference between median price and fundamental
value time series for the baseline massed and spacing treatments. For both treatments,
rep-etition clearly reduces bubbles. In addition, the spaced reprep-etitions exhibit earlier and lower
bubble peaks in the first market 2, and no overpricing in market 3. Somewhat unsettling is
that neither massed nor spaced garnered experience diminishes initial underpricing in early
Figure 2: Time series of the volume weighted average difference in median period price and fundamental value by baseline cohort type
We quantitatively evaluate mispricing, volume, and the variance of portfolio values in
our baseline studies. In developing our empirical strategy, we need to account for serial
dependence likely present within the data of a market and cohort. So we take an
empiri-cally conservative approach and treat the market repetition within a cohort as the unit of
observation. We consider the following four statistics.
1. Relative Median Deviation: This variable measures the deviation of median period prices from the fundamental value for market repetitionr of cohort cfrom period nto
N. It is defined as RM DcrnN =
PN
t=n(Pcrt−Xcrt)Vcrt XcrnNP
N
t=nVcrt , where P
crt is the median price in
period t, Xcrt is the fundamental value of the asset in period t, XcrnN is the average
fundamental value of the asset, and Vcrt is the volume of trade in period t.
median prices from the fundamental value for market repetition r of cohort c from
period n toN. It is defined as RAM DcrN =
PN
t=n|Pt−Xt|Vcrt XcrnN
PN t=nVcrt
.
3. Turnover: This variable measures the trading activity in the market. It is measured asZcr =
P15
t=1Vcrt/S, whereS is the total units of the asset in the market.
4. Standard Deviation of Portfolio Value: This variable measures the variation of subjects’ earnings at the end of market repetition r. It is defined as the standard deviation of
the final market cash holdings of the nine subjects in a cohort possess when period 15
of a market concludes and the final dividend paid.
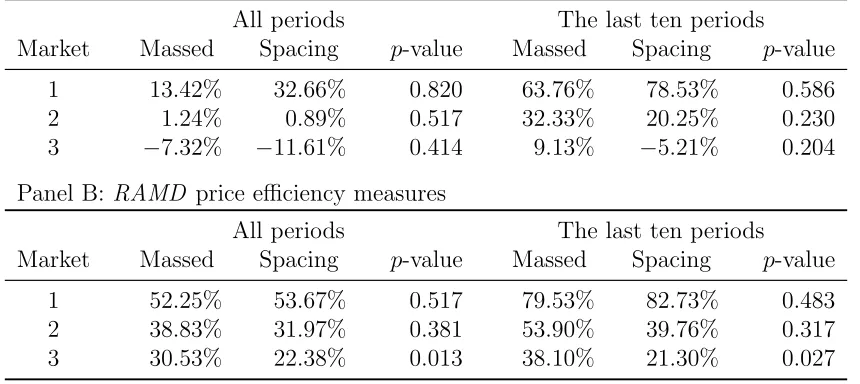
Differences in pricing efficiency are not significant between the massed and spacing cohorts
for markets 1 and 2. Pricing efficiency is greater in market 3 according to theRAM Dcriteria
for the spacing cohorts. We report the average values of RM D and RAM D measures in
Table 2 for the various markets repetitions and cohorts, as well as for all periods and just
the last ten period. The p-value columns report the results of the Wilcoxon rank sum tests
for the null hypothesis that RM D (RAM D) is the same in for massed and spacing cohorts
with the one-sided alternative that it is greater for the massed cohorts. When considering
all fifteen periods, the only significant difference is theRAM D in Market 3. Overall, we find
weak support for Hypothesis 1. There is no significant difference in the pricing efficiency in
market two, and mild support for market 3.
There is no difference in the turnover or standard deviation of final market portfolio
between baseline massed and spacing treatments. Panel A of Table 3 shows the average
Turnover of different markets for the massed and spacing baseline cohorts, as well as the
p-value of the Wilcoxon rank sum tests of differences in cohort averages for each of the three
market repetitions. While turnover is decreasing in market repetitions, the levels at each
repetition are very similar for both cohort types and not statistically different. Panel B of
Table3shows the average standard deviation for different markets for the massed and spacing
baseline cohorts, as well as thep-value of the Wilcoxon rank sum tests of differences in cohort
Table 2: Pricing efficiency in the baseline study: Average RM D, RAM D, and
p-values of the Wilcoxon rank sum tests of equal price efficiency in massed and spacing cohorts
Panel A:RMD price efficiency measures
All periods The last ten periods
Market Massed Spacing p-value Massed Spacing p-value
1 13.42% 32.66% 0.820 63.76% 78.53% 0.586
2 1.24% 0.89% 0.517 32.33% 20.25% 0.230
3 −7.32% −11.61% 0.414 9.13% −5.21% 0.204
Panel B: RAMD price efficiency measures
All periods The last ten periods
Market Massed Spacing p-value Massed Spacing p-value
1 52.25% 53.67% 0.517 79.53% 82.73% 0.483
2 38.83% 31.97% 0.381 53.90% 39.76% 0.317
3 30.53% 22.38% 0.013 38.10% 21.30% 0.027
market earnings as the cohort experiences market repetitions, but no difference whether the
experience is garnered in a massed or spaced manner. We reject both hypotheses 2 and
3; while there is evidence that experience leads volume and portfolio variation toward the
no-trade equilibrium levels, for these variables the rate of convergence doesn’t depend upon
the calendar time of repetitions.
4.2
Rekindle study
Our analysis now turns to the rekindle study and the question of whether experience
gar-nered with spaced repetitions leads to more effective pricing efficiency and effective learning
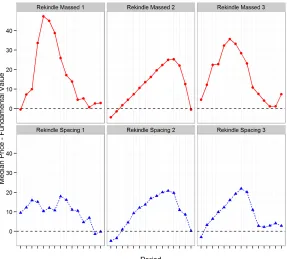
of the no-trade equilibrium. We start by presenting the plots of the time series of difference
in median period price and fundamental value for each of the three rekindled massed and
rekindled spacing cohorts in Figure 3. From this figure, we can see all six cohorts generate
bubbles as in (Hussam et al., 2008). This establishes their ”recipe” for rekindling bubbles
extends to thrice-experienced subjects in continuous double auctions under either massed or
rekin-Table 3: Average turnover and standard deviation of cohort’s final portfolio values with results of Wilcoxon rank sum tests for treatment differences
Panel A: Average turnover
Market Massed Spacing p-value
1 4.81 4.87 0.266
2 3.15 3.15 0.408
3 2.43 2.17 0.240
Panel B: Average standard deviation of cohort’s final portfolio values
Market Massed Spacing p-value
1 112.75 108.56 0.317
2 74.14 65.70 0.517
3 53.89 47.63 0.230
dled massed cohorts than the rekindled spacing cohorts. Figure4 presents volume weighted
averages of these mispricing series for both massed and spacing cohorts. The average bubble
[image:14.612.94.521.215.286.2]is larger and more pronounced for the massed cohorts.
Figure 3: Time series of the difference in median period price and fundamental value for all rekindle cohorts and market repetitions
[image:14.612.163.450.418.677.2]Figure 4: Time series of the volume weighted average difference in median period price and fundamental value by rekindled cohort type
have three independent observations for each cohort type the Wilcoxon rank sum tests are
quite weak. Despite this weakness we find statistical significance in both RM DandRAM D
price efficiency measure. In Panel A of Table 4we show some performance statistics similar
to those in our baseline treatments. Whenever we consider all periods or only the last ten
periods of the market, RM D and RAM D are statistically smaller in the rekindle-spacing
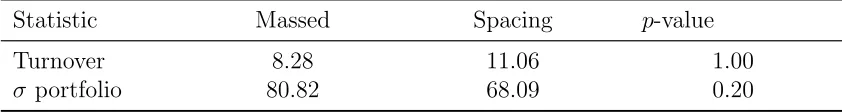
treatment than in the rekindle-massed treatment. At the same time, we don’t see meaningful
differences in turnover or the variance of earnings which are reported in Panel B of Table4.
In summary, we find mild evidence that spacing of market repetitions does lead to more
effective learning in non-identical but similar market environments.
5
Discussion
We examine the relative impacts of experience gained through massed and spaced
repe-titions of an experimental asset market. We learn that spacing reperepe-titions only improves the
Table 4: Performance Statistics and hypothesis tests for the rekindle study
Panel A:RM D and RAM D price efficiency measures
RM D measure RAM D measure
Period Range Massed Spacing p-value Massed Spacing p-value
All periods 72.08% 46.64% 0.1∗ 73.94% 48.49% 0.1∗
Last 10 periods 122.96% 77.51% 0.05∗∗ 123.29% 78.47% 0.05∗∗
Panel B: Averages of turnover and standard deviation of final portfolio values
Statistic Massed Spacing p-value
Turnover 8.28 11.06 1.00
σ portfolio 80.82 68.09 0.20
generate less bubbles when participating in a later market for an asset with greater
liquid-ity, a lack of common knowledge of rationalliquid-ity, and greater dividend variance. We believe
this makes a significant contribution to the methodology of conducting experimental asset
markets. In these studies, the level of experience is often an important, and sometimes the
only, factor leading to improved market efficiency. We show that how the researcher chooses
to cultivate and control that experience matters - and spacing is more desirable.
We also make a smaller contribution to a larger problem: How to regulate new individual
investors to financial markets. With the increasing size and access to financial markets in
large and developing markets like China, there is potential for exploitation of new investors
by unscrupulous financial institution or new investors suffering losses due to poor decisions
borne by their inexperience. An important policy issue is how to best regulate such new
participants. Our results suggest potential benefits to moderating the trading activities of
these new investors by forcing spacing of their decisions rather than simply letting them
“take their lumps”. For example, our results suggest it may be prudent to force first time
home buyers to wait a certain time before they can purchase additional properties. At the
same time we caution that since our results are the first to rigorously control the timing
References
Carpenter, Shana K. and Edward L. DeLosh (2005), “Application of the testing and spacing effects to name learning.”Applied Cognitive Psychology, 19, 619–636.
Chen, Gongmeng, Kenneth A. Kim, John R. Nofsinger, and Oliver M. Rui (2007), “Trading performance, disposition effect, overconfidence, representativeness bias, and experience of emerging market investors.” Journal of Behavioral Decision Making, 20, 425–451.
Dufwenberg, Martin, Tobias Lindqvist, and Evan Moore (2005), “Bubbles and experience: An experiment.”American Economic Review, 1731–1737.
Feng, Lei and Mark S. Seasholes (2005), “Do investor sophistication and trading experience eliminate behavioral biases in financial markets?” Review of Finance, 9, 305–351.
Fischbacher, Urs (2007), “z-tree: Zurich toolbox for ready-made economic experiments.”
Experimental Economics, 10, 171–178.
Fisher, Eric O. and Frank S. Kelly (2000), “Experimental foreign exchange markets.”Pacific Economic Review, 5, 365–387.
Greenwood, Robin and Stefan Nagel (2009), “Inexperienced investors and bubbles.”Journal of Financial Economics, 93, 239–258.
Greiner, Ben (2004), “An online recruitment system for economic experiments.” InForschung und Wissenschaftliches Rechnen(Kurt Kremer and Volker Macho, eds.), volume 63 ofGes. fur Wiss. Datenverarbeitung, 79–93, GWDG Bericht.
Haruvy, Ernan, Yaron Lahav, and Charles N. Noussair (2007), “Traders’ expectations in asset markets: Experimental evidence.”American Economic Review, 97, 1901–1920. Haruvy, Ernan and Charles N. Noussair (2006), “The effect of short selling on bubbles and
crashes in experimental spot asset markets.”The Journal of Finance, 61, 1119–1157. Hussam, Reshmaan N., David Porter, and Vernon L. Smith (2008), “Thar she blows: Can
bubbles be rekindled with experienced subjects?” The American Economic Review, 98, 924–937.
Jacoby, Larry L. (1983), “Remembering the data: Analyzing interactive processes in read-ing.”Journal of Verbal Learning and Verbal Behavior, 22, 485–508.
Janiszewski, Chris, Hayden Noel, and Alan G. Sawyer (2003), “A meta-analysis of the spac-ing effect in verbal learnspac-ing: Implications for research on advertisspac-ing repetition and con-sumer memory.”Journal of Consumer Research, 30, 138–149.
Kandel, Schmuel, Aharon R Ofer, and Oded Sarig (1993), “Learning from trading.” Review of Financial Studies, 6, 507–526.
Korniotis, George M. and Alok Kumar (2011), “Do older investors make better investment decisions?” The Review of Economics and Statistics, 93, 244–265.
Lee, Timothy D and Elizabeth D Genovese (1988), “Distribution of practice in motor skill acquisition: Learning and performance effects reconsidered.” Research Quarterly for Ex-ercise and Sport, 59, 277–287.
Nicolosi, Gina, Liang Peng, and Ning Zhu (2009), “Do individual investors learn from their trading experience?” Journal of Financial Markets, 12, 317–336.
Ofen-Noy, N., Y. Dudai, and A. Karni (2003), “Skill learning in mirror reading: how repe-tition determines acquisition.”Cognitive Brain Research, 17, 507–521.
Palan, Stefan (2013), “A review of bubbles and crashes in experimental asset markets.”
Journal of Economic Surveys, 27, 570–588.
Porter, David P. and Vernon L. Smith (1995), “Futures contracting and dividend uncertainty in experimental asset markets.”Journal of Business, 509–541.
Rundus, Dewey (1971), “Analysis of rehearsal processes in free recall.” Journal of Experi-mental Psychology, 89, 63–77.
Seru, Amit, Tyler Shumway, and Noah Stoffman (2010), “Learning by trading.” Review of Financial Studies, 23, 705–739.
Smith, Steven M. and Ernst Z. Rothkopf (1984), “Contextual enrichment and distribution of practice in the classroom.”Cognition and Instruction, 1, 341–358.
Smith, Vernon L., Gerry L. Suchanek, and Arlington W. Williams (1988), “Bubbles, crashes, and endogenous expectations in experimental spot asset markets.” Econometrica, 1119– 1151.
Xue, Gui, Leilei Mei, Chuansheng Chen, Zhong-Lin Lu, Russell Poldrack, and Qi Dong (2011), “Spaced learning enhances subsequent recognition memory by reducing neural repetition suppression.” Journal of Cognitive Neuroscience, 23, 1624–1633.
Appendix A: Experiment instructions for massed cohort
session - translated from Mandarin
I: General instructions
Today you are participating in an experiment that studies asset markets. Your decisions will determine your earnings. Please read these instructions carefully.
Do not use mobile phones, laptop computers, or use the lab’s desktop computer other than for the experiment. During the experiment, please refrain from talking or looking at the computer monitors of others. If at some point you have a question, please raise your hand and we will address it as soon as possible.
In today’s experiment you will participate in a sequence of 3 separate and independent asset markets. The currency used in the market is called pesos. When a market is closed, your pesos earnings from the market will be converted to RMB at a rate of 1 RMB per 7 pesos. Your final cash payoff will be the sum of all markets’ cash payoffs plus a 10 RMB participation fee.
After the trading in the first market, there will be a 10-minute break. During the break, please refrain from talking or looking at the computer monitors of others. If you want to use the bathroom, please go one by one. At the conclusion of the experiment, please sit quietly. We will call participants up one at a time to the sign-in counter. There you will privately receive your earnings. We will not reveal your earnings to any other subject, or any other subject’s earnings to you. Nor will we provide any information about how your earnings compare to the earnings of others.
II: Asset market participation
Today you will sequentially participate in 3 asset markets. These 3 markets are indepen-dent in the sense your peso earnings in each market are unrelated. Despite this independence, these markets have a similar structure. The trading system, trading rules and assets traded are the same in all 3 asset markets. Also, every market lasts for 15 trading periods, and each period lasts 1 minute and 45 seconds.
We next will answer the following three questions. 1) What is the asset that you will trade in a market? 2) How does the trading system work?
3) How to make trades in a market?
What is the asset we will trade?
In all markets there is a single type of asset you can buy or sell. Before the start of each market, every participant is given several units of the assets and a certain amount of pesos. The amount of pesos you hold at any point in time is called your currency holdings.
2.8 and 6 pesos. Each dividend value has a probability of 1/4 to appear in every period. For example, if you have 3 assets at the end of period 4 and the dividend for that period is 2.8 pesos, then 8.4 pesos (2.8∗3 = 8.4) will be added to your currency holdings at the end of period 4.
During an asset market, each period’s dividend will be revealed at the end of the period. The only information you will receive regarding current and future dividend amounts is the four possible values for dividend. (This information is provided in the upper left of the trading screen.)
You currency balance adjusted for any dividend income - and inventory of assets will carry over in each trading period of an asset market. For example, if you have 4 assets and 80 pesos dollars at the end of period 2, and the dividend of period 2 is 0.8 pesos, then you will have 4 assets and 83.2 pesos (80 + 0.8∗4 = 83.2) at the beginning of period 3. However, the inventory of assets and your currency balance will not carry over in different asset markets, i.e. different sub-experiments.
At the conclusion of the market i.e., after dividend payments of period 15 - the experi-menter will redeem each unit of the asset for 0 pesos. Your total redemption amount, which is always 0, will be added to your final currency holdings to determine your market earnings. For example, if at the conclusion of the 15th period you own 2 assets and 100 pesos, and the dividend of period 15 is 6 pesos, then the experimenter will buy your 2 assets by paying you 0 peso. Thus, in this example, the asset market earnings would be 100 + 0 + 6∗2 or 112 pesos.
To summarize, your earnings will be: + the sum of your dividends;
+ the sum of currency you receive from selling assets; - the sum of currency you used in purchasing assets;
+ the redemption value of any asset units held after the last period of trading, which is 0 for all asset markets.
How does the trading system work?
In the trading system for the asset market, as a trader, you can act as both a seller and a buyer of units of the asset. Once you enter the trading screen, you can trade until the remaining time (showed in the upper right-hand of the screen) turns to zero.
The market view has six areas:
1) In the upper left-hand corner you will find a table showing the four possible values of dividend, and the final asset redemption value.
2) Below the first area is another table which shows the current number of assets you own, the number of assets you have available to sell or offer for sale, the amount of pesos you currently hold, and the amount of currency available you have to purchase or to make bids to purchase units of the asset.
3) The top right-hand side of the screen provides for each trading period you final currency and asset holdings, the dividend value, period dividend income, and final currency holding adjusted for this dividend income. Below this area is a pair of tables showing lists of the units sold and purchased for the current trading period.
Buy’ to purchase a unit at the current lowest ask (offer to sell) price in the market. You can enter an ask price at which you are willing to sell a unit in the ‘Enter Ask’ box, or you can click on the ‘Sell’ button in the ‘Market Sell’ box to sell a unit at the current highest bid in the market.
The ‘List of Bids’ and ‘List of Asks’ provide public information on current market con-ditions (all participants see this information except which Bid/Ask prices belong to specific other participants.) ‘List of Bids’ gives all of the available (waiting to be accepted) Bids in the market and the ‘List of Asks’ gives all of the available Asks in the market. Your outstanding bids and asks will be given in Blue text. Note that you can delete one of your bids or asks by selecting it using your mouse and then clicking on the delete button.
5) On the right hand side of your screen you find two summaries for contract prices for the current period. First, there is a table which gives the last trade price at the top and then sequence of previous trading prices. Below this table, you will find a graph displaying the current trading period asset prices.
6) Finally, the bar at the top of the screen shows the current trading period and the time remaining in the period.
How to make trades?
As suggested there are four types of actions you can take in a trading period; (1) submit a bid price to purchase a unit, (2) submit an ask price to sell a unit, (3) purchase a unit by accepting the lowest outstanding ask, and (4) sell a unit by accepting the highest outstanding bid. You can also do these in any sequence you want. For example, you can simultaneously have an outstanding bid, an outstanding ask, and then purchase at the lowest ask in the market (as long as it isn’t your outstanding ask.) You may also have multiple outstanding bids and/or asks at a given time.
There are some basic rules governing what bids and asks you may submit or accept. 1) When you submit a new bid, it must be larger than the current highest bid and you must have at least the bid amount of currency available. 2) When you submit a new asks, it must be smaller than the current lowest ask and you must have at least one unit of the Asset in inventory (Note, whenever you successfully submit an ask your inventory of available assets is reduced by one.) 3) If you attempt to buy a unit at the current lowest ask, then you must have enough available currency and you can’t purchase from yourself. 4) If you attempt to sell at the current bid, you must have a unit available and you can’t sell to yourself. 5) You may delete any bid or ask you submit as long as it is neither the current highest bid or lowest ask. 6) If you submit a new bid higher than the current lowest ask, the contract price will be the current lowest ask; if you submit a new ask lower than the current highest bid, the contract price will be the current highest bid. For example, if the current lowest ask is 30 pesos while you submit a new bid at 40 pesos, the contract occurs and the price will be 30 pesos.
When a contract occurs, the associated bid or ask is removed to from the List of Bids or Asks. If you are involved in the contract, your currency holdings and asset inventory will be automatically adjusted. Finally, when the trading period ends all bids and asks are removed from the appropriate lists (and the associated asset units and currency are credited back to the participants)
you may choose to ‘buy’ at the current lowest ask. Likewise you may sell an asset in two ways; you may submit an ask price to sell that becomes the current lowest ask and another participant ‘buys’ from you, or you may choose to ‘sell’ at the current highest bid.
Appendix B: Experiment instructions for spacing
co-horts - translated from Madarin
I: General instructions
Today you are participating in an experiment that studies asset markets. Your decisions will determine your earnings. Please read these instructions carefully.
Do not use mobile phones, laptop computers, or use the lab’s desktop computer other than for the experiment. During the experiment, please refrain from talking or looking at the computer monitors of others. If at some point you have a question, please raise your hand and we will address it as soon as possible.
This experiment consists of three same sub-experiments. You are required to participate in ALL of the three experiments which will be conducted at the same time each week, and each time you will read the same instruction.
Each time, you will participate in a separate and independent asset market. The currency used in the market is called pesos. When a market is closed, your pesos earnings from the market will be converted to RMB receivable at a rate of 1 RMB per 7 pesos. Besides, you will earn 10 RMB participation fee receivable each time. Your final cash payoff will be the sum of all of the three experiments’ cash payoffs plus 30 RMB participation fee. You will receive your total earnings only after you have finished ALL of the three experiments. If you cannot participate in any one of them, you will receive nothing.
When one experiment ends, please sit quietly. We will call participants up one at a time to the sign-in counter. At the end of the first two experiments, you will check your earnings in the experiment; at the end of the third experiment, you will privately receive your earnings for all three experiments. We will not reveal your earnings to any other subject, or any other subject’s earnings to you. Nor will we provide any information about how your earnings compare to the earnings of others.
II: Asset market participation
Each time, you will participate in 1 asset markets. In total you will sequentially partici-pate in 3 markets, which are independent in the sense your peso earnings in each market are unrelated. Despite this independence, these markets have a similar structure. The trading system, trading rules and assets traded are the same in all 3 asset markets. Also, every market lasts for 15 trading periods, and each period lasts 1 minute and 45 seconds.
We next will answer the following three questions. 1) What is the asset that you will trade in a market? 2) How does the trading system work?
3) How to make trades in a market? What is the asset we will trade?
The amount of pesos you hold at any point in time is called your currency holdings.
At the end of each trading period, every unit of the asset pays a dividend. A dividend is an amount of pesos paid to the owner of each asset unit. This amount is the same for each asset unit, but the amount may differ across periods. When you receive a dividend, that amount is added to your currency holdings. There are four possible dividend values: 0, 0.8, 2.8 and 6 pesos. Each dividend value has a probability of 1/4 to appear in every period. For example, if you have 3 assets at the end of period 4 and the dividend for that period is 2.8 pesos, then 8.4 pesos (2.8∗3 = 8.4) will be added to your currency holdings at the end of period 4.
During an asset market, each period’s dividend will be revealed at the end of the period. The only information you will receive regarding current and future dividend amounts is the four possible values for dividend. (This information is provided in the upper left of the trading screen.)
You currency balance adjusted for any dividend income - and inventory of assets will carry over in each trading period of an asset market. For example, if you have 4 assets and 80 pesos dollars at the end of period 2, and the dividend of period 2 is 0.8 pesos, then you will have 4 assets and 83.2 pesos (80 + 0.8∗4 = 83.2) at the beginning of period 3. However, the inventory of assets and your currency balance will not carry over in different asset markets, i.e. different sub-experiments.
At the conclusion of the market i.e., after dividend payments of period 15 - the experi-menter will redeem each unit of the asset for 0 pesos. Your total redemption amount, which is always 0, will be added to your final currency holdings to determine your market earnings. For example, if at the conclusion of the 15th period you own 2 assets and 100 pesos, and the dividend of period 15 is 6 pesos, then the experimenter will buy your 2 assets by paying you 0 peso. Thus, in this example, the asset market earnings would be 100 + 0 + 6∗2 or 112 pesos.
To summarize, your earnings will be: + the sum of your dividends;
+ the sum of currency you receive from selling assets; - the sum of currency you used in purchasing assets;
+ the redemption value of any asset units held after the last period of trading, which is 0 for all asset markets.
How does the trading system work?
In the trading system for the asset market, as a trader, you can act as both a seller and a buyer of units of the asset. Once you enter the trading screen, you can trade until the remaining time (showed in the upper right-hand of the screen) turns to zero.
The market view has six areas:
1) In the upper left-hand corner you will find a table showing the four possible values of dividend, and the final asset redemption value.
2) Below the first area is another table which shows the current number of assets you own, the number of assets you have available to sell or offer for sale, the amount of pesos you currently hold, and the amount of currency available you have to purchase or to make bids to purchase units of the asset.
adjusted for this dividend income. Below this area is a pair of tables showing lists of the units sold and purchased for the current trading period.
4) The center area of your screen is where you take market actions and can observe current market conditions. Here you can enter a bid price at which you are willing to purchase a unit in the ‘Enter Bid’ box, then click Bid, or you can click on the ‘Buy’ button in the ‘Market Buy’ to purchase a unit at the current lowest ask (offer to sell) price in the market. You can enter an ask price at which you are willing to sell a unit in the ‘Enter Ask’ box, or you can click on the ‘Sell’ button in the ‘Market Sell’ box to sell a unit at the current highest bid in the market. The ‘List of Bids’ and ‘List of Asks’ provide public information on current market conditions (all participants see this information except which Bid/Ask prices belong to specific other participants.) ‘List of Bids’ gives all of the available (waiting to be accepted) Bids in the market and the ‘List of Asks’ gives all of the available Asks in the market. Your outstanding bids and asks will be given in Blue text. Note that you can delete one of your bids or asks by selecting it using your mouse and then clicking on the delete button.
5) On the right hand side of your screen you find two summaries for contract prices for the current period. First, there is a table which gives the last trade price at the top and then sequence of previous trading prices. Below this table, you will find a graph displaying the current trading period asset prices.
6) Finally, the bar at the top of the screen shows the current trading period and the time remaining in the period.
How to make trades?
As suggested there are four types of actions you can take in a trading period; (1) submit a bid price to purchase a unit, (2) submit an ask price to sell a unit, (3) purchase a unit by accepting the lowest outstanding ask, and (4) sell a unit by accepting the highest outstanding bid. You can also do these in any sequence you want. For example, you can simultaneously have an outstanding bid, an outstanding ask, and then purchase at the lowest ask in the market (as long as it isn’t your outstanding ask.) You may also have multiple outstanding bids and/or asks at a given time.
There are some basic rules governing what bids and asks you may submit or accept. 1) When you submit a new bid, it must be larger than the current highest bid and you must have at least the bid amount of currency available. 2) When you submit a new asks, it must be smaller than the current lowest ask and you must have at least one unit of the Asset in inventory (Note, whenever you successfully submit an ask your inventory of available assets is reduced by one.) 3) If you attempt to buy a unit at the current lowest ask, then you must have enough available currency and you cant purchase from yourself. 4) If you attempt to sell at the current bid, you must have a unit available and you can’t sell to yourself. 5) You may delete any bid or ask you submit as long as it is neither the current highest bid or lowest ask. 6) If you submit a new bid higher than the current lowest ask, the contract price will be the current lowest ask; if you submit a new ask lower than the current highest bid, the contract price will be the current highest bid. For example, if the current lowest ask is 30 pesos while you submit a new bid at 40 pesos, the contract occurs and the price will be 30 pesos.
from the appropriate lists (and the associated asset units and currency are credited back to the participants)