Munich Personal RePEc Archive
Residual exports and domestic demand:
an empirical analysis
Muñoz Sepúlveda, Jesús A.
Universidad Complutense de Madrid and GRIPICO
4 September 2014
Online at
https://mpra.ub.uni-muenchen.de/58328/
Residual exports and domestic demand: an empirical analysis
Jesús A. Muñoz-Sepúlveda
Universidad Complutense de Madrid and GRIPICO
Abstract: This paper analyzes and quantifies the impact of exporter status on domestic sales. It is widely assumed that exporters sell in domestic markets more volume than non-exporters. In addition, non-persistent exporting firms have on average higher volumes of domestic sales in those years in which they are involved in export activities. This paper contributes to this literature by using data from a representative sample of Spanish manufacturing firms (Encuesta Sobre Estrategias Empresariales) over the period 1990-2011. By applying a difference-in-difference approach, results
confirm that exporters have on average larger domestic sales (volumes and growth rates) than non-exporters. Additionally, a fixed and random effects model is also applied to measure the impact of exporter status on domestic sales, considering only exporting firms. Results suggest that exporter status increases domestic sales volumes, although it significantly reduces growth. We will refer to
this deceleration as residual exports. The amount of the effect varies depending on firms’ persistence
in export markets.
Keywords: Residual exports, domestic sales, difference-in-difference, fixed and random effects
JEL code: F10, F14
Corresponding author: Jesús Ángel Muñoz Sepúlveda Department of Applied Economics II Universidad Complutense de Madrid Campus de Somosaguas
28223, Pozuelo de Alarcón (Madrid)
jesusangel.munoz@ccee.ucm.es
Telephone: 91 394 2477
1 1. Introduction
The increase in the number of exporting firms is a remarkable indicator of the
internationalization process in the last decades. As expected, this rise of international trade
flows has promoted competition in domestic and export markets. In this sense, the
relationship between the domestic demand growth and the incentives to enter and stay in
export markets has been a widely discussed topic for a long time. In general, it is assumed
that entry in export markets is affected by two main determinants. On the one hand,
firm-specific behavior/characteristics are specified. In particular, empirical evidence shows that
exporters are bigger, more productive, more intensive in R&D and pay higher wages (Mayer
and Ottaviano, 2008; Rodríguez, 2008). In addition, Martín-Machuca et al. (2009) also
suggest that domestic experience affects positively on probability of export entry. This
approach is based on a self-selection hypothesis, where only “better firms” are able to face the
sunk costs associated to the entry. On the other hand, export entry is also affected by external
factors that include characteristics related to international economic environment, demand
shocks in domestic and export markets, and exchange rates fluctuations. Thus, for example,
changes in the domestic cycle may encourage participation in exporting.
The strategy of considering exports as a way to place “residual” sales has been present in
some specific sectors as the steel industry. In this sense, Blonigen and Wilson (2010) analyze
the U.S. steel industry for the period 1979-2002, concluding that excess capacity (produced
by foreign government subsidies and high protective trade barriers) leads foreign producers to
sell at high price in their domestic markets and dump the excess on the U.S. This strategy has
also happened historically in some agricultural products, where foreign markets were the
solution for domestic production surpluses. The economic crisis starting in 2008 offers a
recent example to revisit this topic (Tiana, 2012; Lee et al., 2009). In general, it is assumed
that economic crisis reduces significantly domestic demand, promoting export activities.
Therefore, it seems clear that access to export markets is often a necessary strategy for
long-term firm’s survival, especially in crisis periods. This assumption is also applied to Spanish firms in the recent crisis, which have made an effort to improve foreign sales, in spite of the
severe decline in 2009, as a mechanism to balance shrinking domestic sales. The result of this
effort was highly satisfying and expansive. In particular, Spanish manufacturing exports (in
nominal terms) increased 8.5% from 2007 to 2012, while exports from Germany, France and
2
The primary goal of this paper is to analyze the impact of exporter status on domestic sales.
More specifically, the main contribution of this paper is to empirically quantify the spillover
effects of being an exporter on both levels (volumes) and growth rates of domestic sales. In
particular, this paper addresses two main questions: (1) what is the variation in domestic sales
between exporter and non-exporter firms; and, (2) for the universe of firms that export in any
specific year, what happens with domestic sales when these firms engage in exporting?
The empirical analysis is carried out using firm-level data on a representative sample of
Spanish manufacturing firms drawn from a Business Strategy Survey (Encuesta Sobre
Estrategias Empresariales; ESEE) over the 1990-2011 period. Firstly, the econometric
analysis applies the difference-in-difference approach. This technique analyzes pre- and
post-treatment results of firms exposed and non-exposed to a post-treatment. In this study, post-treatment is
defined as participation in export activities. Therefore, we compare domestic sales of
exporters before and after exporting (treatment group), with a control group defined by
non-exporters. Additionally, we distinguish among different types of firms according to their
persistence in export activities. As expected, results suggest that exporters have larger
domestic sales (volumes and growth) than firms that never export. Secondly, a fixed and
random effects model is applied to analyze the impact of exporter status on domestic sales.
Results confirm that domestic sales are greater when firms are exporting. However, results
also indicate that growth is reduced as consequence of participation in export activity,
suggesting a substitutability relationship between domestic and export sales. We will refer to
this fall in domestic sales as residual export.
The remainder of the paper is organized as follows. Section 2 reviews the recent literature
related to the relationship between the domestic and export sales. In Section 3, data and some
descriptive results are presented. The econometric analysis and the main results using
different estimation techniques are contained in Section 4. Finally, Section 5 summarizes the
main conclusions of the study.
2. Theoretical framework
The recent literature in International Trade has tried to analyze why exporting occurs, what
3
performance. The answers to the previous questions have changed over the decades, going
from macro-level (comparative advantage, factor endowments or gains from trade) to
micro-level perspectives. The latter approach analyzes firms’ characteristics to obtain the
determinants related with entry and behavior in export markets. However, there are not many
papers that analyze the interrelationship between export and domestic sales.
An exception is Salomon and Shaver (2005), who analyze this interrelationship and its main
determinants for Spanish manufacturing firms between the years 1990 and 1997. That study
has three main conclusions. First, they obtain that export and domestic sales are
simultaneously determined by firms. Second, the authors suggest that this interdependent
relationship depends on the ownership structure of firms. On the one hand, they find that
domestic and export sales are complements for Spanish-owned firms. On the other hand, both
types of sales are substitutive for foreign-owned firms. Finally, that paper analyzes the effects
of different variables on domestic and international sales. For example, as it is expected,
foreign economic growth makes easier exports, while national growth increases domestic
sales. However, the evidence is not clear about the effects of the R&D investment and the
exchange rates fluctuations on both markets.
This line of research is also followed by Liu (2012), who focuses on the dynamics of
domestic and export sales. In particular, the author suggests that exporters face trade-off
between domestic and export sales in the short run in response to external demand shocks.
She develops a dynamic model of firms’ sales dynamics with capacity constraint and
endogenous investment. The results also suggest the substitution between domestic and export
sales. More specifically, she points out that expansion in export market is caused by positive
foreign demand shocks, which generates a rise in output price and investment, and induces
welfare losses for domestic consumers. This result remarks the importance of the fixed capital
adjustment cost (capacity constraint) when firms have to adjust their investment levels due to
external shocks that generate demand shifts (domestic and foreign).
An additional issue to the latter studies is related to the role of marginal costs and capacity
constraint. In that vein, Blum et al. (2013) argue that export is a response to stochastic
demand shocks and the existence of increasing marginal cost. The underlying intuition
indicates that when a firm is affected by a negative domestic demand shock, it is able to use
4
foreign sales (or reduce the number of destinations) and it focuses on national market when
domestic demand is relatively high. Therefore, they emphasize the importance of fixed capital
investment as a mechanism to explain the participation in both markets. The authors develop
a heterogeneous firm model, based in Melitz (2003), where each firm knows its productivity
parameter before entering to export market. This parameter indicates the profitability (or not)
of export activity, due to it determines if firm may face to sunk cost or fixed capital
investment associated to entry. Thus, model distinguishes two kinds of exporters depending
on the level of fixed capital investment: occasional and perennial. On the one hand,
occasional exporters use to be small and slightly efficient firms, and they base their export
decisions according to the state of demand. These firms sell to foreign markets when domestic
demand is relatively low and the fixed capital is “under-utilized”. On the other hand,
perennial exporters use to be large firms with high efficient levels which invest enough capital
to sell in domestic and foreign markets, regardless of demand. As in the previous papers, the
main conclusion of this paper confirms the substitution relationship between domestic and
foreign sales.
Following the same line of analysis, Ahn and McQuoid (2012) analyze this same
interrelationship with Indonesian and Chilean data, focusing on the existence of increasing
marginal costs. They suggest that this assumption is key to analyze the trade-off between
domestic and foreign sales. In this sense, the authors point out that those firms with constant
marginal costs may no reduce their domestic sales in response to positive external shocks
since increasing production has no effect on the level of marginal costs. However, the same
positive foreign shocks, under the assumption of increasing marginal costs, would increase
export sales and would reduce domestic sales because the increase in the production level also
raises the level of marginal costs. Therefore, they suggest that the existence of financial and
physical constraint leads to increasing marginal costs. Their results also indicate a strong
negative correlation between domestic and foreign sales related with financial and physical
capacity constraint. In particular, firms with capacity constraints present a higher substitution
relationship between domestic and export sales than those that are not constrained.
As was previously mentioned, the recent economic crisis has stimulated researches about the
crisis effects on domestic and foreign markets. This issue is addressed, for instance, in Lee et
al. (2009), who analyze export intensity of Korean firms to changes derived from the Asian
5
period, distinguishing two different types of firms according to their adaptation to that
external economic changes and their domestic market position. On the one hand, they denote
those firms with investment in flexible capabilities which may reorient their production to
export market. On the other hand, the authors identify those firms that are locked in with
inflexible resources and tend to fail (exit of the domestic market). The main finding of the
paper indicates that domestic leaders have a greater incentive to increase their export sales,
due to they lost an important part of their domestic sales as a result to the national demand
shrinking. Moreover, they also obtain that this positive relationship between domestic
position and export intensity is stronger in the post-crisis than in the pre-crisis period.
The same analysis is carried out by Tiana (2012), who analyzes the main factors to explain
the behavior of the Spanish manufacturing industries during the crisis period. On the one
hand, he suggests that national demand has reduced due to the impact of the crisis in the
construction industry, which causes direct and indirect spillovers.1 In this sense, he points out
the significant decline of the private consumption and the equipment investment as
consequence of the weakness of the Spanish economy (compared with the other EU
countries). On the other hand, the author also indicates that exports have helped to absorb the
crisis impact on industrial production and domestic demand. The progressive opening of
Spanish firms has reoriented the production to external markets, triggering improvements in
price-competitiveness. In particular, paper shows that Real Effective Exchange Rates
increased 12% during the crisis period from 2007 to 2012, while manufacturing exports, as
stated above, grew up 8.5% in the same period.
An alternative way to use the “residual” effects is by incorporating domestic demand growth
in a classical demand function of exports. Under this approach, Moreno (1997) estimates
export demand functions for a set of Spanish manufacturing firms, including a variable that
approaches the domestic pressure of demand. However, her result suggests that domestic
demand does not have any impact on the evolution of Spanish exports to the EU. This result is
similar to obtained in Buisán and Gordo (1994), who also suggest that domestic pressure of
demand does not influence on Spanish exports.2
1 Direct spillovers are related with all goods required in construction industry. By contrast, indirect spillovers have impact on the rest of goods.
6 3. Data
This study exploits firm-level data coming from the Encuesta Sobre Estrategias
Empresariales (ESEE). This database is an annual survey of Spanish manufacturing firms
sponsored by the Ministry of Industry that has been carried out since 1990. The ESEE uses
firm size and industry sector to two-digits NACE as the main stratification criteria. The
sample period covers the years 1990-2011 and it is used an unbalanced panel from the
available data. The final sample has 5,040 firms.
This database provides information related with firms’ characteristics: domestic and export
sales volumes, number of employees, NACE codes, financial information, or ownership
structure. It also facilitates information about participation in export activities over the period.
In this sense, four different types of firms can be identified according to persistence in
exporting: (i) those firms that never export, (ii) those that always export, (iii) those that leave
export markets and never re-entry, and (iv) those new exporters that enter into export markets
only one (persistent entrants) or multiples times (switchers) throughout the period.3
Additionally, database also provides information about R&D investment and participation in
process and product innovation activities. To avoid the presence of outliers, we exclude the
two tails of the distribution of domestic sales growth defined by the percentiles 1 and 99.
Table 1 shows some descriptive results related with domestic sales and R&D expenditure,
according to firms’ persistence in export markets.
As expected, firms that participate in export activities in any year of the period have more
employees and present greater domestic sales than those that never export. Additionally,
differences between the diverse types of exporting firms are observed. First, always-exporters
are the biggest, the most innovative and those which have the highest domestic sales. Second,
firms that leave export markets have lower number of employees, domestic sales (in median
value) and R&D expenditure than those firms that continue exporting. Moreover, growth rate
of domestic sales for exiting-firms is negative and the lowest. Finally, results between
switchers and persistent entrants are very similar, although the latter usually present more
employees (in median), more domestic sales, more growth rate of domestic sales and more
R&D expenditure than switchers. Therefore, it seems clear that export generates spillovers
7
that affect on firms positively. Particularly, the more persistent is the firm in the export
markets, the larger is the effect.
Table1: Descriptive results of the data according to exporting participation
# Employees Domestic sales (volumes)1
Domestic sales (growth)
R&D
investment # Firms % Mean Median Mean Median Mean Median Mean
Non-exporters 38.07 19 3.32 0.87 1.10% -0.16% 9,061 1,744 34.6 Switchers 195.4 35 18.00 2.53 4.26% 1.31% 782,936 669 13.3
Non-exporting 91.8 24 12.98 1.67 5.53% 1.88% 63,980
Exporting 275.32 55 22.67 4.28 3.14% 0.70% 1,436,504
Persistent entrants 181.3 40 24.38 3.20 5.57% 2.96% 977,137 265 5.3
Before entry 124.9 28 13.92 1.95 7.01% 4.43% 200,644 After entry 207.7 50 29.42 4.12 5.51% 2.59% 1,346,713
Exiting-firms 136.2 26 15.67 1.46 2.25% -1.25% 275,100 167 3.3 Always-exporters 429.6 202 34.08 11.23 3.41% 0.88% 1,363,310 2,195 43.5 Total firms 252.8 48 21.53 3.29 3.16% 0.78 % 832,785 5,040 100
Note: 1 in millions of euros.
Another interesting result is related to the variation of the latter variables for switchers and
persistent entrants when they are involved in export activities. In this sense, Table 1 shows
that both types of firms have more number of employees, greater domestic sales and R&D
expenditures when they are engaged in exporting. It is particularly significant the increase in
the R&D investment as a result of entry in exporting. In this sense, the R&D expenditure is
multiplied, on average, by 22 and 7 for switchers and persistent entrants, respectively.
However, both groups of firms tend to reduce the domestic sales growth when they are
exporting. It may indicate that firms decide to focus and strengthen their foreign position,
leaving aside domestic markets, when they incorporate foreign destinations in their portfolio.
Therefore, it seems clear that exporting generates important increases in domestic sales,
though the growth (measured by the growth rates) is reduced in those years in which firm is
involved in export activities.
A primary goal of this paper is to investigate the variation of domestic sales when firms
decide to participate in export activities. To address this question, Table 2 provides evidence
on the single-difference of domestic sales growth before, during and after the first entry into
the export markets. Thus, we may obtain preliminary results about the existence of a
8
wish to compare variations in domestic sales as a result of entry in exporting, only persistent
entrants and switchers are considered in this analysis. As was previously explained, the
former are defined as those firms that enter into the export markets and continue exporting in
consecutive years from that moment, while the latter collect those firms that enter and exit
from exporting multiples times over the period.4
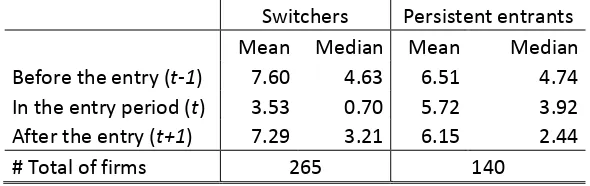
As can be seen in Table 2, switchers and persistent entrants decrease the domestic sales
growth as a result of entry into export markets. In particular, switchers halved the domestic
sales growth compared with the pre-entry period, going from 7.60% to 3.53%. This fall is also
observed in persistent entrants, although the effect is more reduced than switchers. Therefore,
it seems clear that, as expected, entry into export market responds to a substitution between
domestic and foreign sales. Firms that decide enter in foreign markets focus on these sales,
[image:10.595.150.445.383.476.2]reducing or neglecting domestic market.5
Table 2: Average growth rate for domestic sales in real terms (%)
Switchers Persistent entrants Mean Median Mean Median Before the entry (t-1) 7.60 4.63 6.51 4.74
In the entry period (t) 3.53 0.70 5.72 3.92
After the entry (t+1) 7.29 3.21 6.15 2.44 # Total of firms 265 140
Results for both types of firms are similar when post-entry period is analyzed. On the one
hand, switchers increased their domestic sales growth rates after entry, suggesting that
exporting is a transient situation. Therefore, switchers may use foreign markets as a
mechanism to sell the surpluses and recover, after entry, the normal growth of domestic sales.
On the other hand, persistent entrants also increased their national sales growth rates in
post-entry period, although we observed an important fall in median value. It may suggest that
once they decide enter in exporting they prefer strengthen their position in the foreign markets
rather than focus on national markets.6 Additionally, these growths (before, during and after
4 Related to the results of Table 2, we have to remark that we only consider those firms with non-missing values in domestic sales before and after entry in exporting.
5 Results remain unchanged when the whole set of sample firms is considered.
9
entry) are manifestly higher than those obtained by non-exporters and always-exporters. In
particular, average growth rate of domestic sales for firms that never export is 1.10%, while
rate for those firms that export throughout the period is 3.16%. It may suggest that exporting
also promotes sales in domestic markets.
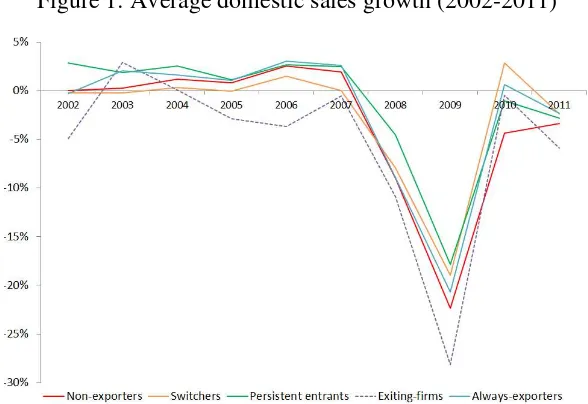
Related to the effect of the economic crisis (started in 2008) on the national demand, Figure 1
shows the evolution of the average growth rates of domestic sales for the different types of
firms according to exporting persistence in the period 2002-2011. As can be seen, firms
presented positive growth rates in the previous years of the beginning of the crisis (with the
exception of the exiting-firms). In general, always-exporter and persistent entrants have
[image:11.595.149.443.326.528.2]greater domestic sales than the other types of firms.
Figure 1: Average domestic sales growth (2002-2011)
The main change in the trend begins in 2008, with the significant drop in the national demand
(the growth rates for all types of firms are clearly negative). This important shrinking
continues and accentuates in 2009, even to negative rates of over 20%.7 This decline is in
consonance with the observed in world trade flows. According to exporting participation,
Figure 1 also shows that non-exporters and exiting-firms were the firms with greater
reduction in their domestic sales. Therefore, it seems clear that firms involved in export
activities suffer lower shrinking in their national sales than those not involved or those leaving
10
the export. In the subsequent years, growth rates have slightly improved to reach positive
rates in the last year of the period.
4. Econometric approach
Results of the previous section may suggest the existence of export spillovers on domestic
sales. Thus, for instance, the decrease in domestic sales growth is observed as a result of the
first entry in exporting. However, we are now interested in analyzing the effect of being an
exporter on domestic sales over the entire sample period. Accordingly, this section sets up the
econometric strategy to analyze (i) differences in domestic sales between different groups of
firms according to persistence in export markets (i.e., exporters and non-exporters) and (ii)
variations in domestic sales as a result of entry in exporting, considering only exporters.
To tackle these issues, we use three different approaches. First, the difference-in-difference
methodology is applied to compare domestic sales for two different groups of firms (control
and treatment group), which are defined according to involvement in exporting. Second, a
fixed effects model is estimated to capture the impact of exporter status on domestic sales,
considering only non-persistent exporting firms. By using this methodology, we are able to
estimate the variation in domestic sales associated with participation in export activities by
controlling unobservable heterogeneity. In particular this methodology supposes that
firm-effects are constant over time and independent for each firm. Finally, to also estimate the
impact on domestic sales as a result of exporting, a random effects model is applied. The
underlying idea of this methodology is based in the assumption that firm-effects are a random
variable.
4.1 Difference-in-difference approach
As mentioned above, this study firstly applies the difference-in-difference methodology. This
technique has become very widespread in the last few decades since the work of Ashenfelter
and Card (1985). The underlying idea of this methodology compares pre- and post-treatment
result for two groups of individuals and for two time periods and it is based on a simple idea:
one of the groups is exposed to the treatment in the second time period, but not in the first;
while the second group is not exposed to the treatment in either period. To remove biases in
11
(control) is subtracted from the average gain in the first group (treatment). For instance, paper
of Ashenfelter and Card (1995) analyzes the effect of training programs on unemployment
earnings and low-income workers. Using this methodology, they can measure, evaluate and
quantify the effectiveness of these programs on wages.8
The next step is to apply the difference-in-difference approach in our study. As was
previously mentioned, we want to analyze the effect of exporter status on domestic sales.
First, we must identify treatment and control group. In this sense, treatment is referred to the
participation in export activities. It indicates that a firm “suffers” the treatment when it sells in
foreign markets in period 2, but not in period 1. By contrast, control group includes all firms
that do not export along the two periods. Using this methodology, we may compare and
measure the change in domestic sales (levels and growth) for the treatment group (exporters)
and the control group (non-exporters) under the assumption that difference is due to
exporting. This latter expression can be written as follows:
DID[(Domt1|X 1)(Domt |X 1)][(Domt1|X 0)(Domt |X 0)] (1)
where Dom indicates domestic sales before and after the exporting (t and t+1, respectively),
and X is a dummy variable which captures the effect of participation in export activities for
the two groups of firms. In particular, this variable takes value one in those years in which
firms are involved in export activities, and zero otherwise.
The basic formulation of this methodology is one with pre- and post-treatment observations
(export or not export) on a group, where the domestic sales by firm are the outcome variable.
Domit TtXiTt Xiit, t1,2 (2)
In the latter expression, i indexes the two different groups of firms (i=1 for treatment group,
exporters, and i=0 for control groups, non-exporters), Tt is a dummy variable which takes
value zero in the pre-treatment period (t=1) and one after the treatment (t=2), and Xi is
12
another dummy that is equal to one in those periods in which firm exports and zero otherwise.
The variation in domestic sales, before and after the treatment, for those exporting firms is:
E(Domi2|Xi 1)E(Domi1|Xi 1)()() (3)
Similarly, the change for non-exporting firms is:
E(Dom i2|Xi 0)E(Domi1|Xi 0)() (4)
Therefore, the difference in difference is obtained by subtracting expressions (3) and (4).
Specifically,
[E(Domi2|Xi 1)E(Domi1|Xi1)][E(Domi2 |Xi 0)E(Domi1|Xi 0)] (5)
The methodology described above requires a restriction of the initial sample. On the one
hand, always-exporters are not considered in this analysis. These firms are being “treated” in
the first year of the sample period and continue being “treated” over the entire period.
Therefore, they cannot be exposed again to the treatment. On the other hand, those firms that
leave export markets (exiting-firms) are also excluded. These firms are suffering the treatment
and they leave it, not being exposed to the treatment in any subsequent period (those firms
that re-undergo the treatment again are included in switchers). Under these assumptions, the
total number of firms is reduced to 2,678. Moreover, we also include in our analysis other
independent variables to measure the difference-in-difference effect. In particular, we also
consider the two dummy variables related with R&D participation and ownership structure.
Table 3 summarizes estimated export effects considering switchers and persistent entrants as
treatment group and non-exporters as control group. These estimates are based on equation
(5). As expected, exporters have on average higher volumes of domestic sales than
non-exporters. In particular, the export impact on domestic sales for exporters is, on average, 9.60
million euros greater than non-exporters. Therefore, it seems clear that exporting firms have
higher domestic sales than those firms that never participate in export activities. With respect
13
1.2 percentage points (pp hereafter) greater when firms are exporters. Results remain
[image:15.595.113.484.153.277.2]unchanged when fixed time effects are included, though impact magnitude is smaller.
Table 3: Summary of estimated exporting effects applying the diff-in-diff methodology
Domestic sales (2011 million euros)
Domestic sales growth (%)
Exporting effect 9.60*** (0.93) 8.92*** (1.16) 0.012*** (0.003) 0.010** (0.004)
Time effects No Yes No Yes
No. of firms 2,678 2,678 2,678 2,678
No. of observations 21,527 21,527 19,167 19,167
Note: Standard errors in parenthesis. ***, ** and * indicate significant at 1%, 5% and 10%, respectively.
A final check of this impact is presented in Table 4, which show the same analysis of previous
table but distinguishing export effects between persistent entrants and switchers. As before,
the effect of participating in export activities for persistent entrants or switchers is compared
[image:15.595.69.531.453.581.2]with those firms that never export.
Table 4: Summary of estimated exporting effects for switchers and persistent entrants
Domestic sales (2011 million euros) Domestic sales growth (%) Persistent entrants Switchers Persistent entrants Switchers
Exporting effect 25.27*** (2.12) 25.98*** (1.98) 20.48*** (2.26) 20.07*** (1.76) 0.035*** (0.005) 0.028*** (0.005) 0.008 (0.008) 0.005* (0.003)
Time effects No Yes No Yes No Yes No Yes
No. firms 2,009 2,009 2,413 2,413 2,009 2,009 2,413 2,413
No. observations 13,572 13,572 18,455 18,455 11,500 11,500 16,188 16,188
Note: Standard errors in parenthesis. ***, ** and * indicate significant at 1%, 5% and 10%, respectively.
As expected, participation in persistent or non-persistent export activities significantly
increases domestic sales. On the one hand, persistent entrants have on average 25.27 million
euros of domestic sales higher than non-exporters. If the analysis is carried out in growth
rates, results suggest that participation in export activities increases domestic sales growth for
the persistent entrants 3.5 pp more than non-exporters. On the other hand, switchers also sell
more in domestic markets compared with non-exporters. In particular, the domestic sales
14
increase is slightly lower for switchers than for persistent entrants. It may suggest that entry
and exit dynamics experienced by switchers reduce the effect of being an exporter on
domestic sales. Therefore, it seems clear that exporting generates spillovers that stimulate
domestic sales, confirming and quantifying the results of other researches. Finally, results also
suggest that switchers do not vary the percentage change of their domestic sales as
consequence of exporting (compared with non-exporters).
4.2 Fixed and random effects
As was previously mentioned, we also want to analyze the effect of exporter status on
domestic sales (levels and growth) in those years in which firms are involved in export
activities. To tackle this goal, a fixed and random effects model is used in this section. Since
we want to analyze the effect of exporter status, only those firms that enter into export
markets one or multiple times over the sample period are considered. In other words, only
persistent entrants and switchers are taken into account in this section.
The empirical specification of the effects of domestic sales (levels) is therefore mainly
explained by the following equation:
Domit 0 1DXit2DR&Dit 3OSit4ditHit, (6)
where DXitand DR&Ditare two dummy variables related to the participation in export and
R&D activities, respectively, OSitis another dummy related with the ownership structure and
H it
d is an individual indicator of the business cycle in domestic market. Accordingly, the two
first variables take value one in those years in which firms export or invest in R&D activities,
respectively. Moreover, the variable related with the ownership structure (OSit) takes value
one when firms are mainly controlled by foreign capital and zero when firms are owned by
Spanish capital. Finally, H it
d is an indicator specified by each firm which identifies the
15
according to three different categories: recession, stability and expansion (value 1, 2, and 3,
respectively).9
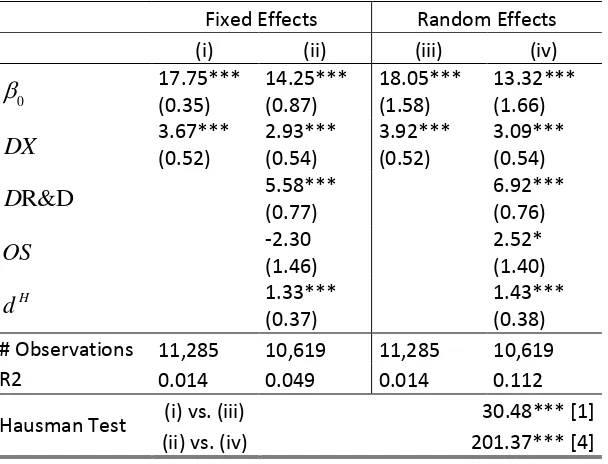
Table 5 shows the results of the fixed and random effects models on domestic sales,
considering both persistent entrant and switchers. As can be observed, participation in export
activities increases domestic sales. This result is obtained by using both fixed and random
effects models. Firstly, the fixed effects model predicts that exporter status increases domestic
sales, on average, in 3.67 million euros. It suggests that export participation may generate
spillovers that exceed the effect on foreign sales, also impacting on domestic market. In
addition, this result remains unchanged when the other variables are included in the analysis.
In particular, exporter status increases domestic sales by 2.93 million euros on average.
Column (ii) also suggests that innovative firms have higher domestic sales than
non-innovative firms. With respect to the ownership structure, results suggest that this variable
does not affect on the domestic sales. Finally, the business cycle indicator also has a positive
and significant impact on domestic sales, indicating that domestic sales present a procyclical
behavior. Therefore, an increase in the market dynamism indicator (demand proxy variable)
generates positive domestic sales variations.
Secondly, random effects model also predicts increments in domestic sales as a result of
exporter status. In particular, national sales are increased due to export spillovers in 3.92
million euros when random effects are considered. Moreover, this effect is equal to 3.09
million euros when other variables are included in the regression. Again, as expected,
participation in R&D activities and business cycle indicator have a positive and significant
impact on domestic sales levels. By contrast with the fixed effects model, the parameter
related to ownership structure is positive and statistically significant at the 10% level,
suggesting that firms controlled by foreign capital have higher domestic sales than those firms
managed by national capitals. Finally, to test the adequacy of both models a Hausman test is
implemented. As can be observed, this result suggests that fixed effects model is a more
adequate specification.
16
Table 5: Fixed and random effects models on domestic sales (2011 million euros)
Fixed Effects Random Effects (i) (ii) (iii) (iv)
0 17.75*** (0.35) 14.25*** (0.87) 18.05*** (1.58) 13.32*** (1.66)
DX 3.67*** (0.52) 2.93*** (0.54) 3.92*** (0.52) 3.09*** (0.54)
DR&D 5.58*** (0.77) 6.92*** (0.76)
OS -2.30 (1.46) 2.52* (1.40)
H
d 1.33***
(0.37)
1.43*** (0.38) # Observations 11,285 10,619 11,285 10,619 R2 0.014 0.049 0.014 0.112
Hausman Test (i) vs. (iii) 30.48*** [1] (ii) vs. (iv) 201.37*** [4]
Note: ***, ** and * indicate significant at 1%, 5% and 10%, respectively. Standard errors in parentheses, and
degrees of freedom between square brackets.
The latter results, related to premia on domestic sales, are the expected when both persistent
entrants and switchers are considered. However, we also want to analyze how vary these
effects when both groups of firms are analyzed separately. The results of these regressions are
presented in the Table 6. As can be observed, the impacts for persistent entrants are similar to
previous results when both groups of firms are jointly considered. On the one hand, the
Hausman test suggests that fixed effects model is more consistent than random effects model.
On the other hand, results also indicate that persistent entrants have on average higher
domestic sales when they are engaged in export and R&D activities. Additionally, Table 6
also suggests that foreign-capital persistent entrants have greater domestic sales.
However, results change substantially when only switchers are considered. Although the
Hausman test result also indicates that fixed effects is a better specification than random
effects, Table 6 shows that exporter status does not affect on domestic sales. It may suggest
that entry and exit dynamics into export markets are the main determinants to explain
exporting behavior of this group of firms. In other words, switchers do not vary their domestic
sales, regardless of exporter status, and they use exporting as a mechanism to sell possible
domestic surpluses. Therefore, it seems clear that export persistence and duration of these
17
R&D participation, as expected, results also suggest that innovative switchers have greater
domestic sales than non-innovative. Finally, the effect of ownership structure is clearly
different for these non-persistent firms. In particular, foreign-capital switchers have lower
[image:19.595.147.452.194.426.2]domestic sales than those switchers in national hands.
Table 6: Fixed and random effects on domestic sales for persistent entrants and switchers
Persistent entrants Switchers
FE RE FE RE
0 11.53***
(2.04) 9.57*** (3.59) 14.24*** (0.93) 13.85*** (1.84)
DX 10.37*** (1.21) 10.45*** (1.21) 0.38 (0.59) 0.54 (0.59)
R&D
D 4.46*** (1.62) 6.11*** (1.60) 5.73*** (0.85) 6.93*** (0.84)
OS 7.30* (3.77) 12.80*** (3.48) -4.38*** (1.52) -0.05 (1.47) H d 1.52* (0.82) 1.68** (0.82) 1.33*** (0.41) 1.40*** (0.41) # Observations 3,009 3,009 7,610 7,610 R2 0.102 0.126 0.012 0.078
Hausman Test (i) vs. (ii) 51.81*** [4] (iii) vs. (iv) 161.95*** [4]
Note: ***, ** and * indicate significant at 1%, 5% and 10%, respectively. Standard errors in parentheses, and
degrees of freedom between square brackets. All figures are in 2011 million euros.
Once the impact of exporter status on domestic sales levels has been analyzed, we also want
to estimate how vary the domestic sales growth when firms are involved in export activities.
As was suggested in descriptive results, firms reduce the growth in the export entry period.
However, we also want to analyze if this trend remains over the whole export period. In
particular, the equation to be estimated is:
Domit 01DXit2DR&Dit 3OSit4ditHit, (7)
where domitis the annual growth rate of domestic sales; DXit, DR&Dit and DOSit are
dummy variables previously defined and related with export participation, R&D investment
and ownership structure, respectively; and ditHis demand variation in domestic markets
18
results on domestic sales growth for the whole set of persistent entrants and switchers when
[image:20.595.140.457.154.383.2]the fixed and random effects models are considered.
Table 7: Fixed and random effects models on domestic sales growth
Fixed Effects Random Effects (i) (ii) (iii) (iv)
0 0.068*** (0.005) 0.066*** (0.007) 0.062*** (0.005) 0.053*** (0.006)
DX -0.037*** (0.007) -0.030*** (0.008) -0.027*** (0.006) -0.023*** (0.007)
R&D
D -0.011 (0.011) 0.010 (0.008)
OS 0.006 (0.021) 0.027 (0.010)
dH 0.060***
(0.005)
0.061*** (0.005) # Observations 10,170 9,539 10,170 9,539 R2 0.001 0.018 0.001 0.021
Hausman Test (i) vs. (iii) 6.60** [1] (ii) vs. (iv) 13.24** [4]
Note: ***, ** and * indicate significant at 1%, 5% and 10%, respectively. Standard errors in parentheses, and
degrees of freedom between square brackets.
As can be observed, the Hausman test indicates that the fixed effects model is more consistent
than the random effects specification. Furthermore, results also suggest that firms reduce
domestic sales growth in those periods in which they are engaged in export activities.
Specifically, the average reduction in domestic sales growth is equal to 3.7 pp. The slowing
down in the growth rates is consistent with the descriptive results obtained when only pre-
and post-entry periods are considered. These results may suggest that firms focus on foreign
markets when they engage in exporting, leaving aside domestic market.10 We will refer to this
fall in domestic sales growth as residual exports.
The inclusion of the other variables in the analysis does not change the impact of the residual
exports. However, the two dummies related to participation in R&D activities and ownership
structure are non-significant, indicating that these variables do not affect domestic sales
growth. Finally, with respect to domestic market dynamism, the results indicate that, as
expected, domestic sales growth presents a procyclical behavior.
19
Finally, Table 8 shows the results about variations in domestic sales growth in distinguishing
between persistent entrants and switchers. As can be observed, results are similar when only
persistent firms are considered. On the one hand, the Hausman test result indicates that the
fixed effects model is more appropriate than the random effects model. On the other hand, the
effect of residual export on domestic sales growth is also negative and significant, which
confirms the reduction in growth in those years in which firm exports. This result is also
suggested for switchers, which also slow down the domestic sales growth when they are
engaged in exporting (although to a lesser extent). However, for switchers, the Hausman test
result rejects the fixed effects model, indicating that the random-effects estimators are more
[image:21.595.140.459.341.570.2]consistent.
Table 8: Fixed and random effects on domestic sales growth for persistent and switchers
Persistent entrants Switchers
FE RE FE RE
0 0.097***
(0.015)
0.061*** (0.011)
0.056*** (0.007)
0.050*** (0.007)
DX -0.042*** (0.016) -0.023* (0.012) -0.026*** (0.009) -0.026*** (0.008)
R&D
D -0.026
(0.019)
0.028** (0.011)
-0.004 (0.013)
0.006 (0.010)
OS -0.004 (0.046) 0.031** (0.015) 0.009 (0.023) 0.024* (0.013)
dH 0.050*** (0.009) 0.053*** (0.009) 0.063*** (0.006) 0.064*** (0.005)
# Observations 2,730 2,730 6,809 6,809 R2 0.007 0.019 0.022 0.023
Hausman Test (i) vs. (ii) 20.42*** [4] (iii) vs. (iv) 2.78 [4]
Note: ***, ** and * indicate significant at 1%, 5% and 10%, respectively. Standard errors in parentheses, and
degrees of freedom between square brackets.
The results of this section indicate that firms have higher domestic sales levels in those years
in which they are involved in export activities. However, the growth rates of these sales are
reduced as a result of exporting. In other words, export spillovers tend to induce a slowdown
in the domestic sales growth. As was previously mentioned, we define this growth reduction
20
domestic sales. Additionally, the latter results may also suggest the substitutability relation
between national and foreign sales.
5. Conclusions
Participation in export activities generates spillovers that lead firms to be bigger, more
productive, more innovative, more technology intensive and pay higher wages than those
firms that do not export. In addition, empirical evidence also assumes an increase in domestic
sales because of the engagement in exporting. In this paper we evaluate and quantify the
impact of exporter status on domestic sales by using different methodologies.
Firstly, the difference-in-difference methodology is applied to compare domestic sales pre-
and post-export entry between two different groups of firms, which are defined according to
participation in export activities. The results point out that exporters have, on average, higher
domestic sales (levels and growth) than non-exporters. In addition, the results also indicate
that this effect varies substantially depending on firm’s persistence in foreign markets. In
particular, this impact is greater for persistent entrants than for switchers. It may suggest that
entry and exit dynamics from exporting could reduce the spillover effects on domestic market.
Secondly, by applying a fixed and random effects model, we evaluate the effect of exporter
status on domestic sales considering only exporting firms. As expected, results point out that
firms have higher domestic sales levels in those years in which they are engaged in exporting.
Again, this result differs depending on firm’s persistence in export markets. Specifically,
persistent entrants increase their domestic sales due to participation in export activities, whilst
switchers do not vary their domestic sales levels. Additionally, results also suggest that firms
significantly reduce domestic sales growth in those periods in which they are involved in
export activities. As before, the extent of this reduction depends on export persistence. This
growth reduction is defined as residual export and it may suggest the substitutability
relationship between domestic and export sales.
The latter results suggest that export promotion policies focused on persistent entries would
have benefits that go beyond of the fact of starting exporting, insofar it also would
significantly increase national sales, although at lower growth rates than those of the pre-entry
21 References
Ahn, J. and McQuoid, A.F. (2012): “Capacity Constrained Exporters: Micro Evidence and
Macro Implications”, mimeo.
Ashenfelter, O. and Card, D. (1985): “Using the Longitudinal Structure of Earnings to Estimate the Effect of Training Programs”, Review of Economics and Statistics, 67, p. 648-660.
Blonigen, B.A. and Wilson, W.W. (2010): “Foreign subsidization and excess capacity”,
Journal of International Economics, 80, p. 200-211.
Blum, B.S., Claro, S. and Horstmann, I.J. (2013): “Occasional and perennial exporters”,
Journal of International Economics, 90, p. 64-75.
Buisán, A. and Gordo, E. (1994): “Funciones de importación y exportación de la economía
española”, Investigaciones Económicas, Vol. XVIII (1), p. 165-192.
Fernández, I. and Sebastián, M. (1989): “El sector exterior y la incorporación de España en la
CEE: Análisis a partir de funciones de exportaciones e importaciones”, Moneda y Crédito, 189, p. 31-74.
Lee, S., Beamish, P.W., Lee, H. and Park, J. (2009): “Strategic choice during economic crisis: Domestic market position, organizational capabilities and export flexibility”, Journal of World Business, 44, p. 1-15.
Liu, Y. (2012): “Capital Adjustment Costs: Implications for Domestic and Export Sales Dynamics”, mimeo.
Martín-Machuca. C., Rodríguez-Caloca, A. and Tello-Casas, P. (2009): “Determinantes principales de la decisión de exportar de las empresas españolas”, Boletín económico del Banco de España, diciembre.
Mayer T. and Ottaviano G.I.P. (2008): “The Happy Few: New Facts on the Internationalization of European Firms”, Intereconomics: Review of European Economic Policy, 43(3), p.135-148.
Melitz, M.J. (2003): “The impact of trade on intra-industry reallocations and aggregate
industry productivity”, Econometrica 71, p. 1695-1725.
Moreno, L. (1997): “The determinants of Spanish industrial exports to the European Union”,
Applied Economics, 29, p. 723-732.
Rodríguez, D. (2008): “Heterogeneidad y competitividad exterior de las empresas industriales”, Papeles de Economía Española, 116, p. 140-151.
Salomon, R. and Shaver, M. (2005): “Export and domestic sales: Their interrrelationships and
determinants”, Strategic Management Journal, 26, p. 855-871.
Tiana, M. (2012): “El impacto de la crisis económica sobre la industria española”, Boletín económico del Banco de España, noviembre.