Munich Personal RePEc Archive
Evaluating the Social Orientation of
India’s Integrated Child Development
Services (Anganwadi) Program
Borooah, Vani and Diwakar, Dilip and Sabharwal, Nidhi
University of Ulster, Indian Institute of Dalit Studies, National
University of Educational Planning and Administration
2012
Online at
https://mpra.ub.uni-muenchen.de/75670/
Evaluating the Social Orientation of India’s Integrated Child Development
Services (Anganwadi) Program
+Vani K. Borooah
*Dilip Diwakar
**Nidhi Sadana Sabharwal
***September 2012
Revised October 2013
Abstract
Launched in October 1975, India’s Integrated Child Development Services (ICDS) program is its largest national program for promoting the health and development of mothers and their children. In this paper we examine an aspect of the ICDS program that has been neglected, namely who are its beneficiaries? Are they persons from deprived groups who, but for the program, might not have received such services? Or are they persons from more privileged groups who have the resources to acquire them from other sources? In both cases the ICDS program adds value but, in the latter situation, it does so by displacing existing services. This particular evaluation of the ICDS program is particularly important in the light of the Government of India’s view, as articulated in its Eleventh Five Year Plan, that growth is not perceived as “sufficiently inclusive for many groups, especially Scheduled Castes, Scheduled Tribes, and Minorities”. The paper presents econometric estimates regarding the relative strength of the personal and household circumstances of persons in determining the likelihood of utilising ICDS services. These estimates suggest that inter-group differences in utilisation rates has less to do with characteristics and much more to do with group identity. Lastly, the paper suggests a trade-off between quality and utilisation by hypothesising that the poor quality of services leads upper caste mothers to exit the ICDS market and seek these services elsewhere.
JEL: I14, I38
Keywords: Child Development, Inequality of Access, Service Quality, Exit and Voice
+
The data used in this paper are from the Indian Human Development Survey 2005, available from the Inter-University Consortium for Political and Social Research (ICPSR), http://www.icpsr.umich.edu . We are grateful to an anonymous referee for comments on this paper though, needless to say, we are entirely responsible for its shortcomings.
*
School of Economics, University of Ulster, Co. Antrim, Northern Ireland BT37 0QB, United Kingdom ([email protected]).
**
Indian Institute of Dalit Studies, D-II/1, Road No-4, Andrews Ganj, New Delhi-110049, India (email: [email protected])
***
2 1. Introduction
Launched in October 1975, India’s Integrated Child Development Services (ICDS) program is its largest national program – and one of the largest such programs in the world - for promoting the health and development of mothers and their children. The scheme is targeted at children below the age of 6 years and their mothers (particularly if they are pregnant and lactating) and the benefits take the form of inter alia supplementary nutrition, immunisation, regular health checks, referral services, education on nutrition and health, and pre-school learning. In addition, mothers and children are provided with iron, folic acid, vitamin A tablets to combat, respectively, iron deficiency, anaemia, and xerophthalmia. The scheme – which is based on the principle that the overall impact of these benefits would be greater if they were provided in an integrated manner, rather than on a piecemeal basis - is administered from a centre, called the Anganwadi (meaning village courtyard) Centre - hereafter, AWC - by workers, and their helpers, trained and paid an honorarium under the scheme (Kapil and Pradhan, 1999; Ministry of Women and Child Development, Government of India http://wcd.nic.in/icds.htm).1
Many aspects of the ICDS have been examined by researchers and, in particular, the delivery of specific services (Ghosh, 2006 on feeding practices; Tandon and Gandhi, 1992 on immunisation) and the delivery of ICDS services in specific parts of the country
(Sundararaman, 2006 on Chhattisgarh; Nayak and Saxena (2006) on Bihar and Jharkhand; Rajivan, 2006 on Tamil Nadu). However, one aspect of the delivery of ICDS services that has been neglected in the literature is the issue of who are the beneficiaries? Are they mothers (and their children) from deprived groups who, but for the AWCs, might not have received such services and, indeed, might not have been aware of the importance of such services? Or, are they mothers (and children) from more privileged groups who, even in the absence of AWCs, would recognise the importance of such services and have the resources to acquire them from other sources. In both cases, AWCs would add value to the lives of
mothers and children but, in the latter situation, they would do so by displacing existing services.
The evidence on social exclusion in relation to the ICDS program is at best mixed and has been summarised by Gill (2012). Three studies of “exclusionary bias” in the delivery of ICDS services (FOCUS, 2006; Mander and Kumaram, 2006; and Thorat and Sadana, 2009) conclude that locational factors underpinned, and perpetuated, such bias. First, there was a relative lack of AWCs in Scheduled Caste (SC), Scheduled Tribe (ST), and Muslim
habitations; second, even in mixed-caste villages, the village AWC was usually not located in the parts in which the deprived groups lived.2 Although the location of AWCs is an
ostensibly neutral factor, Mander and Kumaram (2006) in a study of 14 villages across four states (Andhra Pradesh, Chhattisgarh, Jharkhand, and Uttar Pradesh) argued that “it is not a mere accident that in none of the surveyed mixed-caste villages was the AWC located in the
1
These amounted to Rs. 100 and Rs. 150 per month for non-matriculate and matriculate workers and Rs. 35 per month for helpers.
2
3
Dalit or Adivasi hamlet. The decision to locate not just the AWC, but also other valued institutions and services, in the upper caste so-called ‘main’ village is influenced by the upper caste and class [sic] and politically powerful groups in the village.”
However, as FOCUS (2009) showed, ST children in certain sampled districts comprised 27% of the total number of children in these districts but as much as 40% of the total number of children enrolled in the districts’ AWCs. So, even though locational factors might militate against inclusivity, the utilisation of ICDS services, as measured by enrolment in AWCs, would suggest that while better location could improve inclusivity, inclusivity itself is not a problem per se. On the other hand, Mander and Kumaram (2006) claimed that, in addition to the locational factor (discussed earlier), “a large number of eligible children from impoverished and food deprived households did not access ICDS services, including supplementary nutrition for infant and small children….and that the denial of these services is not random or accidental but is frequently the outcome of active social discrimination, based on caste, gender and disability.”
Following from this mixed bag of results, some based on data from specific parts of India, the purpose of this paper is to use all-India data to evaluate the ICDS programme from the perspective of inclusivity by firstly, econometric estimates regarding the relative strength of the personal and household circumstances of persons in determining the likelihood of utilising ICDS services; secondly, estimating the proportion of inter-group differences in utilisation rates that is the result of inter-group differences in personal and household characteristics and the residual proportion which is the result of caste/religious identity; thirdly, suggesting a trade-off between quality and utilisation by hypothesising that the poor quality of ICDS services leads the Hindu upper castes to exit the ICDS market and seek these services elsewhere; thirdly,.
The evaluation of the ICDS program, as summarised above, is particularly important in the light of the Government of India’s view, as articulated in its Eleventh Five Year Plan, that growth is not perceived as “sufficiently inclusive for many groups, especially Scheduled Castes, Scheduled Tribes, and Minorities”.3 In terms of the Government of India’s flagship social welfare programs, of which the ICDS is one (the others being the Total Sanitation Program and the National Rural Health Mission), access to services by people from deprived groups is the key to inclusivity. The observe of inclusion is, of course, exclusion and one of the purposes of this paper is to measure the degree of “exclusionary bias” in the provision of ICDS services or, in other words, to measure the relative access to ICDS services by mothers and children from “deprived” groups, compared to access by those from more “privileged” groups.
The results reported in this paper are based on data provided by the Indian Human Development Survey (IHDS) for 2005 which asked ever married women between the ages of 15 and 49 (hereafter, “eligible women”) about whether they received various types of ICDS services (Desai, et. al., 2009). There were, in total, 33,482 such women, each woman drawn from a different household, where these (33,482) households were drawn from a variety of social groups and faced different economic circumstances. In addition to information about the women’s households, the IHDS also provided information on the circumstances of the
3
4
women in terms of inter alia their age, education level, and number of children. It should be emphasised that this paper is an analysis of access to ICDS services by women of differing personal and household circumstances. It is not an analysis of their access to health services in general or, about the quality of the health services they accessed or, indeed, about their (and their children’s) health outcomes.
2. Budgetary Background and Access to ICDS Services
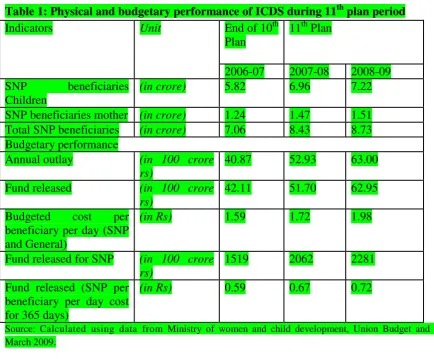
Calculation based on Census projection shows that there are 17.4 crore children in the age group of 0-6 years during 2006-2007. As Table 1 (based on the report of Ministry of Women and Child Development (MWCD)) shows, 5.82 crore children in the age group of 0-6 years are benefitted from ICDS. Similarly as per projection during 2008-09 there were 17.7 crore children of which about 7.22 crore children were benefited from ICDS. Though there was increase in the number of beneficiaries but still it falls short of the children targeted under ICDS programme (Diwakar 2010).
According to the 11th plan period, Rs 8,480 crore was allocated annually for the ICDS services. However, the actual allocation during 2007-08 and 2008-09 was only Rs. 5,200 crore and Rs. 6,300 crore respectively. Thus, there was a shortfall of 39% fund in 2007-08 and 26% in 2008-09. Moreover, of the total amount released Rs. 1,519 core in 2007-08 (28.7%) and Rs 2,281 crore in 2008-09 (34.9%) was given for the Special Nutritional Programme (SNP) and the rest went for Non-food components. In case of SNP, 50% has to be shared by the state government.
As per the norms the government has to spend Rs. 2 per day for children and 2.30 per day for pregnant women and nursing mothers for SNP till 2008. Later it was revised to Rs. 4 for children and Rs. 5 for them respectively4. The fund released on SNP by the central government shows that only Rs. 0.59 was provided per beneficiary per day in 2006-07 and it increased to Rs. 0.72 in 2008-09.5 It clearly shows there is a huge shortfall in the financial allocation of SNP for the children as per norms and it was the major reason for the poor quality of food (Diwakar 2011). Table 2 shows that expenditure on ICDS was only 0.8% of the total union budget and 0.12% of GDP.
4
F.NO. 5-9/2005/ND/Tech (Vol III). Govt.of.India. Ministry.of WCD. Dt.24.02.2009 5
5
Table 1: Physical and budgetary performance of ICDS during 11th plan period
Indicators Unit End of 10th
Plan
11th Plan
2006-07 2007-08 2008-09 SNP beneficiaries
Children
(in crore) 5.82 6.96 7.22
SNP beneficiaries mother (in crore) 1.24 1.47 1.51
Total SNP beneficiaries (in crore) 7.06 8.43 8.73
Budgetary performance
Annual outlay (in 100 crore
rs)
40.87 52.93 63.00
Fund released (in 100 crore
rs)
42.11 51.70 62.95
Budgeted cost per beneficiary per day (SNP and General)
(in Rs) 1.59 1.72 1.98
Fund released for SNP (in 100 crore rs)
1519 2062 2281
Fund released (SNP per beneficiary per day cost for 365 days)
(in Rs) 0.59 0.67 0.72
[image:6.595.67.501.442.694.2]Source: Calculated using data from Ministry of women and child development, Union Budget and MPR March 2009.
Table 2: Share of ICDS Allocation in GDP and Annual Budget
Expenditure Heads (in crores)
2005-06 2006-07 2007-08 2008-09
Expenditure on ICDS
3326 4210 5170 6294
Total union Budget 508705 581637 709373 750884 Expenditure as %
of annual union budget (%)
0.65 0.72 0.73 0.84
GDP at current price 3586744 4129173 4723400 5426277 Expenditure as
% of GDP (%)
0.09 0.10 0.11 0.12
6
Against this budgetary background for ICDS, The IHDS distinguished between six different types of ICDS services which (eligible) women could have received from AWCs:
1. Benefits while pregnant or lactating. These included supplementary feeding, prophylaxis against vitamin A deficiency and control of nutritional anaemia. Also included were the immunisation of pregnant women against tetanus and nutritional and health education to build the capacity of women to look after themselves and their children.
2. Immunisation of child/children against six major diseases: polio, diphtheria, pertussis, tetanus, tuberculosis, and measles.
3. Health checks for children including: management of malnutrition, treatment of diarrhoea, de-worming, and distribution of medicines. Also included were the antenatal care of expectant, and postnatal care of nursing, mothers.
4. Supplementary feeding support for children for 300 days in a year with a view to narrowing the gap between the nationally recommended calorific intake and that received by the children.
5. Monitoring children’s growth, with sick or malnourished children and children with disabilities being referred to the Primary Health Centre.
6. Providing children with pre-school education. In addition to preparing children for primary school, this service also offers substitute care to young children thus freeing older siblings – particularly girls – to attend school.
[image:7.595.67.531.505.678.2]The eligible women in the IHDS were asked whether they had received each of the benefits, enumerated above, for: (i) their last birth and (ii) their next to last birth. Since the number of valid responses to these questions was considerably greater in respect of last births, compared to next to last births, it is the answers pertaining to last births that are analysed in this paper.
Table 3: Anganwadi Benefits Received by Mother and Last Born Child, by Social Group
Benefit Type↓ Proportion of Mothers in Group Receiving Benefit (%) Brahmin/High
Caste Hindu
SC ST
(Hindu)
ST (non-Hindu) Hindu OBC Muslim (OBC) Muslim (upper class) Other groups Total While pregnant/ lactating 16.5 (2,100) 25.0 (2,368) 37.3 (668) 26.6 (229) 22.0 (3,667) 12.6 (754) 9.7 (880) 6.6 (347) 20.5 (8,755)
Child immunised 20.7 (2,060) 27.8 (2,395) 48.0 (757) 38.6 (254) 29.6 (3,555) 17.9 (726) 9.8 (815) 9.5 (315) 26.2 (10,877) Child’s health checked 17.0 (2,038) 21.5 (2,377) 34.5 (741) 20.6 (253) 21.4 (3,529) 13.2 (722) 10.1 (812) 8.4 (311) 19.7 (10,783) Child’s food received 17.5 (2,035) 26.2 (2,376) 38.0 (739) 31.0 (252) 22.8 (3,516) 12.7 (718) 11.1 (813) 4.5 (311) 21.7 (10,760) Child’s growth monitored 18.2 (2,037) 25.0 (2,368) 37.4 (738) 23.7 (253) 23.9 (3,513) 11.1 (715) 10.0 (812) 6.8 (310) 21.6 (10,746) Early/pre-school education received 9.4 (2,031) 9.8 (2,355) 12.4 (735) 11.6 (251) 10.3 (3,501) 5.5 (713) 4.9 (810) 2.3 (308) 9.2 (10,704)
Ever married women between 15 and 49 years of age. Hereafter, “Eligible Women”. Benefits refer to last birth child.
Figures in parentheses refer to the total number of valid responses to the question: “Did you or your child receive this benefit from the
Anganwadi Centre?”
Source: IHDS
7
such as immunisation, supplementary food etc.?” only 20.5% answered in the affirmative. Similarly, only 26.2% of 10,877 women said their (last) child had been immunised at the AWC; only 19.7% of 10,783 women said their (last) child’s health had been checked at the AWC; only 21.7% of 10,760 women said their (last) child had received food from the AWC; only 21.6% of 10,746 women said their (last) child’s growth had been monitored at the AWC; and only 9.2% of 10,704 women said their (last) child had received pre-school education at the AWC. So, approximately one in five mothers said they had received services 1-5 above and less than one in 10 said that their child had received pre-school education.6 These figures are consistent with those from other sources. For example, Sinha (2006) estimated that only 22% of India’s young children were being served by the ICDS program though she did not provide details by type of benefit.
Table 3 also shows that the receipt of benefits varied according to social group. ST Hindu women had the highest rate of utilisation (for example, 48% of the children of ST Hindu women were immunised at the AWCs) followed by SC and then by ST non-Hindu women (for example, 27.8% of the (last born) children of SC women, and 38.6% of the (last born) children ST non-Hindu women, were immunised at the AWCs). At the other end of the scale, the lowest rates of utilisation of AWC benefits were by women who were: Muslim (both from the other backward classes (OBC) and from the upper classes), Brahmin or high caste Hindus, and other social groups like Christians, Sikhs, and Jains.7 So, while it was laudable that the highest rates of utilisation of AWC benefits were by SC and ST women, it was worrying that Muslim women from the OBC exhibited such a low rate of utilisation compared to, say, Hindus from the OBC.8
A study conducted by Indian Institute of Dalit Studies (IIDS) in four states - UP, MP, Bihar and West Bengal - covering 895 respondents, corroborates this finding by showing that, compared to upper caste Hindu mothers, ICDS participation was higher for SC and ST mothers but lower for Muslim mothers. According to this study, 69% of Muslim mothers, compared to 78% of Hindu mothers, utilised ICDS services provided for children up to 3 years of age and 76% of Muslim mothers, compared to 83% Hindu mothers, utilised services provided for children in the of 3-6 years age group.
Some of the difficulties that Muslim mothers faced in accessing ICDS services also applied to SC and ST mothers. For example, about 38% of Muslim mothers complained that AWC workers avoided visiting their locality which resulted in a lack of information about services available at the AWC. The Human Development Sector (2004), in a report for the World Bank, reported that the community or caste of the AWC worker affected access: in one case cited, a worker was averse to having SC children come to the AWC because her father-in-law objected to the presence of lower caste children.
In addition, because of the location of the AWC in parts of the village where the upper castes lived (see Mander and Kumaram, 2006), mothers from vulnerable groups had to
6
This last point is particularly worrying since the government describes pre-school education as the “backbone of the ICDS program”. See http://wcd.nic.in/icds.htm.
7
These figures are also consistent with those from other sources: for example, Thorat and Sadana (2009), using National Family Health Survey data, showed that 36% of SC, and 50% of ST children, received at least one service from an AWC, compared to 30% of OBC, and 28% of “other”, children.
8
8
travel through unfriendly areas to reach the school. It was one thing to brave this journey for the occasional visit to the AWC – to have the child immunised, to have his/her health
checked or growth monitored – but it was quite another thing to have to suffer this journey twice daily. Consequently, mothers from vulnerable groups opted out of sending their children to AWCs for pre-school education.
However, overlaying these difficulties faced by mothers from all the vulnerable groups in accessing ICDS services, patriarchal restrictions on the mobility of Muslim women outside the family home, unaccompanied by another household member, were a specific reason for the poor utilisation of ICDS services by Muslim mothers. Although SC mothers also had difficulty accessing AWC services – through, for example, the reluctance of AWC workers to visit SC hamlets - they did not, experience any familial restraints on their mobility outside the home. Consequently, by going out of the family home (perhaps, for work), SC mothers were able to acquire information themselves about ICDS services without the intermediation of AWC workers. On the other hand, Muslim mothers, who lacked this mobility, were much more reliant on visits by AWC workers for such information and this restricted their access to ICDS services.
Table 4 shows that the lowest rate of utilisation of AWC benefits was by well educated women (Matric or above) 9 with utilisation rates by women with zero years, or 1-5 years, or 6-10 years of schooling being roughly similar. Table 5 shows that women aged 15-20 had the highest utilisation rate, followed by women aged 21-30 and with a sharp fall in utilisation rates for older women. Table 6 shows that poorer women (in the lowest two quintiles of household income) had markedly higher rates of utilisation than women from more affluent (quintiles 4 and 5) households. Table 7 shows that the women in the Southern, Western, and Northern regions of India had much higher rates of utilisation than women living in the Central or Eastern regions. Lastly, Table 8 shows that the utilisation rates of AWC benefits was much higher among rural, compared to urban, women.
9
9
Table 4: Anganwadi Benefits Received by Mother and Last Born Child, by Education of Mother*
Benefit Type↓ Proportion of Mothers Receiving Benefit by Years of Schooling (%) Zero years 1-5 years 6-10 years > 10 years Total
While pregnant/ lactating 21.6 (4,543) 24.0 (1,636) 22.0 (3,274) 10.5 (1,560) 20.5 (11,013)
Child immunised 28.6
(4,579) 31.3 (1,644) 26.2 (3,178) 12.7 (1,476) 26.2 (10,877)
Child’s health checked 20.4 (4,535) 23.6 (1,639) 20.7 (3,146) 10.9 (1,463) 19.7 (10,783)
Child’s food received 24.0 (4,522) 25.5 (1,634) 21.6 (3,141) 10.7 (1,463) 21.7 (10,760)
Child’s growth monitored 22.5 (4,515) 25.7 (1,630) 22.8 (3,140) 11.6 (1,461) 21.6 (10,746)
Early/pre-school education received 9.2 (4,494) 11.8 (1,618) 10.0 (3,135) 4.7 (1,457) 9.2 (10,704)
* Ever married women between 15 and 49 years of age, hereafter, “eligible women”. Benefits refer to last birth child.
Figures in parentheses refer to the total number of valid responses to the question: “Did you or your child receive this benefit from the AWC?”
Source: IHDS
[image:10.595.126.465.336.477.2]
Table 5: Anganwadi Benefits Received by Mother and Last Born Child, by Age of Mother
Benefit Type↓ Proportion of Mothers Receiving Benefit by Age Group (%) 15-20 21-30 31-40 41-50 Total
While pregnant/ lactating 25.9 (911) 23.9 (7,407) 16.4 (2,460) 17.5 (235) 20.5 (11,013)
Child immunised 31.9
(928) 26.8 (7,344) 22.7 (2,373) 19.0 (232) 26.2 (10,877)
Child’s health checked 24.5 (929) 20.1 (7,272) 17.1 (2,353) 14.0 (229) 19.7 (10,783)
Child’s food received 24.5 (926) 22.3 (7,259) 18.9 (2,348) 19.8 (227) 21.7 (10,760)
Child’s growth monitored 25.2 (925) 22.2 (7,249) 18.8 (2,345) 18.1 (227) 21.6 (10,746)
Early/pre-school education received 8.1 (913) 9.2 (7,223) 9.9 (2,340) 7.0 (228) 9.2 (10,704)
See notes to Table 4.
[image:10.595.98.497.584.724.2]Source: IHDS
Table 6: Anganwadi Benefits Received by Mother and Last Born Child, by Household Income
Benefit Type↓ Proportion of Mothers Receiving Benefit by Quintile of Household Income (%) Q1 Q2 Q3 Q4 Q5 Total
While pregnant/ lactating 25.3 (1,790) 24.4 (2,189) 21.8 (2,298) 18.6 (2,247) 13.5 (2,301) 20.5 (10,825)
Child immunised 32.6
(1,855) 31.6 (2,198) 26.0 (2,245) 23.3 (2,182) 18.5 (2,223) 26.2 (10,703)
Child’s health checked 23.1 (1,838) 23.7 (2,181) 19.4 (2,230) 18.4 (2,167) 14.5 (2,194) 19.7 (10,610)
Child’s food received 27.3 (1,837) 27.6 (2,174) 21.7 (2,223) 19.2 (2,163) 13.9 (2,190) 21.7 (10,573)
Child’s growth monitored 26.6 (1,829) 27.4 (2,175) 21.5 (2,218) 19.1 (2,160) 14.6 (2,191) 21.7 (10,573)
Early/pre-school education received 10.1 (1,818) 11.7 (2,169) 9.5 (2,213) 8.6 (2,152) 6.2 (2,180) 9.2 (10,532)
See notes to Table 4.
10
Table 7: Anganwadi Benefits Received by Mother and Last Born Child, by Region
Benefit Type↓ Proportion of Mothers Receiving Benefit by Quintile of Household Income (%) Central South West East North Total
While pregnant/ lactating 12.0 (4,125) 33.8 (2,238) 29.6 (1,555) 15.6 (1,392) 25.9 (917) 21.2 (10,227)
Child immunised 20.0
(4,102) 34.5 (2,043) 39.6 (1,436) 24.7 (1,493) 30.1 (1,049) 26.2 (10,123)
Child’s health checked 14.6 (4,062) 27.6 (2,026) 34.7 (1,427) 13.8 (1,483) 21.5 (1,048) 20.7 (10,046)
Child’s food received 17.0 (4,049) 29.3 (2,022) 25.3 (1,418) 21.4 (1,485) 29.5 (1,048) 22.6 (10,022)
Child’s growth monitored 17.7 (4,043) 26.4 (2,017) 32.5 (1,420) 19.9 (1,481) 25.0 (1,047) 22.7 (10,008)
Early/pre-school education received 5.2 (4,034) 16.4 (2,006) 16.2 (1,417) 4.8 (1,476) 10.8 (1,037) 9.5 (9,970)
See notes to Table 4.
Source: IHDS
Table 8: Anganwadi Benefits Received by Mother and Last Born Child, by Location
Proportion of Mothers Receiving Benefit by Location Rural Urban (Slum) Urban (non-Slum) Total
While pregnant/ lactating 26.2 (7,142) 9.5 (222) 9.3 (3,461) 20.5 (10,825)
Child immunised 32.7
(7,314) 19.3 (233) 11.6 (3,156) 26.2 (10,703)
Child’s health checked 24.4 (7,255) 15.5 (233) 9.0 (3,122) 19.7 (10,610)
Child’s food received 27.9 (7,234) 13.4 (232) 8.1 (3,121) 21.8 (10,587)
Child’s growth monitored 27.3 (7,222) 15.1 (232) 9.1 (3,119) 21.8 (10,573)
Early/pre-school education received 11.3 (7,185) 8.2 (232) 4.4 (3,115) 9.2 (10,532)
See notes to Table 4.
Source: IHDS
3. Estimating the Strength of Factors Influencing the Utilisation of ICDS Services
Given that the utilisation rates of ICDS services differed between mothers from different caste/religious groups (Table 3), and differed also between mothers of different economic/educational/age related/locational attributes (Tables 4-8), this section estimates the relative strength of the different factors which exercised a significant influence on the
utilisation of ICDS services and, in particular, it enquires whether, after controlling for the non-caste/religion factors, there was still significant correlation between the mothers’ caste/religion and their utilisation rates?
[image:11.595.124.463.402.542.2]11
growth monitoring, and early education - with the dependent variable for each equation taking the value 1 if the mother utilised that benefit and 0 if she did not.10 It should be emphasised that in estimating the logit model, it was not possible, for reasons of
multicollinearity, to include all the categories with respect to the variables: the category that was omitted for a variable is referred to as the reference category (for that variable). The explanatory variables for the equations were:
1. The mother’s social group: Christians, Sikhs, and Jains; Scheduled Castes;
Scheduled Tribes; OBC Hindu; OBC Muslim; Upper Caste Muslim. The reference category was ‘Upper Caste Hindus’.
2. The household income of the mother, as defined by the quintile of total household
income, with mothers in households whose income was in the fifth (highest) quintile being the reference category.
3. The principal source of the mother’s household income: agriculture, labourer,
salary, with mothers in households whose principal source of income was trade comprising the reference category.
4. The mother’s age group: 15-20 years, 21-30 years, 31-40 years, with mothers aged 41-50 comprising the reference category.
5. The number of years of schooling of the mother: zero years, 1-5 years, 6-10 years, with mothers with over 10 years schooling comprising the reference category. 6. The mother’s region of residence: South (Andhra Pradesh, Karnataka, and Kerala,
Tamil Nadu); West (Gujarat and Maharashtra); East (Orissa, West Bengal, Assam, and the North-East)’; North (Jammu & Kashmir, Himachal Pradesh, Uttarakhand, Punjab, Haryana, and Delhi). The Centralregion (Bihar, Madhya Pradesh,
Rajasthan, Uttar Pradesh, Chhattisgarh, and Jharkhand) was the reference region. 7. Nature of residential area: urban non-slum; urban slum; rural with urban non-slum
as the reference category.
A natural question to ask from the logit model is how the probability of utilising a particular service would change in response to a change in the value of one of the variables. These probabilities are termed marginal probabilities. The marginal probability associated with a variable refers to the change in the outcome probability consequent upon a unit change in the value of the variable, the values of the other variables remaining unchanged.11 For discrete variables (as, indeed, are all the variables reported above), the unit change in the value of a variable refers to a move from a situation in which the variable takes the value zero to a situation in which the variable takes the value unity, the values of the other
10
The logit equation is
1
Pr( 1)
exp{ } exp{ }
Pr( 0)
K j
jk j j
k j
utilisation
X z
utilisation = β
=
= =
=
∑
for M coefficients, βj j=1…M and for observations on K variables.11
More formally, Pr( 1) z/ (1 z)
j
utilisation = =e +e and the marginal probability with respect to variable k is:
Pr( j 1)
jk
utilisation
X
∂ =
12
variables remaining unchanged.12 Therefore, the marginal probability of a SC mother utilising a particular ICDS service is:
12
13
The probability of utilising the service when all the mothers are from the SC less
The probability of utilising the service when all of the mothers are from the reference category (upper caste Hindus),
with all the values for the other variables (income, education etc.) held constant at their mean values.
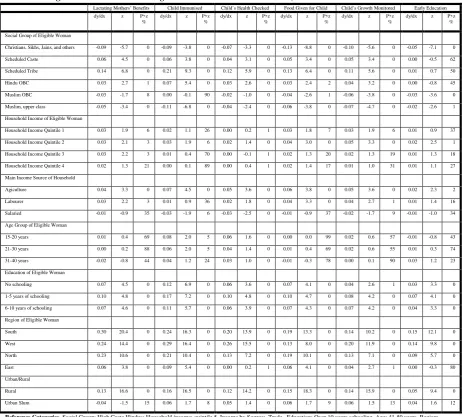
These marginal probabilities are reported in Table 9. So, reading across the relevant row of Table 9, remembering that the comparator is mothers from the reference group of upper caste Hindus, the marginal probabilities for SC mothers were: +6 points for lactating mothers, +6 points for immunisation; +4 points for child’s health check; +5 points for child’s food; +5 points for growth monitoring; and no change for early education. The corresponding figures for ST were higher: +14, +21, +12, +13, and +11 points for, respectively, lactating mothers, immunisation, child’s health check, child’s food, and child’s growth monitoring. Again, the marginal probability associated with early education was zero.
In contrast to the take-up of ICDS services by SC and ST mothers, upper caste
Muslim mothers (compared to mothers from the reference group of upper caste Hindus) were less likely to avail of all ICDS services. The marginal probabilities of upper caste Muslim mothers were: -5 points for lactating mothers; -11 points for immunisation; -4 points for child’s health checks; -6 points for child’s food; -7 points for growth monitoring; and -2 points for early education. Similarly, OBC Muslim mothers (compared to mothers from the reference group of upper caste Hindus) were also less likely to avail of some ICDS services. The (statistically significant) marginal probabilities of OBC Muslim mothers were: -3 points for lactating mothers; -4 points for child’s food; -6 points for growth monitoring; and -3 points for early education.
In summary, the results detailed in Table 9 show – after controlling for other factors13 - the increase in the likelihood of utilising specific ICDS services was highest for ST mothers, next highest for SC mothers, next highest for Hindu OBC mothers, next highest for upper caste Hindu mothers, and lowest for Muslims. So, in terms of reaching mothers from vulnerable groups, the evidence presented here suggests that the ICDS program is tilted in favour of mothers and children from the ST and the SC. However, a worrying feature is that the likelihood of utilising ICDS services by Muslim mothers was lower than the corresponding likelihood for Hindus. For example, as Table 9 shows, the probabilities of Muslim mothers - upper class or OBC - using all or some of the various ICDS services was significantly lower than that for upper caste Hindu mothers.
Table 9 also shows that mothers whose main source of household income was agriculture or labouring were more likely to access all ICDS services compared to mothers whose main source of household income was from other sources; conversely, mothers whose main source of household income was a regular salary were less likely to access ICDS services compared to mothers whose main source of household income was from
13
14
salaried sources. Once the source of income had been accounted for, the household income of the mothers (with the richest households as the reference category) did not exert a
significant effect on their likelihood of accessing ICDS services except that: (i) the poorest mothers (those whose household incomes were in the bottom two quintiles) were more likely to obtain supplementary nutrition for their children from the AWCs, relative to mothers from better off households and (ii) mothers whose household incomes were in the bottom three quintiles were more likely to access ICDS services while they were lactating.
While the age of the mother was not, in general, a significant factor in affecting the likelihood of her accessing ICDS services, her level of education did play a role. Compared to mothers with more than 10 years of schooling, mothers with fewer years of schooling (6-10, 1-5, none) were more likely to access all the ICDS services. However, in the latter category, there was hardly any difference between mothers with different levels of schooling (6-10, 1-5, none) in their respective likelihoods of accessing ICDS services.
In the context of region, compared to mothers living in the central region (which was the reference region), mothers living in the South had the highest likelihood of accessing ICDS services, followed by mothers living in the West and the North of India. In the context of rural/urban location, compared to mothers in urban areas, rural mothers were much more likely to access ICDS services: by 13.1 points for lactating mothers, by 15.8 points for
15
Table 9: Marginal Probabilities from Logit Estimates of AWC Benefits: 10,573 observations
Lactating Mothers’ Benefits Child Immunised Child’s Health Checked Food Given for Child Child’s Growth Monitored Early Education
dy/dx z P>z
%
dy/dx z P>z %
dy/dx z P>z %
dy/dx z P>z %
dy/dx z P>z
%
dy/dx z P>z %
Social Group of Eligible Woman
Christians, Sikhs, Jains, and others -0.09 -5.7 0 -0.09 -3.8 0 -0.07 -3.3 0 -0.13 -8.8 0 -0.10 -5.6 0 -0.05 -7.1 0
Scheduled Caste 0.06 4.5 0 0.06 3.8 0 0.04 3.1 0 0.05 3.4 0 0.05 3.4 0 0.00 -0.5 62
Scheduled Tribe 0.14 6.8 0 0.21 9.3 0 0.12 5.9 0 0.13 6.4 0 0.11 5.6 0 0.01 0.7 50
Hindu OBC 0.03 2.7 1 0.07 5.4 0 0.03 2.6 0 0.03 2.4 2 0.04 3.2 0 0.00 -0.8 45
Muslim OBC -0.03 -1.7 8 0.00 -0.1 90 -0.02 -1.0 0 -0.04 -2.6 1 -0.06 -3.8 0 -0.03 -3.6 0
Muslim, upper class -0.05 -3.4 0 -0.11 -6.8 0 -0.04 -2.4 0 -0.06 -3.8 0 -0.07 -4.7 0 -0.02 -2.6 1
Household Income of Eligible Woman
Household Income Quintile 1 0.03 1.9 6 0.02 1.1 26 0.00 0.2 1 0.03 1.8 7 0.03 1.9 6 0.01 0.9 37
Household Income Quintile 2 0.03 2.1 3 0.03 1.9 6 0.02 1.4 0 0.04 3.0 0 0.05 3.3 0 0.02 2.5 1
Household Income Quintile 3 0.03 2.2 3 0.01 0.4 70 0.00 -0.1 1 0.02 1.3 20 0.02 1.3 19 0.01 1.3 18
Household Income Quintile 4 0.02 1.3 21 0.00 0.1 89 0.00 0.4 1 0.02 1.4 17 0.01 1.0 31 0.01 1.1 27
Main Income Source of Household
Agiculture 0.04 3.3 0 0.07 4.5 0 0.05 3.6 0 0.06 3.8 0 0.05 3.6 0 0.02 2.3 2
Labourer 0.03 2.2 3 0.01 0.9 36 0.02 1.8 0 0.04 3.3 0 0.04 2.7 1 0.01 1.4 16
Salaried -0.01 -0.9 35 -0.03 -1.9 6 -0.03 -2.5 0 -0.01 -0.9 37 -0.02 -1.7 9 -0.01 -1.0 34
Age Group of Eligible Woman
15-20 years 0.01 0.4 69 0.08 2.0 5 0.06 1.6 0 0.00 0.0 99 0.02 0.6 57 -0.01 -0.8 43
21-30 years 0.00 0.2 88 0.06 2.0 5 0.04 1.4 0 0.01 0.4 69 0.02 0.6 55 0.01 0.3 74
31-40 years -0.02 -0.8 44 0.04 1.2 24 0.03 1.0 0 -0.01 -0.3 78 0.00 0.1 90 0.03 1.2 23
Education of Eligible Woman
No schooling 0.07 4.5 0 0.12 6.9 0 0.06 3.6 0 0.07 4.1 0 0.04 2.6 1 0.03 3.3 0
1-5 years of schooling 0.10 4.8 0 0.17 7.2 0 0.10 4.8 0 0.10 4.7 0 0.08 4.2 0 0.07 4.1 0
6-10 years of schooling 0.07 4.6 0 0.11 5.7 0 0.06 3.9 0 0.07 4.3 0 0.07 4.2 0 0.04 3.3 0
Region of Eligible Woman
South 0.30 20.4 0 0.24 16.3 0 0.20 13.9 0 0.19 13.3 0 0.14 10.2 0 0.15 12.1 0
West 0.24 14.4 0 0.29 16.4 0 0.26 15.5 0 0.13 8.0 0 0.20 11.9 0 0.14 9.8 0
North 0.23 10.6 0 0.21 10.4 0 0.13 7.2 0 0.19 10.1 0 0.13 7.1 0 0.09 5.7 0
East 0.06 3.8 0 0.09 5.4 0 0.00 0.2 1 0.06 4.1 0 0.04 2.7 1 0.00 -0.3 80
Urban/Rural
Rural 0.13 16.6 0 0.16 16.5 0 0.12 14.2 0 0.15 18.3 0 0.14 15.9 0 0.05 9.4 0
Urban Slum -0.04 -1.5 15 0.06 1.7 8 0.05 1.4 0 0.06 1.7 9 0.06 1.5 13 0.04 1.6 12
Reference Categories. Social Group: High Caste Hindus; Household income: quintile 5. Income by Source: Trade. Education: Over 10 years schooling. Age: 41-50 years. Region:
Central. Location: Urban non-slum. Regions by State. South: Andhra Pradesh, Karnataka, Kerala, Tamil Nadu. West: Gujarat, Maharashtra. East: Orissa, West Bengal, Assam, North-East. North: Jammu & Kashmir, Himachal Pradesh, Uttarakhand, Punjab. Haryana, Delhi. Central: Bihar, Madhya Pradesh, Rajasthan, Uttar Pradesh, Chhattisgarh, Jharkhand.
Estimated using IHDS data
Caste/Religion-based Probabilities of Accessing ICDS Services
The basic question that the logit model of income distribution posed was “what is the probability that a mother, with a particular set of characteristics, will ceteris paribus access a
particular type of ICDS service? This probability would depend upon the mother’s caste/religion and upon her non-caste factors. In this section we set out a methodology for isolating the probability of accessing an ICDS service which depends solely upon caste/religion and we term these probabilities the caste/religion-based probabilities of accessing ICDS services.
In order to derive these structural probabilities answer these questions we evaluated the following counterfactual scenarios:
1. We first treat all the mothers in the sample as high caste Hindus (HCH). Suppose
that, under this scenario, UCH
j
p is the average probability of a mother accessing ICDS
service j, j=1, 2, 3, 4, 5, 6.
2. Next, we treat all the mothers in the sample as upper caste Muslims. Suppose that,
under this scenario, UCM
j
p is the average probability of a mother accessing ICDS
16
3. Next, we treat all the mothers in the sample as OBC Hindus. Suppose that, under this
scenario, OBCH
j
p is the average probability of a mother accessing ICDS service j, j=1,
2, 3, 4, 5, 6.
4. Next, we treat all the mothers in the sample as OBC Muslims. Suppose that, under
this scenario, OBCM
j
p is the average probability of a mother accessing ICDS service j,
j=1, 2, 3, 4, 5, 6.
5. Next, we treat all the mothers in the sample as from the SC. Suppose that, under this
scenario, SC
j
p is the average probability of a mother accessing ICDS service j, j=1, 2,
3, 4, 5, 6.
6. Next, we treat all the mothers in the sample as from the ST. Suppose that, under this
scenario, ST
j
p is the average probability of a mother accessing ICDS service j, j=1, 2,
3, 4, 5, 6.
7. Lastly, we treat all the mothers in the sample as Christians, Sikhs, or Jains. Suppose
that, under this scenario, CSJ
j
p is the average probability of a mother accessing ICDS
service j, j=1, 2, 3, 4, 5, 6.
The differences between the probabilities, pHCHj , pHCMj ,pOBCHj , pOBCMj , pSCj ,pSTj , and pCSJj are
entirely the result of different sets of coefficients (HCH, HCM, OBCH, OBCM, SC, ST, and CSJ) being applied to a given set of attributes. These differences may, therefore, be attributed to the unequal responses of mothers - who, except for their caste/religion, are identical in every respect – to various ICDS services. Consequently, these probabilities are referred to as caste/religion-based probabilities. They are to be distinguished from the observed proportions of mothers from the different caste/religious groups accessing ICDS services: these observed proportions depend on the mothers’ caste/religion and upon their non-caste/religion attributes; the caste/religion-based probabilities depend only upon the mothers’ caste/religion.
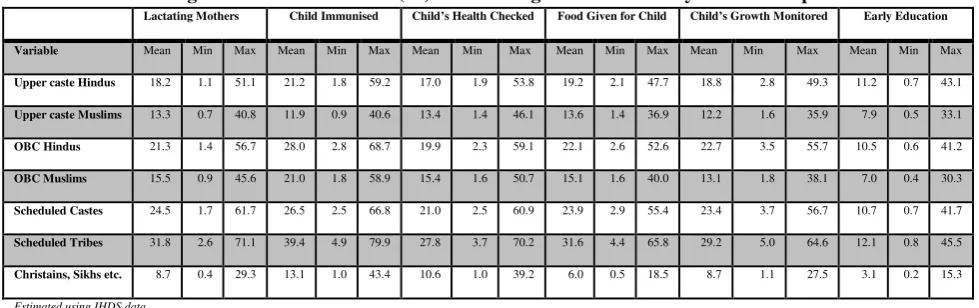
Table 10 shows the structural probabilities for the seven social groups identified in this study. The third row of Table 10 shows that if the entire sample had comprised upper caste Hindu mothers,
the (caste/religion-based) probability of accessing ICDS services would have been: 18% for
lactating mothers, 21% points for immunisation; 17% for child’s health check; 19% for child’s food; 19% for growth monitoring; and 11% for early education.
By contrast, as the fourth row of Table 10 shows, if the entire sample had comprised upper caste Muslim mothers, the (caste/religion-based) probability of accessing ICDS services would have
been considerably lower: 13% for lactating mothers, 12% for immunisation; 13% for child’s
health check; 14% for child’s food; 12% for growth monitoring; and 18% for early education.
At the other end of the spectrum of structural probabilities, as the eighth row of Table 10
shows, if the entire sample had comprised ST mothers, the (caste/religion-based) probability) of
accessing ICDS services would have been considerably higher: 32% for lactating mothers, 39% for
immunisation; 28% for child’s health check; 32% for child’s food; 29% for growth monitoring; and 12% for early education.
17
[image:18.595.65.555.187.341.2]relevant question that it sought to answer was whether mothers from different caste/religious groups, but with identical non-group characteristics, have different likelihoods of accessing ICDS services? As the results of Table 9 and 10 showed, after controlling for non-group characteristics, SC and ST mothers were more likely to use ICDS services, and Muslim mothers were less likely to use ICDS services, compared to the reference group of upper caste Hindu mothers.
Table 10: Caste/Religion-based Probabilities (%) of Accessing ICDS Services by Social Group
Lactating Mothers Child Immunised Child’s Health Checked Food Given for Child Child’s Growth Monitored Early Education
Variable Mean Min Max Mean Min Max Mean Min Max Mean Min Max Mean Min Max Mean Min Max
Upper caste Hindus 18.2 1.1 51.1 21.2 1.8 59.2 17.0 1.9 53.8 19.2 2.1 47.7 18.8 2.8 49.3 11.2 0.7 43.1
Upper caste Muslims 13.3 0.7 40.8 11.9 0.9 40.6 13.4 1.4 46.1 13.6 1.4 36.9 12.2 1.6 35.9 7.9 0.5 33.1
OBC Hindus 21.3 1.4 56.7 28.0 2.8 68.7 19.9 2.3 59.1 22.1 2.6 52.6 22.7 3.5 55.7 10.5 0.6 41.2
OBC Muslims 15.5 0.9 45.6 21.0 1.8 58.9 15.4 1.6 50.7 15.1 1.6 40.0 13.1 1.8 38.1 7.0 0.4 30.3
Scheduled Castes 24.5 1.7 61.7 26.5 2.5 66.8 21.0 2.5 60.9 23.9 2.9 55.4 23.4 3.7 56.7 10.7 0.7 41.7
Scheduled Tribes 31.8 2.6 71.1 39.4 4.9 79.9 27.8 3.7 70.2 31.6 4.4 65.8 29.2 5.0 64.6 12.1 0.8 45.5
Christains, Sikhs etc. 8.7 0.4 29.3 13.1 1.0 43.4 10.6 1.0 39.2 6.0 0.5 18.5 8.7 1.1 27.5 3.1 0.2 15.3
Estimated using IHDS data
4. The Decomposition by Social Group of the Probabilities of Utilising ICDS Services
From the concluding observations of section 3 follows a more general question: how much of the mean difference in the utilisation of an ICDS service between mothers in the different caste/religious groups is due to differences between them in their (non-group) attributes (attributes contribution)? And how much is due to the fact that the mothers belonged to different groups (caste/religion contribution)? The purpose of this section is to answer this question with respect to the following binary comparisons: (i) upper caste Hindu versus SC mothers; (ii) upper caste Hindu versus Muslim mothers; (iii) upper caste Hindu versus OBC Hindu mothers
In the estimation results reported in Table 9, the group effects operated entirely through the intercept terms with the slope coefficients being unaffected by the mothers’ social groups. The implication was that the marginal probabilities associated with the variables - say, the effect of education on the utilisation of ICDS services - was the same for upper caste Hindu mothers as it was for mothers from the SC. This assumption is now relaxed by estimating the six equations, as specified in Table 9, separately for mothers who were upper caste Hindu, Muslim, SC, and OBC Hindu
After doing so, the difference between the reference group of upper caste Hindu mothers and mothers from group X (Muslim, SC, or OBC Hindu), in their respective mean utilisation rates of a specific ICDS service, was decomposed into an “attributes contribution” and a “caste/religion contribution” using the method of Oaxaca (1973) as applied to models of discrete choice (Sinning, Hahn, and Bauer 2008). The attributes contribution was
18
attributes contribution: this could be ascribed to the “structural advantage/disadvantage” which mothers from one group enjoyed over those from group X. Note that we do not, and cannot, say where the source of this structural advantage lies. It could result from a tilt by the AWCs towards mothers from certain groups and/or it could be the consequence of upper caste Hindu mothers opting out of using ICDS services.
The percentage contributions of attributes and caste/religious to the overall difference in utilisation rates between upper caste Hindu mothers and mothers from group X are shown in Table 11 for five AWC services.14 This table shows the decompositions obtained by using the upper caste Hindu coefficient estimates (that is, the estimates obtained when the equation was estimated over the observations pertaining to upper caste Hindu mothers) as the common coefficient vector.
Table 11 shows that for lactating mothers there was a 5.4 percentage point (pp) gap between upper caste Hindu and (all) Muslim mothers in their utilisation of ICDS services: of this gap, 13% could be explained by the fact that Hindu and Muslim (non-religious) attributes were different and 87% was due to difference in religion. However, of the 7 point gap
between (upper caste) Hindu and Muslim mothers in their utilisation of ICDS services for immunising their children, 48% could be explained by the fact that Hindu and Muslim attributes were different and 52% was due to difference in religion. Similarly, of the 7.7 point gap between (upper caste) Hindu and Muslim mothers in their utilisation of ICDS services for monitoring the growth of their children, 29% could be explained by the fact that Hindu and Muslim attributes were different and 71% was due to difference in religion.
In terms of upper caste Hindus and SC mothers, Table 11 shows that, in respect of lactating mothers, there was a -8.6 pp gap between upper caste Hindu and SC mothers in their utilisation of ICDS services: of this gap, 49% could be explained by the fact that Hindu and SC (non-caste) attributes were different and 51% was due to caste difference. Similarly, of the -5.6 pp gap between (upper caste) Hindu and SC mothers in their utilisation of ICDS services for providing supplementary nutrition for their children, 48% could be explained by the fact that upper caste Hindu and SC attributes were different and 52% was due to caste difference.
However, of the -7.2 pp gap between (upper caste) Hindu and SC mothers in their utilisation of ICDS services for immunising their children, only 3% could be explained by the fact that upper caste Hindu and SC attributes were different and 97% was due to caste
difference. Similarly, of the -4.5 pp gap between (upper caste) Hindu and SC mothers in their utilisation of ICDS services for checking the health of their children, the entire difference was due to caste difference.
14
19
Table 11: Decomposition results between upper caste Hindu mothers and mothers from
other groups*
Upper Caste Hindus versus Muslims
Lactating Benefits
Immunisation Health Check
Supplementary Food
Growth Monitored Inter- Group difference in
average utilisation rates (pp)
5.4 7.0 5.4 5.6 7.7
Attributes Contribution** 13% 48% 40% 32% 29%
Caste/Religion contribution*** 87% 52% 60% 68% 71%
Upper Caste Hindus versus SC
Inter- Group difference in
average utilisation rates (pp)
-8.6 -7.2 -4.5 -8.9 -6.7
Attributes Contribution** 49% 3% 0% 48% 13%
Caste/Religion contribution*** 51% 97% 100% 52% 87%
Upper Caste Hindus versus OBC Hindus
Inter- Group difference in
average utilisation rates (pp)
-5.7 -9.2 -4.5 -5.5 -5.8
Attributes Contribution** 35% 18% 23% 26% 11%
Caste/Religion contribution*** 65% 72% 77% 74% 89%
* Decompositions were computed using upper caste Hindu coefficients.
**Difference in average utilisation rates due to inter-group differences in attributes as a percentage of the overall difference. ***Difference in average utilisation rates due to differences in caste/religion as a percentage of the overall difference.
Estimated using IHDS data
6. The Link between the Quality of ICDS Services and their Utilisation
As the previous sections showed, the evidence is that the utilisation rate of ICDS services was higher for mothers and children from “vulnerable” groups (SC and ST) compared to those from relatively “privileged” groups (upper caste Hindus). If this was purely a supply side effect, such that these services were directed towards vulnerable groups (and away from privileged groups), then the AWCs could be credited for this “socially responsible” orientation of ICDS services. However, if mothers from the privileged group, relative to those from the vulnerable group, spurned ICDS services then the higher utilisation of ICDS services by the latter would arise because of demand-side effects. Mothers and children from privileged group would not utilise ICDS services - not because they could not, but because they did not wish, to do so. This effect could arise if it was generally perceived that the quality of ICDS services was poor compared to that of equivalent “market-provided” services. Then, in the face of this general perception of quality difference, it would be persons from the privileged group, with their superior resources, who were more able and willing to buy the higher quality service.
There is a considerable amount of evidence about the poor quality of ICDS services particularly with respect to supplementary feeding and early education. Davey et. al. (2008), in interviews with 200 users of ICDS services at 20 AWCs in Delhi reported that a majority (53%) of respondents were dissatisfied with the quality of services provided, the highest levels of dissatisfaction being recorded for: the location of, and space available in, the AWCs (69% of respondents), the poor quality of food distributed (67% of respondents), and
20
AWCs in Jammu and Kashmir pointed to the lack of adequate facilities “in terms of space (both indoor and outdoor), quality of accommodation, drinking water and toilet facilities, furniture and fixtures and teaching learning material in AWCs.”In a World Bank report, Gragnolati et. al. (2005) also drew attention to the poor facilities at AWCs – most AWCs have no toilet facilities and cooking space is typically inadequate – and to supply-side inadequacies, “especially issues of access, information, and irregularity of food supply”. Moreover, they point out, in the context of the Supplementary Nutrition component of the ICDS program that “field studies have shown that food is sometimes badly cooked, dry, and salty and should be supplemented by sugar, rice, or vegetables to be more wholesome and palatable to children”.
The idea that faced with a drop in product quality, some customers abandon a product for a competing product while other customers remain loyal to it (perhaps, at the same time, voicing their discontent) has been analysed by Hirschman (1970). On the basis his “exit-voice” theory of market behaviour by consumers, the provision of ICDS services poses a conundrum. If they are to be directed towards vulnerable mothers and their children, then the quality of the services needs to be low for it is low quality which keeps away mothers from the privileged groups. On the other hand, any attempt to raise the quality of services will attract mothers from the privileged groups and erode accessibility by vulnerable group mothers.
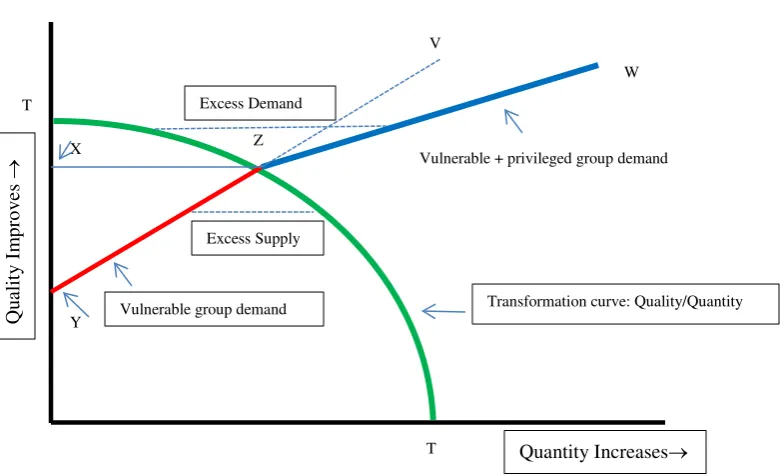
With fixed resources, ICDS providers have to choose an appropriate mix of quality and quantity of a service: lower service quality means more of the service can be provided; on the other hand, attempts to raise quality means that service quantity has to be reduced. In Figure 1, below the curve TT represents the trade-off between quality and quantity: the slope of TT represents the rate at which, at the margin, quality can be transformed into quantity.15 The points X and Y represent the minimum acceptable quality levels to mothers from the privileged and vulnerable groups respectively: mothers from the privileged group will not use the service at or below quality X and mothers from the vulnerable group will not use the service at or below quality Y.
The line YZV represents demand for the service by mothers from the vulnerable group. The segment YZ of this line also represents market demand since, up to Z, demand by mothers from the privileged group is zero. After Z, when demand by mothers from the privileged group is positive, market demand is represented by ZW: for any quality level, market demand (ZW) exceeds demand by mothers from the vulnerable group (ZV) by the amount of demand by mothers from the privileged group.
So, for a level of quality level between points Y and X, there is excess supply: supply by the government exceeds demand by mothers from the vulnerable group. For the quality level represented by the point X, demand equals supply. Lastly, for quality levels in excess of that that at X, there is excess demand: demand by mothers from both groups in sum exceeds total supply.
15
21
Q
ua
li
ty I
m
p
ro
ve
s
→
[image:22.595.106.497.224.462.2]Quantity Increases→ Transformation curve: Quality/Quantity
Figure 1: The Quality-Quantity Trade-off by Different Customer Types
X
Y
Vulnerable + privileged group demand Z
T
T V
W
Excess Supply Excess Demand
22
Universal Utilisation of ICDS
We havesuggested that a good ICDS program would be one in which mothers from privileged groups participate less and mothers from vulnerable and marginalised groups participate more, consistent with a satisfactory quality of ICDS services. While it makes sense to direct limited government resources to needier groups, two questions arise. First, are the resources limited? Or is the bigger problem that most allocated resources don’t make it to the village level? Second, it may be that including better-off and more powerful groups in a programming would improve the quality of services for everyone. In this section we address this question.
The Central Vigilance Committee (CVC) on the public distribution system (PDS) appointed by the Supreme Court has said that the criteria for the selection of Below Poverty Line (BPL) households is inappropriate.16 The finding of the CVC shows that there are large number of inclusion and exclusion errors in the provision of below poverty line (BPL) and Antodaya Anna Yojana (AAY) cards. The latest (61st) round of the National Sample Survey Organisation (NSSO) of the Government of India shows almost a fourth of the poorest families in the country do not have any access to any ration card. The other alarming fact is that 16.8 % of households in the highest income quintile have BPL cards while only 49% of households in the lowest income quintile have BPL or AAY cards (Commissioners 7th report, 2007).
These facts show that government programmes targeted towards BPL households have inherent problems in directing services towards people in need. Access to subsidised food by the poor after the introduction of the Targeted Public Distribution System (TPDS) has worsened at an all India level. The TPDS performs poorly not only in terms of its objective of providing services for the poor but also in terms of program implementation which is marked by leakages and corruption. But in states like Tamil Nadu, Andhra Pradesh, Orissa and Chhattisgarh where the public distribution system is universal or quasi-universal it covers poor people in need of subsidized grains (Himanshu 2013).
Further, the literature on the implementation of ‘universal’ programmes shows all poor and needy children are included in the programme (Commissioners 7th report, 2007). Midday meals (MDM), which is another universal programme covering all the children going to school from classes 1-8, provides an opportunity for the children from marginalized section to be included (Harris-White 1994) and, consequently, poor and the marginalized children are ensured one full meal a day. Universality also means that there is pressure from the public to improve the quality of MDM and governments respond to such pressure. For example, the MDM menu in Tamil Nadu consists of a variety of food (including eggs provided 2-3 times a week) to the children. Even small problems in the programme are reported by the media placing the government under pressure to offer immediate redress. In the 1990’s attempts to ‘target’ the PDS in Tamil Nadu met with public resistance and, in consequence, was made ‘universal’ (Harris-White 2004).
Before 2006, the ICDS programme only to a limited number of beneficiaries. However, a Supreme Court order dated December 13th, 2006 declared that the
16
23
“universalisation of the ICDS involves extending all ICDS services to every child under the age of six, all pregnant women and lactating mothers and all adolescent girls”, Dreze’s (2006) study found that after the Supreme Court judgment, the number of AWC increased without any commensurate importance being given to the improvement in the quality of services. Consequently, many of the eligible beneficiaries opted out. There is an urgent need to improve the quality of ICDS services along with extending its coverage to make it
universal (Dreze 2006).17
7. Conclusions
The ICDS Program, by addressing issues of early education, malnutrition, and morbidity is an imaginative response by the Indian government to the multi-faceted challenge of providing for the health and development of children and their mothers. In its implementation, however, the program embodies several inequalities. Although the ICDS policy stipulates that there should be one AWC per 1,000 persons (and 700 persons in tribal areas), the coverage is much better in the wealthier states. As Gragnolati et. al. (2005) show, ICDS coverage by state rises with per capita Net State Domestic Product with five states with the highest prevalence of underweight children – Bihar, Madhya Pradesh, Orissa, Rajasthan, and Uttar Pradesh – having the lowest coverage. At the same time, states like Manipur, Mizoram, Nagaland, which have a low prevalence of under nutrition, have high ICDS coverage.
The second type of inequality is the distribution of AWCs within states: in 1998, while only half the villages from the lowest two deciles of the all-India wealth distribution in had AWCs, the ICDS program covered 80% of the richest villages in India (Gragnolati et. al., 2005). The third type of inequality is locational inequality within a village. Mander and Kumaran (2006) have observed that, in mixed-caste villages, the ICDS centre was never located in the SC or ST hamlet.
The fourth type of inequality is based on excluding – or, more accurately, restricting - persons from certain groups from using ICDS services. Mander and Kumaran (2006) provide a comprehensive account about the forms that such exclusion/restriction take. To a large extent this involved the attitude of the service provider: AWC workers might be reluctant to collect children from lower caste hamlets; the AWCs might be more reluctant to enrol children from the lower castes, compared to those from the upper castes, if there was an overall ceiling on enrolment; lastly, lower caste parents might be anxious about how their children would be treated while at theAWC.
However, notwithstanding the validity and, indeed, importance, of these points, the evidence is that, for whatever reasons, mothers from the SC and the ST were more likely – and Muslim mothers less likely - to use ICDS services compared to upper caste and OBC Hindu mothers. This suggests that there is a complexity of factors underlying the observed
17
Tamil Nadu leads the way in nutrition programme for children with the first nutrition programme starting in 1956. The quality of ICDS services in Tamil Nadu is considered better than in most other states (Rajivan 2006). Similarly, in Andhra Pradesh, forming village level committees involving different stakeholders in monitoring the programme has helped to improve the quality of the ICDS services and caters services to eligible
24
outcome in terms of group beneficiaries. First, leavening the accounts of exclusion, there might be enlightened and progressive persons involved in the delivery of ICDS services who actively promote the usage of these services by mothers from the SC and the ST. Second, there might be the perception among upper caste Hindu mothers that the quality of ICDS services is poor – in particular, poor quality food in supplementary nutrition and poor quality pre-school education - and that, recognising the importance of these services, they would prefer to obtain these elsewhere. So, while the AWC might, as a symbol of caste power, be located in the “main” village where the upper castes reside, it would be used relatively lightly by upper caste mothers. This is Hirschman’s (1970) “exit response” to poor quality products.
25
References
Anand, S. and Sen, A. K. (1997). Concepts of Human Development and Poverty: A Multidimensional Perspective, Human Development Report 1997 Papers, New York, UNDP.
Borooah, V.K. (2001), “The Measurement of Employment Inequality Between Population Subgroups: Theory and Application”, Labour, 15:169-89.
Bourguignon, F. (1979), “Decomposable Income Inequality Measures”, Econometrica, 47: 901-20.
Davey, A., Davey, S., and Datta, U. (2008), “Perception Regarding Quality of Services in Urban ICDS Blocks in Delhi”, Indian Journal of Public Health, 52(3): 156-158.
Desai, S., Vanneman R., and National Council of Applied Economic Research, New Delhi (2009), India Human Development Survey (IHDS), 2005 [Computer file].
ICPSR22626-v5, Ann Arbor, MI: Inter-university Consortium for Political and Social Research [distributor], 2009-06-22. DOI:10.3886/ICPSR22626.
Dhingra, R. and Sharma, I. (2011), “Assessment of Preschool Component of ICDS Scheme in Jammu District”, Global Journal of Human Science, 11(6): 13-18.
Diwakar G.D. (2010), Critical Appraisal of ICDS Programme: Budget and Resource Analysis, Journal of the Madras School of Social Work, A half yearly review of social work and social sciences, Special Edition-II, pp 133-146
Diwakar G.D. (2011), “Relevance of ICDS programme in post liberalisation period in addressing the malnutrition among 0-6 years children: A case study of Kancheepuram District, Tamil Nadu”, (eds) Sigamani and N.U.Khan., Reinventing Public Management & Development in Emerging Economies, Advanced Research Series, pp 55-74, Macmillan, New Delhi.
Dreze, Jean (2006), ‘Universalisation with Quality ICDS in a Right Perspective’, Economic and Political Weekly, vol. 41, no. 34, pp. 3706- 3715.
FOCUS (2009), Focus on Children under Six, New Delhi: Citizens’ Initiative for the Rights of Children under Six (CIRCUS).
Gill, K. (2012), Promoting ‘Inclusiveness’: A Framework for Assessing India’s Flagship Social Welfare Programs, Social Policy Working Paper Series – 2, New Delhi: UNICEF.
Ghosh, S. (2006), “Food Dole or Health, Nutrition, and Development Program”, Economic and Political Weekly, 41(34): 3664-3666.
Gopalan, T. (1992), “Growth Charts in Primary Health Care”, Indian Journal of Maternal and Child Health, 3(4): 98-103.
Gopalan, T. (2006), “Hidden Hunger: the Problem and Possible Interventions”, Economic and Political Weekly, 41(34): 3671-3674.
Gragnolati, M., Shekar, M., Das Gupta, M., Bredenkamp, C., Lee. Y-K. (2005), India’s Undernourished Children: A Call for Reform and Action, Washington DC: The World Bank.
26
Harris-White, Barbara (2004), ‘Nutrition and its Politics in Tamil Nadu’, South Asia Research, pp 51-71.
Himanshu (2013), Food security in India, ADB Working Paper Series (No.369), Asian Development Bank: Manila..
Hirschman, A.O. (1970), Exit, Voice, and Loyalty: Responses to Decline in Firms, Organisations, and States, Cambridge, Mass: Harvard University Press.
Human Development Sector (2004), Reaching out to the Child: An Integrated Approach to Child Development, Washington DC: The World Bank.
Kapil, U. and Pradhan, R. (1999), “Integrated Child Development Services scheme (ICDS) and its impact on the nutritional status of children”, Indian Journal of Public Health,
43(1): 21-25.
Mander, H. and Kumaran, K. (2006), Social Exclusion in ICDS: a Sociologist Whodunit, ftp://ftp.solutionexchange.net.in/public/food/resource/res15071101.pdf.
Nayak, N. and Saxena, N.C. (2006), “Implementation of ICDS in Bihar and Jharkhand”, Economic and Political Weekly, 41(34): 3680-3684.
Oaxaca, R. (1973), “Male-Female Wage Differentials in Urban Labor Markets”, International Economic Review, 14: 693-709.
Planning Commission (2008), Eleventh Five Year Plan, 2007-2012: Volume 1 Inclusive Growth, New Delhi: Oxford University Press.
Qadiri, F. and Manhas, S. (2009), “Parental Perception Towards Preschool Education Imparted at Early Childhood Education Centres”, Studies on Home and Community Science,
3(1): 19-24.
Rajivan, A.K. (2006), “ICDS with a Difference”, Economic and Political Weekly,
41(34): 3685-3688.
Sen, A.K. (1998), On Economic Inequality, Oxford University Press: Delhi.
Sinning, M., Hahn, M., and Bauer, T.K. (2008), “The Blinder-Oaxaca Decomposition for
non-linear Regression Models”, The Stata Journal, 8: 480-492.
Sinha, Dipa (2006), ‘Rethinking ICDS: A Right Based Perspective’, Economic and Political Weekly, 41:34, pp. 3689- 3684.
Sinha, S. (2006), “Infant Survival: A Political Challenge”, Economic and Political Weekly, 41(34): 3657-3660.
Sundararaman, T. (2006), “Universalisation of ICDS and Community Health worker Programs: Lessons from Chhattisgarh”, Economic and Political Weekly, 41(34): 3674-3679.
Tandon, B.N. and Gandhi, N. (1992), “Immunisation Coverage in India for Areas Served by the Integrated Child Development Services Program”, Bulletin of the World Health Organisation 70(4): 461-465.
Theil, H.(1967), Economics and Information Theory, Amsterdam: North-Holland. Thorat, S. and Sadana, N. (2009), “Discrimination and Children’s Nutritional Status in India”, IDS Bulletin, 40(4): 25-29.