ISSN Online: 2153-120X ISSN Print: 2153-1196
Simulation and Experimental Data of P-E
Hysteresis Loop in BNT and BKT
Natheer B. Mahmood, Emad K. Al-Shakarchi
Physics Department, College of Science, Al-Nahrain University, Baghdad, Iraq
Abstract
Hysteresis loop measurements performed both experimentally for Bismuth Sodium Titanate (BNT) and Bismuth Potassium Titanate (BKT) samples us-ing modified Sawyer-Tower Circuit. The experiment showed that the P-E hysteresis had main parameters for BNT, remnant polarization (Pr = 27
µC/cm2), spontaneous polarization (P
s = 35 µC/cm2) and coercive electric field
(Ec = 60 kV/cm) and for BKT the remnant polarization was (Pr = 5.2 µC/cm2),
spontaneous polarization (Ps = 30 µC/cm2) and coercive electric field (Ec =
4.72 kV/cm). These three parameters (remnant polarization, spontaneous po-larization, coercive electric field) were used in a simulated software depending on the mathematical model for the polarization in ferroelectric materials. The simulation software predicted the value of applied electric field required to perform the P-E hysteresis experiment varying with Pr, Ps, Ec. The results of
the simulation exhibited agreement with the experimental data. The last pre-diction could help the researchers in studying the ferroelectric hysteresis loop, especially for those studying a fatigue behaviour or studying the effect of elec-tric field cycle on the hysteresis loop.
Keywords
Ferroelectric Behaviour, Fatigue Behaviour, Hysteresis Loop, Perovskite Structure
1. Introduction
Ferroelectric materials are materials possessing spontaneous polarization, which can be reversed by applying of an external electric field over a certain tempera-ture range [1]. The most prominent features of ferroelectric properties are hys-teresis and nonlinearity in the relation between the polarization P and the ap-plied electric field E. The ferroelectric material has a perovskite structure with the formula of ABX3, the cations (A, B) have a different sizes and the anion (X)
How to cite this paper: Mahmood, N.B. and Al-Shakarchi, E.K. (2017) Simulation and Experimental Data of P-E Hysteresis Loop in BNT and BKT. Journal of Modern Physics, 8, 844-851.
https://doi.org/10.4236/jmp.2017.85053
Received: March 23, 2017 Accepted: April 25, 2017 Published: April 30, 2017
Copyright © 2017 by authors and Scientific Research Publishing Inc. This work is licensed under the Creative Commons Attribution International License (CC BY 4.0).
is normally Oxygen ion [2]. The oxygen octahedral perovskite structure has the formula ABO3, and it was considered a promising material because the
sponta-neous polarization is greater than in other ferroelectric families [3]. In this re-search, the BNT ceramic like Bi0.5Na0.5TiO3 and BKT ceramic like Bi0.5K0.5TiO3
were used to study the hysteresis loop and measuring the polarization as a func-tion of electric field by using Sawyer-Tower circuit. The parameters remnant polarization, spontaneous polarization and coercive electric field measured by Sawyer-Tower circuit were used in the simulation program. The simulation program could help researchers to perform the hysteresis loop experiment and polarization fatigue, which help us perform the experimental parameters, espe-cially for the polarization fatigue analysis and measuring polarization fatigue life. A comparison between experiment and theory could help to understand the Po-larization behaviour and poPo-larization domain dynamics.
2. Experimental Work
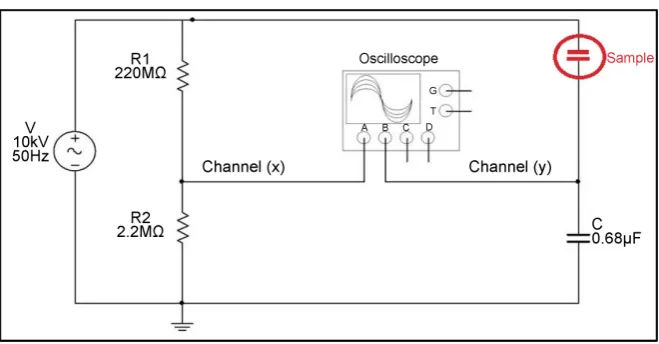
The hysteresis loop measurements during (P-E) loop were studied for ferroelec-tric ceramic Bismuth Sodium Titanate (BNT) and Bismuth Potassium Titanate (BKT) by using modified Sawyer-Tower circuit, as shown in Figure 1. The Sawyer-Tower circuit is consists the following items;
1) High voltage AC Power Supply has the specification (0 - 10 kV), 0.5 A, sine wave and frequency 50 Hz [4]
2) The voltage divider acts as voltage attenuator, and the voltage attenuation calculated according to the equation
( )
22 1
2.2 1
2.2 220 100
in in in
R
V x V V V
R R
= × = × ≈ ×
+ + (1)
3) The capacitor of (0.68 µF) was used.
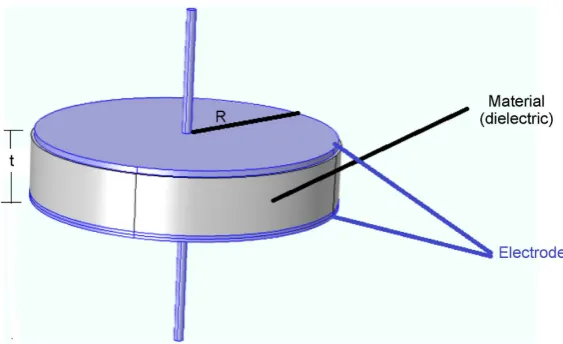
4) The sample that used in this experiment was sandwiched between two gold electrodes as shown in Figure 2, and dipped in low viscosity oil (Silicon oil) to prevent discharge due to high voltage.
[image:2.595.209.539.546.718.2]5) The digital storage oscilloscope type Tektronix TBS 1000 was used to ac-
Figure 2. The sandwiched sample under test.
quire the signals with some modifications on both value of x-y axes, such that the x-axis is the Electric field (kV/cm) calculated by the following equation;
( )
( )
division V 100 0.001
kV cm cm V E t × × =
(2)
The y-axis is the polarization (µC/cm2) calculated in the following equation;
( )
( )
6 division
division
2 2 2
10 F
C 0.68
cm Area cm π
V C P V r × × µ = = ×
(3)
where the parameters (r, t) are the radius and the thickness of the ceramic disc sandwiched between two electrodes respectively.
The hysteresis loop measurement had been done by increasing the voltage gradually to get the curve of the hysteresis, then the saturation polarization (Ps),
Remnant polarization (Pr), and coercive electric field (Ec) were measured. The
simulation of hysteresis loop was performed by designing a program using Lab-View2016 depending on the mathematical model of (P-E) loop by the following equation [5][6][7];
tanh 2 c s E E P P δ ± − = ±
(4.a)
The parameter (P) is the polarization, the positive sign is referring to positive polarization P+
( )
E , while the negative sign refers to negative polarization( )
P− E , such that P−
( )
E = −P+( )
E by the symmetry. The parameter (E) isthe applied electric field, and (Ec) is the coercive electric field. The factor (δ) is a
polarization relaxation coefficient and calculating according to the following equation; 1 1 ln 1 r s c r s P P E P P δ − + = −
(4.b)
The factor (Pr) is remnant polarization, and (Ps) is the saturation polarization.
maximum applied electric field (Emax), Ec, Pr, Ps, and number of steps (>100 steps
normally). The output data is the P-E loop as a graph and table, which could be saved with different extensions as excel file, Matlab or Origin profile.
3. Results and Discussion
The hysteresis loop for ferroelectric ceramic was performed using modified Sawyer-Tower circuit at 50 Hz using adjustable AC power supply as mentioned before. The polarization as a function electric field was plotted as a result from the output of the oscilloscope and estimate the remnant polarization (Pr),
spon-taneous polarization (Ps), and coercive electric field (Ec) for each sample. The
Sawyer-Tower circuit was modified by adding the voltage divider to attenuate voltage by a factor of 0.01 V in order to prevent oscilloscope from damage. If the maximum applied voltage is (10 kV) then the voltage appeared on the oscillos-cope will be (100 V), attenuated by a factor 0.01. The normal capacitor (0.68 µF) was used, such that it was greater than the sample capacitance by (100) time, which was about (300 pF). The high capacitor connected in series has low vol-tage comparing with a low capacitor that possess high volvol-tage where
total 1 2
V =V +V . If the applied voltage on both capacitors in series was (10 kV), so
the voltage on the normal capacitor (0.68 µF) will be 5 V, while the voltage on the sample will be 9995 V. Most of the applied voltage exerted on the sample that was very important because one could be apply more than the twice coercive electric field on the sample in order to get a sharp hysteresis loop.
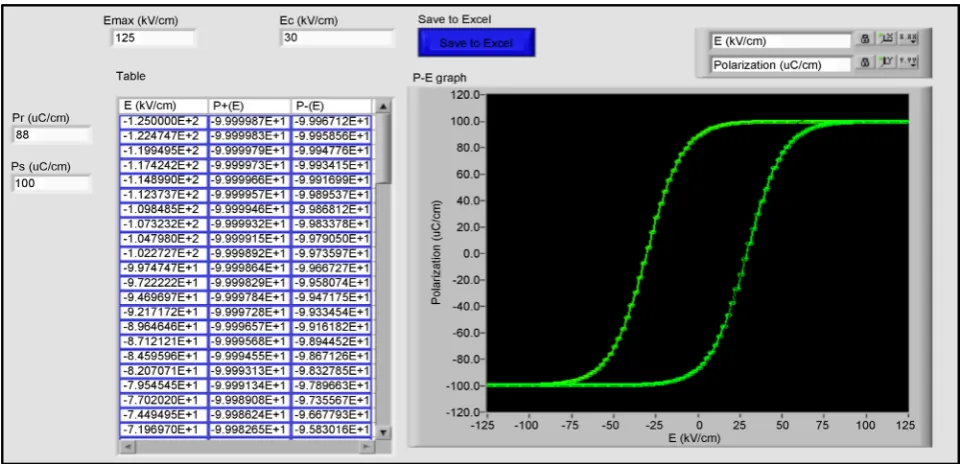
The estimated values of (Pr, Ps and Ec) were used in the computer simulation
as inputs, the obtainable results from the simulation is transferred into the hys-teresis shape at the same value of Pr, Ps and Ec. The simulation could help us to
[image:4.595.58.541.485.717.2]predict the applied electric field values required for experimental work. The user interface of (P-E) loop that was designed in this research is shown in Figure 3.
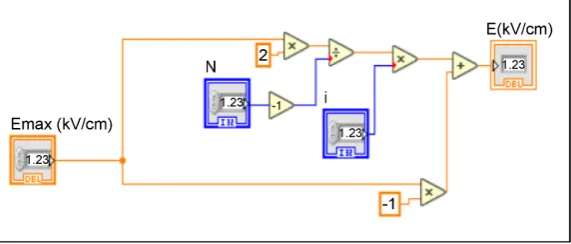
The simulated variable was the electric field on the x-axis and the polarization on the y-axis. Therefore, the changing with the electric field value from negative to positive was dependent by N-step divided on the x-axis, normally N > 100 steps using the following equation inside the loop.
2 1 1 a
i
E E
N
= −
−
(5)
The factor (Ea) is the applied electric field value, which is actually has the
maximum value (Emax). The above equation performed as an electric field sweep
kit, shown in Figure 4. For example N = 100 steps, for i = 0 so E = −Ea, for i = 1
so E= −0.9Ea and for i = 99 so E = +Ea (100 steps means i = 0 to 99). The second variable, the polarization was performed as a kit depending on the Equa-tion (1), as shown in Figure 5. The simulated block diagram of (P-E) hysteresis loop is collected into a single program as shown in Figure 6.
The simulation was important to solve many problem, the first one was the value of the applied electric field, a lot of researches had chosen the applied electric field value by increasing the voltage until the hystersis loop appeared [8]. They were adviced to use the applied electric field by (2Ec) [8][9][10], because it was required a totally reversing the polarization. This value is correct in the case Ps =
Pr only [10][11]. Our analysis is predicted the applied electric field value to be
[image:5.595.232.518.419.541.2](ηEc), where the parameter (η) is depending on the ratio Ps/Pr, i.e. linearly de-pendent on (δ). The values of the applied electric field are symmetric that mak-ing P+
( )
E =P−( )
E , as mentioned in the Equation (1). The simulation had [image:5.595.236.511.566.715.2]Figure 4. The electric field sweep kit.
been done depending on the Equation (2), to predict the applied electric field and then the polarization, using the stop condition if P+
( )
E =P−( )
E . The userinterface of the simulated program to predict the electric field is shown in Fig-ure 7. The results for the applied electric field showed a linearly dependance on the value of the polarization relaxation coefficient (δ) i.e. the differences in (Pr)
and (Ps) is leading to vary the δ-value, which lead to change the value of the
ap-plied electric field (Ea) as shown in Figure 8. The fitting curve concluded the
predicted electric field value by the following equations;
(
1 7.4)
a c
E =E +
δ
(6)(
1 7.4)
η
= +δ
(7)The experimental data of (P-E) hysteresis loop for BNT-ceramic are shown in
[image:6.595.57.539.283.467.2]Figure 9(a). It had the values Pr = 27 µC/cm2, Ps = 35 µC/cm2, and Ec = 60
Figure 6. The block diagram of the P-E hysteresis loop.
[image:6.595.58.541.500.716.2]kV/cm. Whereas the simulated curve had the similar values of Pr, Ps and Ec are
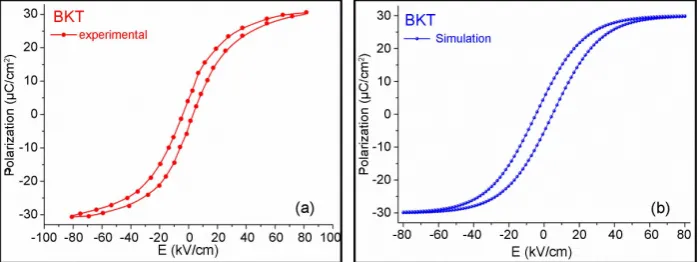
shown in Figure 9(b), with the predicted value of Ea= 257 kV/cm. The BKT
sample was exhibited the experimental values of polarization and electric field with Pr= 5.2 µC/cm2, Ps= 30 µC/cm2 and Ec = 4.72 kV/cm, as shown in Figure
10(a). Whereas the simulated curve with the same values of Pr, Ps and Ec is
shown in Figure 10(b) with the predicted value of Ea = 81 kV/cm. The predicted
[image:7.595.248.499.189.377.2]values of applied electric field of BNT sample was about 4.18Ec i.e. η = 4.18.
[image:7.595.192.539.419.552.2]Figure 8. The predicted applied electric field value as a function of the polarization relaxation coefficient.
Figure 9. The (P-E) hysteresis loop for BNT sample (a) experimental (b) simulation.
[image:7.595.189.539.585.716.2]Whereas the predicted value of applied electric field of BKT sample was about 17.1Ec i.e. η = 17.1. The last results for BKT were agreed with the experiments, while for BNT sample was not clear because it is difficult to apply an electric field >100 kV/cm due to the limitation of the power supply.
4. Conclusion
The hysteresis loop experiment is an important analysis to determine the value of polarization and the coercive electric field on the dielectric media. It was a successful technique to simulate the hysteresis loop experiment depending on the required mathematical equations in polarization of ferroelectric materials. The simulation results showed agreement with experimental output. It was con-sidered to predict the applied electric field values those were used in hysteresis experiment and formulating an equation describing the change in the applied electric field. The last prediction could help the researchers to study the ferroe-lectric hysteresis loop, especially for those who suffering fatigue or studying the effect of electric field cycle on hysteresis loop.
References
[1] Kao, K.C. (2004) Dielectric Phenomena in Solid. Elsevier Academic Press, Amster-dam.
[2] Mahmood, N., Al-Shakarchi, E. and Elouadi, B. (2012) Barium Strontium Titanate. Lambert Academic Press, Saarbrücken.
[3] Uchino, K. (2010) Advanced Piezoelectric Materials: Science and Technology. El-sevier Academic Press, Amsterdam.https://doi.org/10.1533/9781845699758
[4] Al-Shammary, B.H.H. (2014) Construction and Characterization of Pseudospark High Power Plasma Switch. PhD Thesis, Physics Department/College of Science/Al- Nahrain University, Baghdad.
[5] Raye, J.K. and Smith, R.C. (2004) Parameter Estimation Techniques for Nonlinear Hysteresis Models. Smart Structures and Materials 2004, Proceedings of SPIE, Vol. 5383, Bellingham, 155-163.
[6] Lupascu, D.C. (2004) Fatigue in Ferroelectric Ceramics and Related Issues. Series in Materials Science 61, Springer, Berlin. https://doi.org/10.1007/978-3-662-07189-2 [7] Sheikholeslami, A. (1997) IEEE Transactions on Ultrasonics, 44, 917-924.
https://doi.org/10.1109/58.655207
[8] Kampoosiri, S., Pojprapai, S., Yimnirunand, R., and Marungsri, B. (2012) Interna-tional Journal of Electrical, Computer, Energetic, Electronic and Communication Engineering, 6, 1456-1460.
[9] Stewart, M., Cain, M.G. and Hall, D.A. (1999) Ferroelectric Hysteresis Measure-ment and Analysis. NPL Report CMMT(A) 152.
[10] Yoshimura, T. and Fujmura, N. (2003) Japanese Journal of Applied Physic, 42, 6011-6014.https://doi.org/10.1143/JJAP.42.6011
[11] Reece, T.J. and Ducharme, S. (2009) Journal of Applied Physics, 106, Article ID: 124505.https://doi.org/10.1063/1.3271581
Submit or recommend next manuscript to SCIRP and we will provide best service for you:
Accepting pre-submission inquiries through Email, Facebook, LinkedIn, Twitter, etc. A wide selection of journals (inclusive of 9 subjects, more than 200 journals)
Providing 24-hour high-quality service User-friendly online submission system Fair and swift peer-review system
Efficient typesetting and proofreading procedure
Display of the result of downloads and visits, as well as the number of cited articles Maximum dissemination of your research work
Submit your manuscript at: http://papersubmission.scirp.org/