Land Use Changes Do Not Rapidly Change the Trophic
State of a Deep Lake. Amvrakia Lake, Greece
Αnna-Αkrivi Thomatou, Marianna Triantafyllidou, Ekaterini Chalkia, George Kehayias, Ioannis Konstantinou, Ierotheos Zacharias*
Department of Environmental and Natural Resources Management, University of Ioannina, Agrinio, Greece. Email: *izachari@cc.uoi.gr
Received February 12th, 2013; revised March 14th, 2013; accepted April 11th, 2013
Copyright © 2013 Αnna-Αkrivi Thomatou et al. This is an open access article distributed under the Creative Commons Attribution License, which permits unrestricted use, distribution, and reproduction in any medium, provided the original work is properly cited.
ABSTRACT
The study of physicochemical and biological parameters can assess the trend of a lake’s trophic state. A trophic state index (TSI) was used to assess eutrophication of Lake Amvrakia. Total phosphorus and chlorophyll concentrations that recorded were generally at the same level with those recorded in previous years, a fact which indicates that lake’s tro- phic state did not change. But in the past ten years, agricultural uses have been modified by almost 25% of the catch- ment area, because of the major reduction of tobacco cultivation. One year of monthly monitoring, in nine sampling stations can report this result. Even if the catchment is small and the agricultural areas are the 47% of the basin, the wa- ter quality of the lake did not change. The trophic state is stable probably because the lake is deep monomictic, and seasonally anoxic. For this reason internal phosphorus contribution is very important in the deep hypolimnion.
Keywords: Trophic State; TSI; Dissolved Oxygen; Anoxia; Lake Amvrakia; Greece
1. Introduction
The state and evolution of freshwater ecosystems are affected by a variety of biotic and abiotic factors, as well as by natural and human-induced processes that may differ both in duration and intensity [1]. Lakes and rivers have important multi usage components, such as sources of drinking water, irrigation, fishery and energy produc- tion [2]. The 20th century was marked by significant changes in land use throughout the world. One of the prominent anthropogenic changes was the alteration of nitrogen and phosphorus fluxes to ecosystems [3]. In many parts of the world lake water quality has not im-proved consequently [4,5].
Eutrophication of natural and artificial lakes is a major environmental problem. It involves a change in lake sta- tus from a macrophyte-dominated clear water state to a phytoplankton-dominated turbid state, with detrimental effects to the ecosystem [6]. Phosphorus is a key limiting nutrient in freshwater aquatic ecosystems. In a pheno- menon known as internal nutrient loading, nitrogen and phosphorus released into bottom waters during anaerobic conditions exacerbate eutrophication when they diffuse or mix into surface waters and stimulate phytoplankton
productivity [7].
Dissolved oxygen in the lake is one of the most im- portant parameters because many physical and bio- chemical processes are controlled by it [8]. Increasingly eutrophic lakes are commonly characterised by seasonal low oxygen stress. Hypoxia and anoxia develop when oxygen consumption exceeds supply, as a result of two major factors, respiration and decomposition [9]. Severe hypoxia is defined as a threshold below which significant impacts on the biota can be observed and corresponds to dissolve oxygen concentrations below 2 mg·L−1 [10,11].
Thermal stratification adversely influences the uniform oxygen distribution in the lake water column, resulting in anoxic conditions and anaerobic processes in the deeper layers. Nutrients, produced near the bottom from decom- position of organic matter, cannot be used by organisms at the surface layers, unless water turn over, takes place in the fall [12].
states of lakes and reservoirs under nutrient-limiting and non nutrient-limited conditions. Algal biomass can be estimated independently by chlorophyll pigment concen- trations, Secchi depth and total phosphorus concentra- tions. TSI values of <30 are common among lakes of classical oligotrophy and from 50 to 70 correspond to classical eutrophy. Hypereutrophic conditions are com- mon at TSI values of >70. To use the index for classify- ing lakes requires that a single number be generated that adequately reflects the trophic status of the lake.
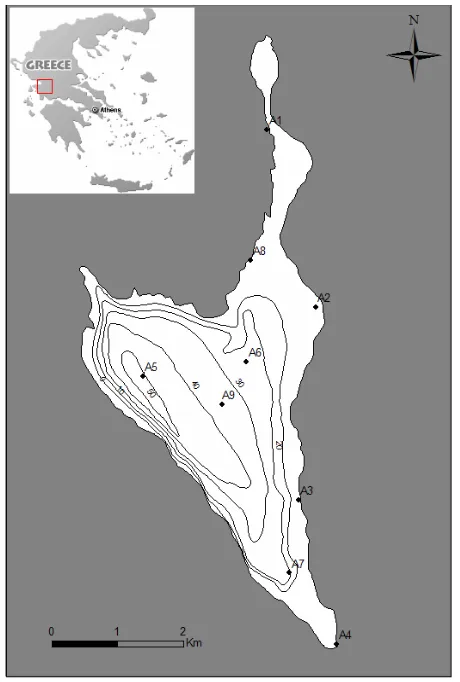
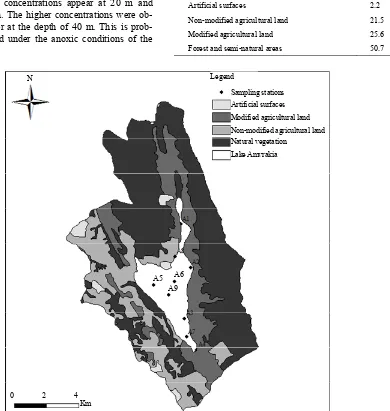
Lake Amvrakia (Figure 1) is a deep warm monomictic and sulphate lake in Western Greece [14]. Its surface is 12 Km2 and the drainage basin amounts to 121 Km2.
[image:2.595.58.288.369.710.2]Amvrakia is a triangularly shaped lake of tectonic origin, karstic, of semipolje type formed from deposits of Mesozoic limestone and belongs to the sulphate type, caused apparently by outcrops of gypsum in the karstic environment of the lake [15,16]. The surface area has been significantly reduced due to a prolonged drought and draining of the northern shallow part of the basin. The water level undergoes yearly fluctuations and de- pends on evaporation during summer, possible under- ground inlets, invisible discharges and use of water for
Figure 1. Map of the study area (Lake Amvrakia), location of the sampling stations (depth in meters).
agricultural purposes. The east coast is intensively culti- vated up to only few meters away from the water edge and serves as pasture land for sheep.
Lake Amvrakia is considered to be the last and deepest remains of a big lake or lagoon, situated in the same tec- tonic depression or on the depression’s outer limits. The large lake, by various forces, was split into small lakes, one of which represents the present Amvrakia Lake. Its physical, chemical and biological parameters (tempera- ture, dissolved oxygen, conductivity, pH, total phosphor- rus, total nitrogen, phosphate, nitrate, nitrite) have been documented in the past [14,15,17,18].
Until recently, the main cultivation around the lake was tobacco. Tobacco cultivation develops in low fertile- ity soil in mountainous or semi-mountainous regions. It was developed in the prefecture of Aitoloakarnania at the end of the 19th century. The prefecture has been the
country’s major producing area of tobacco. The city of Agrinio cultivated its own distinct type of tobacco. However, from 1/1/2006, with the Common Agricultural Policy (CAP) reform in relation to tobacco cultivation, the tobacco production has a significant reduction of about 80% in Greece and, specifically, 100% reduction in the prefecture of Aitoloakarnania. As a result, tobacco producers turned to other cultivations such as vegetables, olives, corn, aromatic plants and biological cultivations.
The aim of this study is to assess the trend of the tro- phic status of Lake Amvrakia by describing the physical and chemical parameters and also to describe the devel- opment, seasonality and evolution of hypoxia/anoxia in the lake. This work also aims to estimate if the land use changes, affected the trophic status of the lake the last years.
2. Materials and Methods
2.1. Study Area and Sampling Strategy
The monitoring period lasted for one year (March 2007 - February 2008). Nine sampling stations were selected according to land uses around the lake (Figure 1). Five stations were in the littoral zone (A1, A2, A3, A4, A8) and samples were taken from surface and four stations were in the pelagic zone (A5, A6, A7, A9) and samples were taken from surface and maximum depth of each station. The concentrations of total phosphorus and total nitrogen as well as phosphate, nitrate, nitrite and sulfate were measured. Physicochemical parameters such as tem- perature, pH, dissolved oxygen, conductivity and redox potential as well as their temporal and spatial distribu- tions were also measured in situ.
2.2. Physicochemical Parameters
da) was used during the whole sampling period for the measurement of the physicochemical parameters. In par- ticular, temperature, dissolved oxygen, conductivity, pH and redox potential were measured monthly directly at the sampling stations A1 (0 m), A2 (0 m), A3 (0 m), A4 (0 m), A8 (0 m) in the littoral zone as well as at stations A5 (0 - 40 m), A6 (0 - 20 m), A7 (0 - 20 m) and A9 (0 - 30 m) in the pelagic zone.
2.3. Analytical Techniques
To analyze total nitrogen and total phosphorus, samples were digested with peroxodisulfate digestion procedure to convert the various forms of nitrogen and phosphorus into nitrate and dissolved orthophosphate respectively.
For the measurement of total nitrogen, we added po- tassium peroxodisulfate and sodium hydroxide in 10 mL of sample. Then we put them in a thermoreactor for 60 min at 120˚C. Next in a solution acidified with sulfuric and phosphoric acid, we added 1 mL of the sample and 1 mL 2,6-dimethylphenol (DMP) to form 4-nitro-2, 6-di- methylphenol that is determined photometrically at 340nm at a Perkin Elmer Lamda 35 UV-Vis with quartz cuvettes of 1cm.
For the measurement of total phosphorus, we added sulfuric acid and potassium peroxodisulfate in 10 mL of sample. Then we put them in a thermoreactor for 60 min at 120˚C. In sulfuric solution orthophosphate ions react with molybdate ions to form molybdophosphoric acid. Next we added ascorbic acid that reduces this to phos- phomolybdenum blue (PMB) that is determined pho- tometrically at 880nm at a Perkin Elmer Lamda 25 UV- Vis with quartz cuvettes of 5 cm.
For the measurement of nitrate, nitrite, phosphate and sulfate we made a calibration curve using a standard so- lution that contained seven anions. According to that curve we determined the ions that were detected in each sample with a Dionex ICS-1500 ion chromatograph equipped with a Dionex AS9-HC separation column, a Dionex AG9-HC guard column and a Dionex ASRS conductivity suppressor. The eluent we used was 9 mM Na2CO3 at a flow rate of 1.0 ml·min−1.
Water samples for sulfide (S−2) measurements were
always the first taken from the sampling bottle immedi- ately after the sampler was back on board, taking special care to obtain samples with minimum aeration. To pre- serve samples for total sulfide determination, zinc acetate and sodium hydroxide solutions were put into the bottles before filling them with sample. Four drops of 2N zinc acetate solution per 100 mL sample were used, while the final pH was always at least 9. The bottles were always filled completely and caped immediately. Water samples for sulfide analyses were measured unfiltered and freshly within 24 h using the iodometric method (Standard
Methods 4500 - S−2 F).
2.4. Trophic State Index (TSI)
As mentioned above, the trophic state index is a useful tool for assessing the lake’s status. The actual equations to compute TSI were derived from a data set of 60 to 150 northern natural lakes [13]. TSI is calibrated so that an increase in phosphorus concentration corresponds to an increase of algae amount and a decrease of transparency.
Trophic state index can be computed from Secchi disk transparency, chlorophyll-a and total phosphorus accord- ing to the following equations:
TSI of transparency = 60 14.41 ln transparency (1)
TSI of chlorophyll-a = 30.6 + 9.81 ln Chl (2)
TSI of phosphorus = 4.15 + 14.42 ln TP (3)
where Chl = chlorophyll-a pigment concentrations (mg·m−3)
and TP = total phosphorus concentrations (mg·m−3).
2.5. Chlorophyll-a
Water samples (1.5 L) were filtered and the filter was placed into a 50 mL falcon. 10 mL of acetone were added into the falcon and the filter was pulped and put into the fridge for 20 - 22 hours. Then, the filter was cen- trifuged for 10 minutes at 2000 rev. The extract was de- termined photometrically at 750 nm, 664 nm, 647 nm and 630 nm. The chlorophyll-a concentration in the ex- tract was calculated according to the following equation:
(Chl-a )
C 11.85* OD664
1.54* OD647 0.08* OD630
(4)where C(Chl-a) is chlorophyll-a concentration (mg·L−1) and
OD664, OD647, OD630 are the corrected visual density. The concentration per volume unit was calculated with the following equation:
3
Cchl-a*extract volumeChlorophyll-a mg*m
sample volume
(5)
3. Results and Discussion
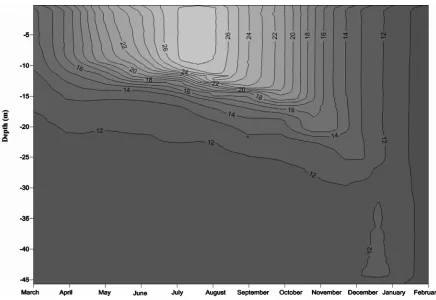
The vertical distribution of physicochemical parameters measured from March 2007 until February 2008 in the sampling station (A5) of Lake Amvrakia is shown in
Figures 2-4. This station is located in the deepest part (45 m) of the lake and is considered to be the most rep- resentative for the changes monitored along the entire water column of the lake. All the physicochemical pa- rameters were measured the entire monitoring period but only those that present a significant seasonal variation
ill be discussed. w
Figure 2. Monthly variation of temperature in Lake Amvrakia (2007-2008) from the station A5.
Figure 4. Monthly variation of redox potential in Lake Amvrakia (2007-2008 from the station A5).
3.1. Temperature
Lake Amvrakia is a deep warm monomictic lake and circulates freely once a year. Stratification of the lake started in March and from this time the thermocline (10 - 20 m) remained stable until November. Temperatures varied from 14.02˚C to 27.11˚C in surface and 11.31˚C to 11.84˚C, in the hypolimnion. Turnover started to ap- pear in December where the metalimnetic thermocline sinks to about 25 m and this gradual cooling of the water column lasted until the end of February. During turnover, temperature had a uniform distribution from surface to bottom of the lake (Figure 2).
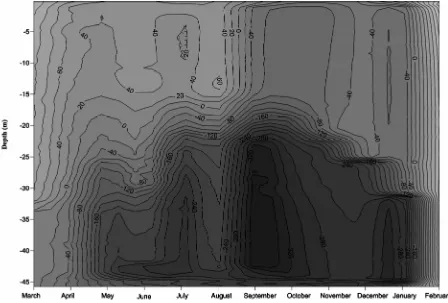
3.2. Dissolved Oxygen
Dissolved oxygen is reduced with depth throughout the whole monitoring period. Anoxic conditions occurred in hypolimnion just at the time that stratification began. Loss of oxygen from the hypolimnion results primarily from biological oxidation of organic matter in the water and at the sediment-water interface, where bacterial de- composition is greater. Only in March 2007 oxygen con- centrations were above 0.8 mg·L−1 in hypolimnion (Fig-
ure 3). During summer the highest values were observed in metalimnion and varied from 15.6 mg·L−1 to 16 mg·L−1,
as a result of oxygen produced by algal populations that develop more rapidly than they sink out of the lower wa-
ter strata. The same distribution was observed during autumn and winter, with anoxic conditions dominating in hypolimnion. During turnover, oxygen-saturated water extends deeper into the hypolimnion and when circula- tion is complete, oxygen concentrations remain at satura- tion in accordance with solubilities at existing tempera- tures.
Due to technical problems with the sensor of dissolved oxygen, there are no measurements for February 2008. Despite that and according to the temperature and redox (ORP) measurements (Figure 4), it is assumed that hy- polimnion is not anoxic during February (Figure 3). In particular, during turnover with progressive deepening of the epilimnion, the circulation of oxygen saturated water extends deeper in the hypolimnion. Also, redox potential values remain positive as long as some dissolved oxygen is present in the water and February is the only month that redox potential is positive at the entire water column.
3.3. ORP
due to that dissolved oxygen has a very high affinity for electrons (e−). In particular, during spring values above
zero were observed in the epilimnion and metalimnion and then reduced below zero. The lowest values were observed during September. The same distribution was observed in summer with negative redox potential below 15 m. During the period September-January values of redox potential are negative from surface to bottom and decline with depth. Only February values are positive towards the entire water column (Figure 4). This is a reason why we believe that hypolimnion is not anoxic during this month.
3.4. Transparency
Secchi disk transparency is one of the simplest meas- urements to determine lake’s trophic status. According to Carlson (1977) Secchi disk values greater than 8 m cor- respond to oligotrophic lakes while values less than 2 m correspond to eutrophic lakes. In Amvrakia lake Secchi disk values ranged from 3.5 m to 9 m the whole moni- toring period. Lower transparency values were observed at station A7 while higher transparency values were ob- served at station A5 and A6. Low transparency values were observed from April until July, then increased until October with transparency values of up to 9 m and then diminished. This phenomenon is due probably because of the turbidity created by the annual autumn-winter runoff.
3.5. Chlorophyll-a
Chlorophyll-a concentrations at station A5 varied during the whole monitoring period with concentrations varied from 0.2 mg·m−3 to 4.6 mg·m−3. The highest concentra-
tions were observed during August (11.4 - 12.1 mg·m−3).
According to chlorophyll-a lake classification, chlorophyll- a concentrations lower than 1 mg·m−3 corresponds to oli-
gotrophic lakes while concentrations greater than 20 mg·m−3 correspond to eutrophic lakes [13].
3.6. Chemical Parameters
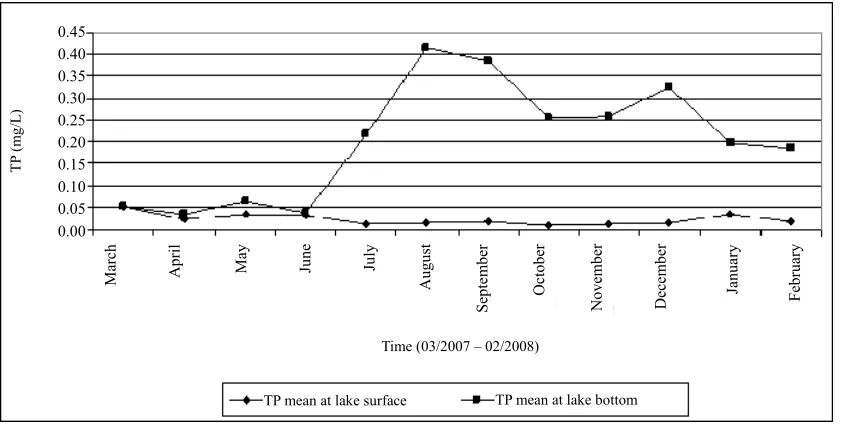
Total phosphorus concentrations did not show a signifi- cant variation throughout the whole monitoring period, with very low concentrations observed in the surface samples. In Figure 5, we observed that the mean surface water TP concentrations are very low in contrast with the mean bottom water concentrations. The reason for this is the production of phosphorus from the bottom sediment. This is the result of seasonally anoxia created in the hypolimnion from late summer until late winter. An out- come of this is the increase of concentration of total phosphorus in the entire water column after the February mixing. We believe that high internal phosphorus con- tribution, is the reason for the stabilization of the phos- phorus concentration during the last years.
Total nitrogen concentrations show a significant spa- tial and temporal variation and ranged from 0.02 mg·L−1
to 1.3 mg·L−1 with a mean value of 0.5 mg·L−1 during the
whole monitoring period. The lowest value was observed in station A2 in November and the highest value was observed in station A5 in July. Nitrate values ranged in the whole monitoring period with the lower value ob- served in August (0.01 mg·L−1) and the higher values
observed in September and October (up to 0.68 mg·L−1)
due to high rainfall events. The possible reason for this is the fast drainage because of the small catchment, the high slopes and the recharge occurring with the first rainfall events after a prolonged dry period (in which
0.45 0.40 0.35 0.30 0.25 0.20 0.15 0.10 0.05 0.00
Time (03/2007 – 02/2008)
TP mean at lake surface TP mean at lake bottom
TP
(
m
g/
L)
March April May June July Augus
t
Septem
be
r
Octobe
r
Novem
be
r
Dece
mbe
r
Januar
y
Febr
uar
[image:6.595.90.514.508.720.2]y
fertilizers application took place in the catchment area). Nitrite concentrations did not show significant variation and ranged from 0.01 mg·L−1 to 0.18 mg·L−1.
Sulfate values show a significant temporal and spatial variation throughout the monitoring period. Sulfate con centrations ranged from 87 mg·L−1 to 765 mg·L−1 with an
average value of 412 mg·L−1. The lower values were ob-
served mainly at the northern part of the lake during spring and summer and increased after September. Higher values were observed at the main body of the lake. The reason for these high sulfate concentrations is that Lake Amvrakia belongs to the sulphate type of lakes, caused by the presence of gypsum at the lake’s bottom.
Sulfide concentrations were detected mainly at the bot- tom layer of Amvrakia Lake below 20 m. They ranged from 0.2 mg·L−1 to 8.08 mg·L−1, with the lower values
observed in July. According to the vertical distribution, in general, sulfide concentrations appear at 20 m and increase with depth. The higher concentrations were ob- served in December at the depth of 40 m. This is prob- able H2S developed under the anoxic conditions of the
hypolimnion.
[image:7.595.135.525.294.705.2]3.7. Land Use Change
Table 1 shows the area of land uses in drainage basin in 2007 (Figure 6). The data from for this table is estimated from the Greek land use maps of 1985, satellite images and the field work of our survey in 2007. It is obvious that agricultural uses have been modified significantly by 25.6% of the catchment area. This is mostly happening because of the tobacco cultivation reduction. In the past ten years most of the tobacco fields are not being used. The result of this practice is the limitation of fertilizers entering into the lake from runoff or groundwater dis- charge. In Figure 6 we can see the areas that have mostly
Table 1. Land use areas (%) in Lake Amvrakia drainage basin in 2007.
Land use 2007
Artificial surfaces 2.2 Non-modified agricultural land 21.5 Modified agricultural land 25.6 Forest and semi-natural areas 50.7
N Legend
Sampling stations Artificial surfaces Modified agricultural land Non-modified agricultural land Natural vegetation
Lake Amvrakia
A5 A6
A9
0 2 4 Km
Figure 6. Map of recent land uses of Lake Amvrakia catchment. Modified agriculture, is the tobacco cultivation, which hanged in the last 10 years. Non-modified is the olive trees cultivation which still exists in the area.
c
changed in the eastern part of the lake and close to the coastline. The non-modified agricultural areas are the olive tree cultivations, which still exist in the basin.
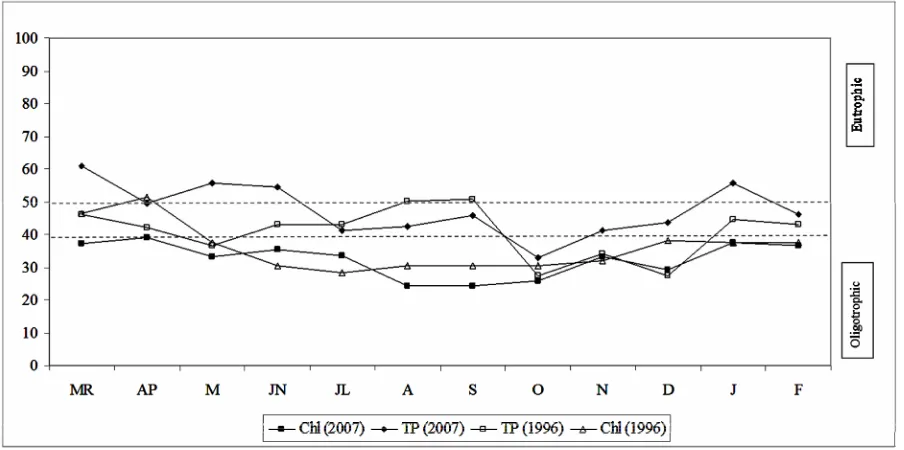
[image:8.595.73.525.484.709.2]3.8. Trophic State Index (TSI)
Figure 7 demonstrates the Trophic State Index (TSI) of Lake Amvrakia. It can be seen that Amvrakia is classi- fied as mesotrophic to eutrophic, according to TP meas- urements and as mesotrophic according to transparency and chlorophyll-a measurements. All values are above zero and suggest increasing possibility of P limitation. According to Danielidis et al. [14] Amvrakia is classified
as oligotrophic to mesotrophic lake with regard to abso- lute total nitrogen and phosphorus values, but as far as it concerns the trophic state index, lake Amvrakia is classi- fies as mesotrophic. After the recent land use change around Lake Amvrakia and according to the measure- ments in this study, it is obvious that phosphorus concen- trations did not change significantly.
4. Conclusions
Lake Amvrakia has been documented mainly the period where the main cultivation around the lake was tobacco. After the removal of tobacco, there are no measurements about the current trophic status of the lake. This study aims to describe the development, seasonality and evolu- tion of hypoxia/anoxia in the lake and also aims to esti- mate if there is a change in the trophic status during the last years. Anoxia was the main characteristic of hypo- limnion during stratification but oxygen saturation values were recorded in the entire water column during turnover
and early stratification [14]. In this study anoxic condi- tions dominated in hypolimnion during the entire moni- toring period except March 2007 and February 2008 where we assume that because of turnover, oxygen val- ues were above 0 mg·L−1. As a result, Lake Amvrakia is
not permanently anoxic but seasonally anoxic, and the turnover takes place during February-March.
In general, it can be noticed that dissolved oxygen is decreased with depth. Only in February, that the entire water column is mixed, the hypolimnion is not anoxic. The low oxygen concentrations in hypolimnion are a characteristic of eutrophic lakes. Lake Amvrakia is not eutrophic but exhibits hypoxia because of its great depth and not of its trophic status. Total phosphorus concentra- tions that were recorded in previous studies were gener- ally at the same values as in our study. Lake Amvrakia is characterized as mesotrophic. The trophic state is stable probably because the lake is monomictic, and seasonally anoxic. For this reason internal phosphorus contribution is very important in the deep hypolimnion. The winter mixing contributes large amounts of phosphorus in the water column and the lake cannot change its trophic status.
Total nitrogen concentrations were generally similar as the previous studies and the same was observed for ni- trate and nitrite concentrations. Sulfate concentrations measured in this study were also similar with those meas- ured in Koussouris [19] and did not show any significant changes.
Twenty years ago [14], the lake was mesotrophic, while in our days its status remains the same. The trophic state did not change in the lake, even if the land uses
have change by almost 25% in the catchment (Figure 7). In our view the trophic state is stable because the lake is monomictic and seasonally anoxic. Internal phosphorus contribution is the reason for the stabilization of the phos- phorus concentration.
REFERENCES
[1] I. Kagalou, E. Papastergiadou and I. Leonardos, “Long Term Changes in the Eutrophication Process in a Shallow Mediterranean Lake Ecosystem of W. Greece: Response after the Reduction of External Load,” Journal of Envi-
ronmental Management, Vol. 87, No. 3, 2008, pp. 497-
506. doi:10.1016/j.jenvman.2007.01.039
[2] C. F. Iscen, Ö. Emiroglu, S. Ilhan, N. Arslan, V. Yilmaz and S. Ahiska, “Application of Multivariate Statistical Techniques in the Assessment of Surface Water Quality in Uluabat Lake, Turkey,” Environmental Monitoring and
Assessment, Vol. 144, No. 1-3, 2008, pp. 269-276.
doi:10.1007/s10661-007-9989-3
[3] O. A. Yunev, J. Carstensen, S. Moncheva, A. Khaliulin, G. Ertebjerg and S. Nixon, “Nutrient and Phytoplankton Trends on the Western Black Sea Shelf in Response to Cultural Eutrophication and Climate Changes,” Estuarine,
Coastal and Shelf Science, Vol. 74, No. 1-2, 2007, pp.
63-76. doi:10.1016/j.ecss.2007.03.030
[4] O. Anneville and J. P. Pelletier, “Recovery of Lake Ge- neva from Eutrophication: Quantitative Response of Phy- toplankton,” Archiv für Hydrobiologie, Vol. 148, No. 4, 2000, pp. 607-624.
[5] S. Rekolainen, S. Mitikka, J. Vuorenmaa and M. Johans- son, “Rapid Decline of Dissolved Nitrogen in Finnish Lakes,” Journal of Hydrology, Vol. 304, No. 1-4, 2005, pp. 94-102. doi:10.1016/j.jhydrol.2004.07.024
[6] R. Portielje and D. T. Van der Molen, “Relationships between Eutrophication Variables: From Nutrient Load- ing to Transparency,” Hydrobiologia, Vol. 408-409, 1999, pp. 375-387. doi:10.1023/A:1017090931476
[7] E. B. Welch and J. M. Jacoby, “On Determining the Prin- ciple Source of Phosphorus Causing Summer Algal Blooms in western Washington lakes,” Lake and Reser-
voir Management, Vol. 17, No. 1, 2001, pp. 55-65.
doi:10.1080/07438140109353973
[8] E. Komatsu, T. Fukushima and H. Shiraishia, “Modeling of P-Dynamics and Algal Growth in a Stratified Reser- voir—Mechanisms of P-Cycle in Water and Interaction between Overlying Water and Sediment,” Ecological
Modelling, Vol. 197, No. 3-4, 2006, pp. 331-349.
doi:10.1016/j.ecolmodel.2006.03.023
[9] J. M. Burkholder, “Eutrophication and Oligotrophica- tion,” Encyclopedia of Biodiversity, Vol. 2, 2001, pp. 649-670. doi:10.1016/B0-12-226865-2/00113-9
[10] R. J. Diaz and R. Rosenberg, “Marine Benthic Hypoxia: A Review of Its Ecological Effects and the Behavioral Responses of Benthic Macrofauna,” Oceanography and
Marine Biology, An Annual Review, Vol. 33, 1995, pp.
245-303.
[11] N. N. Rabalais, R. E. Turner and W. J. Wiseman, “Hy- poxia in the Gulf of Mexico,” Journal of Environmental
Quality, Vol. 30, No. 2, 2001, pp. 320-329.
doi:10.2134/jeq2001.302320x
[12] G. D. Gikas, V. A. Tsihrintzis, C. S. Akratos and G. Hara- lambidis, “Water Quality Trends in Polyphytos Reservoir, Aliakmon River, Greece,” Environmental Monitoring and
Assessment, Vol. 149, No. 1, 2009, pp. 163-181.
doi:10.1007/s10661-008-0191-z
[13] R. E. Carlson, “A Trophic State Index for Lakes,” Lim-
nology and Oceanography, Vol. 22, No. 2, 1977, pp.
361-369. doi:10.4319/lo.1977.22.2.0361
[14] D. B. Danielidis, M. Spartinou and A. Economou-Amilli, “Limnological Survey of Lake Amvrakia, Western Greece,”
Hydrobiologia, Vol. 318, No. 3, 1996, pp. 207-218.
doi:10.1007/BF00016682
[15] J. Overbeck, K. Anagnostidis and A. Economou-Amilli, “A Limnological Survey of Three Greek Lakes: Trichonis, Lyssimachia and Amvrakia,” Archiv für Hydrobiologie, Vol. 95, No. 1, 1982, pp. 365-394.
[16] S. Verginis and S. Leontaris, “Contributions to the Mor- phology and Development of the Semipolje Lake Am- vrakia (Limni Amvrakia), Western Greece,” Internation-
ale Revue der gesamten Hydrobiologie und Hydrographie,
Vol. 63, No. 6, 1978, pp. 831-839. doi:10.1002/iroh.19780630615
[17] T. Koussouris and G. Photis, “Some Hydrobiological Cha- racteristics in Amvrakia Lake, Western Greece,” Acta
Hydrobiologica, Vol. 22, No. 3, 1980, pp. 337-344.
[18] I. Zacharias, I. Bertachas, N. Skoulikidis and T. Koussouris, “Greek Lakes: Limnological Overview,” Lakes & Reser-
voirs: Research and Management, Vol. 7, No. 1, 2002, pp.
55-62. doi:10.1046/j.1440-1770.2002.00171.x
[19] T. Koussouris, “The Water in Nature, in Development in Environmental Protection,” In: T. Koussouris, Monographs
![catena Poly[[bis(p toluenesulfonato κO)palladium(II)]bis(μ 1,3 di 4 pyridylpropane κ2N:N′)]](data:image/gif;base64,R0lGODlhAQABAIAAAP///wAAACH5BAEAAAAALAAAAAABAAEAAAICRAEAOw==)