Munich Personal RePEc Archive
Intangible investment and technical
efficiency: The case of software-intensive
manufacturing firms in Turkey
Fındık, Derya and Tansel, Aysit
Middle East Technical University, Institute for the Study of Labor,
Economic Research Forum
5 August 2013
Online at
https://mpra.ub.uni-muenchen.de/65955/
Intangible Investment and Technical Efficiency:
The Case of Software-Intensive Manufacturing Firms in Turkey
1Derya Findik
Science and Technology Policy Studies Program Middle East Technical University
06800 Ankara, Turkey E-mail: dfindik@metu.edu.tr
Telephone:90.312.210 37 19 Fax: 90.312. 210 79 93
Aysit Tansel
Cornell University, Ithaca, USA
Middle East Technical University, Ankara, Turkey E-mail: atansel@metu.edu.tr
Telephone: 90.312.210 20 57 Fax : 90.312.210 79 64
Institute for the Study of labor (IZA) Bonn, Germany and Economic Research Forum (ERF) Cairo, Egypt
August, 2014
Abstract. This chapter analyzes the effect of intangible investment on firm efficiency with an emphasis on its software component. Stochastic production frontier approach is used to simultaneously estimate the production function and the determinants of technical efficiency in the software intensive manufacturing firms in Turkey for the period 2003-2007. Firms are classified based on the technology group. High technology and low technology firms are estimated separately in order to reveal differentials in their firm efficiency. The results show that the effect of software investment on firm efficiency is larger in high technology firms which operate in areas such as chemicals, electricity, and machinery as compared to that of the low technology firms which operate in areas such as textiles, food, paper, and unclassified manufacturing. Further, among the high technology firms, the effect of the software investment is smaller than the effect of research and development personnel expenditure. This result shows that the presence of R&D personnel is more important than the software investment for software intensive manufacturing firms in Turkey.
Keywords: Intangible assets, Software investment, Efficiency, Software intensive firms, Stochastic frontier analysis, Production Function, Firms, Turkey.
JEL Classification: L21; L22; L23; L25
1This paper is based on Derya Findik’s PhD thesis prepared under the supervision of Prof. Dr.
Aysit Tansel at the Science and Technology Policy Studies Program, METU. Derya Findik would like to thank Erkan Erdil, Erol Çakmak, Semih Akçomak, and
INTRODUCTION
In recent years, the share of investment in intangible assets of the firms in manufacturing
industries increased in most of the EU countries while the share of investment in tangible
capital has decreased (Corrado,Haskel, Jona-Lasinio & Iommi, 2013). Intangible
investment is defined as “the claims on future benefits that do not have a physical or
financial embodiment”(Lev,2000). Many authors proposed different ways of classifying the
intangible assets (van Ark & Piatkowski, 2004; Young,1998; Vosselman,1998; MERITUM,
2002; Oliner, Sichel & Stiroh, 2008; Hulten & Hao, 2008; Cummins, 2005). A more recent
classification is proposed by Corrado, Hulten & Sichel (2009). According to him, there are
three main components of intangibles. These are computerized information, scientific and
creative property, and economic competencies. The computer software and computerized
databases are in the first group. The second group includes science and engineering R&D,
mineral exploration, copyrights and license costs, and other activities for product
development such as design and research. The third group emphasizes the “soft” part of the
intangible assets, such as brand equity, firm specific human capital, and organizational
structure.
Studies that focus on the link between intangible investments and productivity found that
intangible investments increase the productivity (Oliner et al. 2008; Corrado et al. 2009,
Bosworth &Triplett, 2000; van Ark, Hao, Corrado & Hulten, 2009; Park & Ginarte, 1997).
However, there is little evidence on the effect of intangible investments on firm efficiency
(Becchetti, Bedoya & Paganetto, 2003). In this chapter, we analyze the effects of software
investment and R&D personnel expenditure which are components of intangible
investment on firm efficiency in Turkey. We consider the software intensive manufacturing
firms in Turkey for the period 2003-2007. We observed two main trends. First, the number
of firms making software investment decreased during the period investigated. Second,
firms which already make software investment became more software-intensive. The main
question asked is the increase in the intensity of software investment results in efficiency
gains for the Turkish manufacturing firms. We also included R&D personel expenditure as
another component of intangible investment in this chapter.
This chapter is organized as follows: Background section provides the review of literature
production function and the technical efficiency. In this chapter, we also provide an extant
review of literature on determinants of technical efficiency. The other section is devoted to
data and methodology. We, then discuss empirical results. The last section introduces
concluding remarks.
BACKGROUND
The 1970s marks the beginning of a period referred to as post-Fordist Era. This period is
characterized with a transition from manufacturing based economy to services based
economy. This change has resulted in a shift from tangible assets such as physical,
financial, and human to the intangible ones in the production process (Shapiro & Varian,
2013). The history of the concept of intangible investment dates back to Machlup (1962). He
conceived the knowledge as an intangible asset and emphasized the difficulties in isolating
the effects of intangible investment on the knowledge producing industries. Therefore, the
much of the concern with the intangible asset is related to their identification and the
measurement.
Intangible investment refers to investment in human capital such as education and
socialization activities (Webster,1999). Adams & Oleksak (2010) consider the intangible
assets such as the personal networks, reputation, or innovation capability and refer to them
as “invisible assets”. More recently, the definition of intangible assets is broadened to include software and databases, research and development activities, intellectual property
rights, human capital, and organizational structure.
Empirical studies that use intangible investment as a production factor increased since the
2000s. Jalava & Pohjola (2008) found the positive effect of intangible investment on Finnish
economy by using non-financial business sector data and emphasized the increasing role of
the quality of the investment rather than the quantity in the economic growth. The positive
effect of intangible investment on economic growth is also observed in cross country studies.
Van ark et al.(2009) used the computerized information, innovative property, and economic
competencies to proxy the intangibles and found that the combined effect of these variables
accounts for a quarter of labour productivity growth in the US and several countries in the
EU. Park & Ginarte(1997) analyzed another component of the intangibles, namely
intellectual property rights (IPRs). They found that IPRs directly affect inputs such as
Other components of intangible investments received considerable attention in the
literature. The software investment as productive asset was not considered often (Basu &
Fernald, 2007). In recent years, this component became capitalized as an expenditure in
order to observe its contribution to GDP. According to Borgo, Goodridge, Haskel & Pesole
(2013) asset training, design, and software have the largest shares in knowledge spending
especially in the services sector in UK, while R&D has only a small share. Further,
Becchetti et al. (2003) found that software investment has a complementary effect on
skilled labour and increases both labour productivity and the firm efficiency. When ICT is
considered as a general purpose factor, ICT investment could also facilitate firm efficiency.
Castiglione & Infante (2014) have observed that positive effect of ICT on technical efficiency
of Italian firms manufacturing firms during the period 1995-2006. The effect of ICT on
technical efficiency is much stronger for the firms that make changes in their
organizational structure, that invest in research and development and that are open to
international markets. In a similar vein, Dimelis & Papaioannou (2014) examined the
diffusion of ICT in manufacturing and services sectors in EU for the period 1995-2005. In
their study, ICT variable is decomposed into three factors such as computing equipment,
communications’ equipment, and software. They found that software and communications equipment have a strong negative effect on technical efficiency and this effect remain
robust after controlling the degree of market regulation. Further, Berghall (2014) have
found that new ICT technologies improve the performance of Finnish industries that lag
behind the frontier. When industry and time effects are controlled for, ICT has a significant
effect on technical efficiency during the period 1986-2003 in Finnish industry.
MODEL
We use stochastic production frontier approach to simultaneously estimate the production
function and the determinants of technical efficiency. The stochastic frontier model with
panel data specification is given by
it x kit it
y
x
(1)it Vit Uit
(2)1,...,
t
T
i
1, 2,...,
N
0 it
Whereyitand xkitare the output and the vector of inputs of firm i at time
t
.
is the vectorof unknown parameters, Vit and Uitare independent, unobservable random variables.
Accordingly, Vitindicates statistical noise which is normally distributed with mean zero and
variance 2 v
and the 2 u
. Uitis the non-negative random variable associated with technicalinefficiency and it is allowed to vary over time. Uitcan be described as:
exp
(
)
it it
U
n t T
U
(4)Where nit is an unknown parameter to be estimated and Uit are independent and
identically distributed non-negative random variables.
Production Function
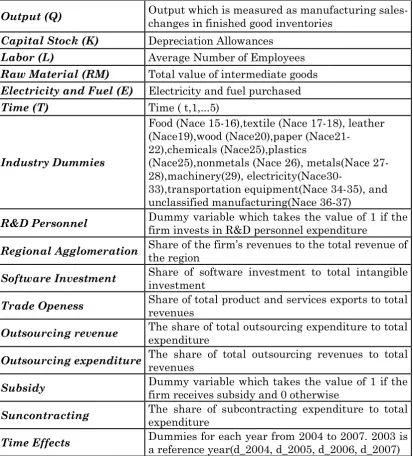
In this study, four types of variables are used to estimate production function which is in
translog form. These are capital, labor, raw material, and energy. Table 6 displays the
variable definitions.
2 2 2 2 2
0 1 2 3 4 5 6 7 8 9 10
11 12 13 14 15 16
ln ln( ) ln( ) ln( ) ln( ) ln( ) ln( ) ln( ) ln( )
ln( ) ln( ) ln( ) ln( ) ln( ) ln( ) ln( ) ln( ) ln( ) ln( ) l
it it it it it it it it it
it it it it it it it it it it
Y t t K L RM E K E L RM
K L K RM K E L RM L E
17 18 19 20
n( ) ln( )
ln( ) ln( ) ln( ) ln( )
it it
it it it it it it
RM E
K t E t RM t L t v u
1,...,
t
T
i
1,...,
N
(5)Where Yit is the real output firm i in year t, Kit is the capital stock measured by
depreciation allowances in year t, Eitis the electricity and fuel purchased by firm i in year t,
it
RM is the total value of intermediate goods used in the production of inputs by firm i in
year t. Time variable indicates technological change.vitindicates random errors that are
independently and identically distributed with 2
(0, v)
N
anduitrepresents technicalinefficiency term following normal distribution with mean
it and variance 2 u
.Capital stock variable is created based on the Perpetual Inventory Method (PIM). In the
Eq.(6) below, Kt represents the capitak stock at time t. Kt1 indicates initial capital stock,
assuming that there exists permanent growth at the sum of the industrial rate of growth
and the rate of depreciation.
1
(1 )
t t t
K d K I (6)
Nominal values of capital stocks are deflated by the corresponding sectoral producer price
indices at four digit. All variables in the production function are in the logarithmic form.
Technical Efficiency Function
Technical efficiency is defined as the distance of a firm from an efficient frontier (Battese &
Coelli, 1992). The efficiency of a firm consists of two components: technical efficiency and
allocative efficiency (Farrel, 1957). Technical efficiency indicates the ability of a firm to
obtain maximum output from a given set of inputs. A more specific definition belongs to
Koopmans (1951). Accordingly, a producer can be considered as technically efficient if the
increase in the output is achieved by the reduction in at least one other output or increase
in at least one input.
In this study, the inefficiency model is formed by including a list of explanatory variables
that are classified as firm specific variables in order to explain the firm efficiency denoted
by
it.0 1 2 3 4
5 6 7
/ Re &
Sec
it Tradeopenness Outsourcing Subcontracting gionalAgglomeration R DPersonnel
SoftwareInvestment TimeEffects torDummies
(7)
In Eq. (7),
0is the constant term which represents differences in production that cannot beexplained by firm specific variables. Trade openness is measured as the share of total
products and services exports to total revenues. Outsourcing is measured at two levels. The
first one is outsourcing expenditure which is defined as the share of outsourcing
expenditure to total expenditure. The second one is the outsourcing revenue which is
measured by the share of outsourcing revenues to total revenues. We added outsourcing
revenue, subcontracting expenditure and government subsidy in the estimation of low
technology firmsi. Subcontracting expenditure is measured by the share of subcontracting
firm received subsidy between 2003-2007. Regional agglomeration is measured as the share
of the firm’s revenues to the total revenue of the region. Research and development (R&D)
personnel is measured by dummy variable which takes the value of 1 if the firm invests in
R&D personnel expenditure and 0 otherwise. This variable is selected due to the
importance of qualified personnel for firms making software investment. Software
investment is measured as the share of software investment in total intangible investment.
Year and sector dummies are also included in the study in order to control for
heterogeneity.
EMPIRICAL LITERATURE ON DETERMINANTS OF TECHNICAL EFFICIENCY
There is an extensive literature on the determinants of technical efficiency (see, Table 1). In
this study, we focus on a part of those variables such as trade openness, outsourcing,
government subsidy, regional agglomeration, R&D personnel, and software investment.
Adding year effect is considered to be relevant because the time period in this study
corresponds to the period of privatization in Turkish telecommunication sector. Following
sections deal with the determinants of technical efficiency of Turkish software intensive
manufacturing firms.
Trade Openness
One of the determinants of technical efficiency is trade openness which indicates the
exporting activities of the firm. Production efficiency of firms that compete in international
market could be high because competition forces firms to allocate resources more efficiently,
to exploit scale economies, and to improve their technology (Balassa,1978; Feder,1983;
Ram,1985; Bodman,1996).
The positive effect of export on firm efficiency is found by Aw & Batra,1998; Sun, Hone &
Doucouliago,1999; Piesse & Thirtle, 2000; Gumbau-Albert & Maudos,2002; Delgado,
Farinas & Ruano, 2002, Hossain & Karunaratne,2004. Negative effect is found by
(Grether,1999) or no relation is observed by (Alvarez & Crespi,2003). Trade openness of the
economy explains regional and industrial variation in terms of efficiency in the case of
China (Sun et al., 1999). Economic reforms in China after 1980 targeted coastal regions,
therefore, the economy in those regions became much exposed to foreign trade that results
export share increased in the period of 1973-1992. Those years were also marked by the
reduction in protection under the North American Free Trade Agreement (NAFTA). This
generated two main effects on Canadian manufacturing firms. The first was to lose tariff
protection on some goods. The second was to gain tariff-free access to international product
markets. The ultimate effect of openness to international competition decreased inefficiency
of Canadian manufacturing firms (Bodman, 1996). In Taiwan, exporting activities had
positive effect on the productivity of the small and localized firms which did not invest in a
specific technology (Aw & Batra, 1998). This result indicates that there are some
unobservable factors such as managerial ability of the small firms that provide efficiency
gains.
The effect of the export share on technical efficiency of the firm, on the other hand,
increases at a decreasing rate and reaches a maximum point in Bangladesh (Hossain &
Karunaratne, 2004). When the export share is interacted with non-production labor, the
positive effect of export share becomes negative (Grether,1999). The reason for negative
effect of exports on efficiency could be explained by technological disparities between
domestic firms and foreign counterparts.
Outsourcing
Outsourcing is taken as another determinant of technical efficiency which indicates all
subcontracting relations between firms including hiring temporary labor. Transaction cost
approach elaborates the outsourcing activities in terms of cost reduction functionality
(Williamson, 1973). Firms can either outsource production activities or business related
services. Therefore, they can allocate the resources to the activities which provide
comparative advantage. As a result, firm can attract more highly skilled staff through
investment in its core competences.
Some part of the literature concerns with the effect of outsourcing on profitability and
productivity because outsourcing could produce significant differences in the quality of final
products and sales even if there is no change in the efficiencyii (Görzig & Stephan, 2002;
Lacity & Wilcocks, 1998; Gianelle & Tattara, 2009). In addition, the long term and short
term effect of outsourcing could be different from each other. Windrum, Reinstaller & Bull
The effect of outsourcing on firm efficiency is studied by Heshmati, 2003; Taymaz & Saatçi,
1997. They found the positive effect of outsourcing on firm efficiency. In fact, the effect of
outsourcing depends on the content of the outsourced activity. If non-productive activities
are outsourced, the effect of outsourcing on efficiency could be positive since outsourcing
decrease the costs of production. In addition, firm became much focused on the core fields
which results in increase in quality of the products. However, if there is a mismatch
between outsourcing firm and the external supplier in terms of organization of the work,
problems could emerge based on the quality concerns.
Government Subsidy
Firms in the developing countries mostly struggle with financial difficulties to sustain
themselves. Public subsidy programmes are developed to support those firms. In recent
years, this mechanism has become conditional on implementing innovative activities such
as producing a new product or a process.
The relation between subsidy and the firm efficiency could be negative. This implies that
subsidized firms are less efficient than their non-subsidized counterparts (Martin, John &
Page, 1983). Accordingly, government regulation which targets to reduce input and output
prices, encourages rent–seeking behaviour among entrepreneurs. In some cases, subsidies
go to firms that already conduct R&D activitiesiii, therefore, the positive effect of subsidy on
decision to innovate is not clearcut (González, Jaumandreu & Pazo, 2005). In this study, the
term subsidy is only included in the estimation of low technology manufacturing firms since
a considerable number of firms in this group are subsidized by the government.
Subcontracting
Subcontracting and outsourcing activities can be considered similar to each other. Both of
them reflects the provision of services by the external vendors. As for the case of
subcontracting, firm may have the required facilities to operate the activities but it prefers
to subcontract them. For the case of outsourcing, firm does not have in house production
capability of the activity and it depends on the external supplier (Van Mieghem, 1999).
Several studies analyzed the effect of subcontracting on the firm efficiency. The positive
effects as a result of subcontracting activity (Aoki, 1989; Lazonick, 1990; Burki &Terrel,
1998,Taymaz & Saatci, 1997).
Regional Agglomeration
Firms making software investment are included in this study. Although it could be
ambigious to classify them as “software firms”, allocating resources into the software component of the information and communication technologies (ICT) is an indication of
innovativeness (Bessen & Hunt, 2007). Therefore, the effect of location could be analyzed in
this frame. Geographical proximity could facilitate technological improvement,
competitiveness, market linkages and collaboration among firms through such mechanisms
as trust (Romijn & Albaladejo, 2002).Tacit knowledgeiv is facilitated by the trust between
firms in the same location. This situation eases the knowledge transfers from one
organization to another. The close interaction among firms clustered in a specific geography
reduces the risk and uncertainty towards adopting a new technology decreases.
Taking those considerations into account, expected effect of regional agglomeration on
efficiency is positive (Driffield & Munday,2001;Taymaz & Saatçi,1997). On the other hand,
efficiency benefits could decrease after some point that cities reach a certain population
(Mitra,1999). As the communication costs decline and the quality of interaction with the
partners outside the region increases, the positive effect of geographical proximity could
dissappear (Curran & Blackburn,1994).
R&D Personnel
In the efficiency literature, the effect of research and development (R&D) activities are
analyzed by using various proxies such as R&D capital intensity (Kumbhakar,
Ortega-Argiles, Potters, Vivarelli & Voigt, 2012) R&D capital stock (Wang, 2007), or R&D
expenditure (Perelman, 1995).
Regardless of how it is measured, R&D activities are intangible assets carrying the notion
of creative property. Therefore, the presence of R&D personnel which reflects the
absorptive capacity of the firm (Cohen & Levinthal,1989) is crucial especially for firms
operating in the capital intensive industries such as electiricity, machinery, and chemicals.
Based on this, the positive effect is expected for this variable (Dilling-Hansen, Madsen &
Liu,1994). There could be long term and short term effect of R&D activities. Dilling-
Hansen et al. (2003) emphasized that when the R&D activities of the firms are based on
basic research, its effect on firm performance emerges in the long run.
Software Investment
The effect of intangible investment on productivity has been studied only recently. Most of
the evidence belongs to developed countries (Corrado et al. 2013). To consider the effect of
ICT on productivity, the positive effect of computer networks is found (Atrostic & Nguyen,
2005). As for the comparison between US and Japan in terms of the effect of computer
networks, Japan lags behind the US. One possible reason is that complementary activities
such as innovation or process change is lower in Japan (Atrostic, Motohashi & Nguyen,
2008). In addition, complementarity could exist among the ICT components such as the
relation between information networks and business networks (Motohashi, 2007).
The effect of intangibles on economic growth or productivity in developing countries was not
investigated due to lack of data. In this study, we analyze the effect software component of
intangible investment on Turkish manufacturing firms for the years between 2003-2007 by
using information on software investment. In those years, there has been an increase in the
software investment intensity while there is no increase in the number of firms that make
that investment.
The motivation for using this variable is to investigate whether investing in software
component of ICT generates differential effect on the efficiency among software-intensive
firms. There are several studies on the effect of ICT (see, Table 2). Empirical evidence
establishes a positive link between ICT and technical efficiency (Brasini & Freo, 2012;
Castiglione,2012; Castiglione & Infante, 2014; Dimelis & Papaioannou, 2010; Berghall,
2014; Bechetti et al.2003; Lee & Barua,1999; Romero & Rodriguez, 2010; Repkine,2008;
Bertschek, Fryges & Kaiser, 2006; Criscuolo & Waldron, 2003; Rincon, Robinson & Vecchi,
2005). Milana & Zeli (2002) and Repkine (2009) have found no significant effect of ICT on
firm efficiency. Accordingly, ICT may not change the technology frontier for countries
having a high level of telecommunication investment.
Reforms in the telecommunication sector on a global scale were started in 1980s. Those
reforms include the directions such as commercialization of the telecom services,
involvement of private firms in the telecommunications sector, diversification in the service
supply, competition enhancing, and the elimination of government from the ownership
status (Wellenius & Stern, 1994). The United States and the United Kingdom are the two
countries that initiated the liberalization process in the telecommunications sector. British
Telecom was privatized by the act of Telecommunications in 1984 and the Office of
Telecommunications (Oftel), which was publicly funded and independent agency, was
established as a regulator of the sector. In the same year, under the state antimonopoly
ruling, AT&T, the largest American telecommunications company, was broken up into 7
regional companies. For both countries, the main motivation was to encourage competition
in the sector. The UK Government chose the duopoly policy because the presence of lots of
competitors in the sector might result in failure of the sector (Gabel & Pollard, 1995).
Therefore, Mercury Communications obtained license as a first competitor for the British
Telecom.
In the following years, privatization in the telecommunications sector spread throughout
the developing countries. The first move in the liberalization of telephony services in
Turkey dates back to 1994 when the Telsim and Turkcell operators made an agreement
with Telecom based on the revenue sharing and few years later, in 1998, they obtained the
licenses. By the end of 2003, the monopoly rights of the Turkish Telecom have abolished
which started the privatization process in the telecommunication sector. In the following
years, competition has become higher in mobile sector relative to fixed telephony or
broadband (Atiyas, 2011). We introduce year dummies for this period in order to investigate
the effect of privatization on efficiency in software-intensive firms for the years between
2003-2007.
Some writers consider that the creation of the competitive environment with the
privatization of the state monopoly enhances productive efficiency (Jha & Majumdar, 1999;
Ross, Beath & Goodhue, 1996; Bortolotti, D’Souza, Fantini & Megginson, 2002, Lam &
Shiu, 2010). From the economic development perspective, the main issue is based on
whether privatization generates inequity while it increases efficiency. Birdshall & Nellis
countries that experienced inefficiency and inequality in the distribution of the services,
conditions of failure in privatization were introduced in pre-privatization period such as
mismanagement of the privatization or low technical infrastructure.
DATA AND METHODOLOGY
In this study, five waves of the Structural Business Statistics of Turkey administered by
Turkish Statisical Institute (TURKSTAT) are used in order to analyze the effect of software
investment on firm efficiency. It includes the data from the year 2003 to 2007. The dataset
has detailed information on sales, revenues, and costs for each firm. First, 2003-2006
dataset was shared by TURKSTAT then 2007 wave was introduced as a single dataset. Two
datasets are merged with the help of the key dataset including the common id numbers for
the two waves, 2007 and 2003-2006 dataset. After deleting the duplicated observations,
17131 observations remained for each yearv. Only manufacturing firms are included in this
study, since measuring productivity in services sector is quite different from that of
production sectors. There are 45900 manufacturing firms in the dataset.
In this study, capital stock is proxied by depreciation allowances. Some observations of this
variable have zero values which indicates that those firms do not have any production
activities. Therefore, firms with no information on capital stock in any of the years are
removed from the sample. The same procedure is applied to the employment variable. Since
firms employing less than 20 workers are sampled, observations for micro firms are deleted.
Moreover, manufacturing industry revenues which are used to construct output variable is
cleaned of the zero observations. In this study, firms that do not invest in software are
excluded. A number of observations are also removed following the construction of the
variables. For instance observations which exceed 1 for the variable export share are
cleaned of the sample. Therefore the final sample includes 8450 observations.
We use OECD(1997) classification to group firms in terms of their technological
sophistication. Accordingly, firms operating in electronics, machinery, and chemicals are
high technology firms, while textiles, food, paper are low technology sectors. The distinction
between high technology and low technology firms are based on the R&D intensity. High
technology sectors are more R&D intensive while low technology industries are conceived
In this study, there are 2212 observations for the high technology firms. The number of
observations for low technology sectors are 4160. We aim to compare the effect of
production function variables and the effect of determinants of technical efficiency. For this
purpose, we discuss the estimation results for high technology and low technology
separately.
As for the methodology, stochastic frontier model with time varying efficiency is used in
this study. The advantage of using panel data in stochastic frontier production is that
inefficiency term and input levels do not have to be independent as cross section models
(Schmidt & Sickles, 1984). In addition, there is no need for distribution assumption for the
inefficiency effect. We assume the translog functional form since it does not impose any
prior restrictions on the production function unlike Cobb Douglas. The appropriateness of
translog form is tested by introducing Cobb Douglas for each estimation.
EMPIRICAL RESULTS
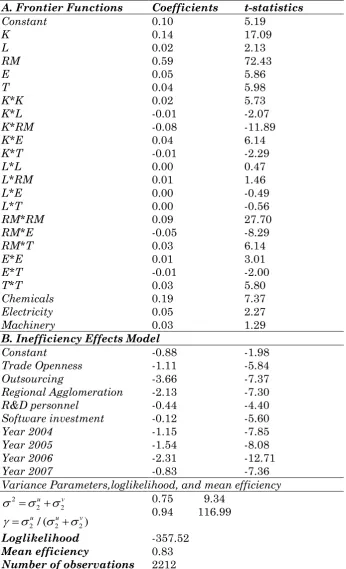
Table 3 reports the empirical results of the stochastic frontier and the determinants of
technical efficiency in high technology manufacturing firms for the period 2003-2007. High
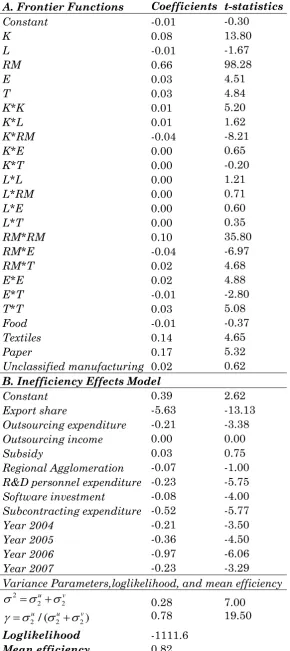
technology manufacturing sectors are named as “capital intensive sectors”. Table 4 shows
the empirical results of the stochastic frontier and the determinants of technical efficiency
in low technology manufacturing firms for the period 2003-2007. All models used in this
study have a panel characteristic. The advantage of using panel data in stochastic frontier
production is that inefficiency terms and input levels do not have to be independent as in
cross section models (Schmidt & Sickles, 1984). In addition, there is no need for
distributional assumption for the inefficiency effect. We assume the translog functional
form for the technology since it does not impose any prior restrictions on the production
function, unlike Cobb Douglas. In addition, for each model, the appropriateness of the
translog form is tested by introducing Cobb Douglas.
Each table is composed of two parts. The first part shows the frontier function variables,
which are output, capital stock, labor, raw material, and electricity and fuel. Taking the
heterogeneity issue into account, sector dummies are introduced in the production function.
openness, outsourcing, regional agglomeration, R&D personel, and software investment. All
these explanatory variables display sufficient variation regarding their distribution. This
model is time variant production frontier with year dummies that are introduced in both
production function and technical efficiency. All variables are in logarithmic form.
Starting with the variables in the frontier function, we expect a positive effect of capital
stock on output in high technology manufacturing firms. Therefore, increase in capital
intensity indicates the efficient use of machinery which results in overall increase in the
firm efficiency. The output increases with capital stock at 14 percent. The positive sign of
capital stock squared indicates that the effect of capital stock increases at an increasing
rate. As for the low technology manufacturing firms, the effect of capital stock on output is
positive and significant but lower than that of high technology sectors. The positive and
significant sign of the squared term shows that it increases at an increasing rate.
When the capital stock interacts with labor, raw material, electricity and fuel, the
coefficient gives negative, negative, and positive effect, respectively for the high technology
manufacturing firms. Interaction with labour is negative and insignificant whereas
interaction with raw material is negative and significant. Therefore, the existence of raw
material results in a decrease in the effect of capital stock on output. The interaction effect
with electricity and fuel, on the contrary, is positive, implying that these two inputs are
complementary. As for the low technology manufacturing firms, the interaction with labor,
raw material, electricity and fuel gives positive, negative, and positive effect, respectively.
Among these, only interaction of capital with the raw material gives significant result. This
indicates the same result with the high technology manufacturing firms. However, the
coefficient of the interaction term is lower for low technology manufacturing firms.
The effect of labor is also positive and significant with a small coefficient for high
technology manufacturing firms. In addition, the labor squared gives zero and insignificant
result. Interaction terms with other inputs do not give significant results. In contrast to
high technology sectors, labour has a negative effect on output. The positive sign of the
squared term of this variable indicates that the effect of labor decreases at an increasing
When the labour variable is interacted with the raw material, electricity and fuel
separately, the coefficients are positive for the high technology manufacturing firms.
However, those coefficients are not significant. Similar results are obtained for the low
technology manufacturing firms.
The coefficient of raw material has the highest share in comparison to other production
inputs for the high technology manufacturing firms. The effect of its square term gives
positive and significant result indicating that the use of raw material in the production
generates increasing effect on output. Examining the interaction of raw material with the
other input variables, the interaction with electricity and fuel has a negative and
significant effect on output. So, the presence of raw material results in a decrease in the
effect of electricity and fuel expenditure. As for the low technology manufacturing firms, the
effect of raw material is positive and significant and higher than that for high technology
manufacturing firms. Its square is also positive and significant indicating that the effect of
raw material on output increases at an increasing rate. The interaction with electricity and
fuels negative and significant. This implies the same result with the high technology
manufacturing firms.
The sign of electricity and fuel is positive and significant. The positive sign of the squared
term of this variable indicates that its effect on output increases at an increasing rate. As
for the low technology manufacturing firms, the sign of the electricity and fuel gives
positive and significant result and the positive sign of the squared term indicates that it
increases at an increasing rate.
The positive and significant effect of the time variable indicates that the mean technical
progress is 4 percent per year in high technology industry. When the time interacts with
capital stock, labor, raw material, electricity and fuel, the coefficient gives negative, zero,
positive, and negative effect, respectively. Among these, only the interaction of time with
raw material gives significant result, indicating that technical change is raw material
saving. As for the low technology manufacturing firms, the effect of time on output is
positive and significant as in the case of high technology sectors. However, the sign of the
Considering the variables in the inefficiency frontier function, we have trade openness,
outsourcing, regional agglomeration, R&D personnel, software investment, and year
dummies. The effect of trade openness is negative and significant, therefore, exporting
activities increase the technical efficiency of the firm. However, its effect is lower than that
of low technology sectors. This result indicates that export activities play a much more
crucial role in explaining technical efficiency for low technology firms. In 1996, quota
restrictions on exporting textile products to EU are abolished with the Customs Union
Agreement in Turkey. Export share of the country increased during the period investigated.
This result is in line with the cases of China (Sun et al., 1999); Hungary (Piesse &Thirtle,
2000), Spain (Gumbau-Albert & Maudos, 2002), and Chile (Tybout, De Melo & Corbo,1991).
We next consider the effect of outsourcing expenditure on technical efficiency. It has the
highest share in the technical efficiency estimation with a negative sign. As for the low
technology manufacturing firms, the effect of outsourcing expenditure on efficiency is
positive and significant. Its effect is higher than that for the high technology sectors which
indicates that outsourcing activities are more important in explaining the technical
efficiency in low technology sectors. This result is in line with Heshmati (2003) and Taymaz
& Saatci (1997). The positive effect of outsourcing on efficiency could be based on allocation
of activities that provide comparative advantage.
The relation between regional agglomeration and technical efficiency is positive. It has the
highest coefficiency following the outsourcing expenditure. It is higher than that of low
technology firms. This result emphasizes the importance of location in explaining the
technical efficiency in high technology sectors (Driffield & Munday, 2001; Taymaz & Saatçi,
1997).
The presence of R&D personnel is also an important determinant of technical efficiency in
high technology sectors, implying that R&D intensive firms are more efficient (Cohen
&Levinthal, 1989; Coe et al.1995; Huang & Liu,1994). This finding is in line with R&D
supporting policy in high technology sectors in Turkey. As for the low technology
manufacturing firms, the coefficient of R&D has negative and significant effect on technical
inefficiency. On the other hand, its effect is smaller than that of the high technology
The effect of software investment is positive and significant. However, the coefficient is the
smallest in comparison to the other variables. This indicates that software investment is
still not the main factor in explaining technical efficiency since software investment is quite
a new factor of investment. As for the low technology manufacturing firms, software
investment has also positive and significant effect on technical efficiency for low technology
manufacturing firms.
Time effects are also introduced in the estimation. All of them are positively related to
technical efficiency. This result is in line with the assumption that links positive association
with the privatization and technical efficiency (Jha & Majumdar, 1999; Ross et al., 1996;
Bortolotti et al. 2002; Lam & Shiu, 2010).
For the low technnology manufacturing firms, we included some additional factors such as
subsidy, outsourcing revenue, and subcontracting expenditure in the technical inefficiency
function. Interestingly subsidy does not appear to be significant for low technology sectors
although the considerable number of firms in the low technology sectors are subsidized in
Turkey.
It is crucial to make a distinction between outsourcing reveue and outsourcing expenditure.
For the first one, outsourcing is the main activitiy of the firm that generates a large part of
the turnover while for the second, firm may outsource part of its activities to the external
suppliers. We included outsourcing revenue in the efficiency estimation of the low
technology manfacturing firms since outsourcing revenue accounts for considerable amount
of the firm turnover for that group of firms. Nevertheless they do not have the same degree
of impact with outsourcing expenditure. This indicates that firms that do outsource their
activities to other firms are more efficient than for firms in which outsourcing is the main
activity.
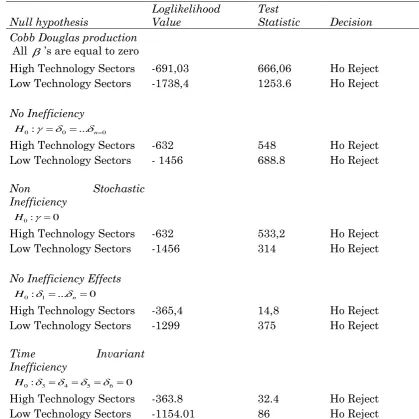
Table 5 displays the test results for the models. The first null hypothesis is based on the
presence of Cobb-Douglas functional form, therefore, all squared and interaction terms are
excluded from the model. These tests are applied for each technology group. The likelihood
ratiosof test statistics are calculated by the formula as
0 1
2{log[likelihood H( )] log[likelihood H( )]}
If the value exceeds the 5 % critical value, 𝐻0 is rejected. For this study, it implies that
Cobb Douglas is not the appropriate functional form. The second null hypothesis is based on
the absence of inefficiency in the model. If the paramater gamma is zero, the variance of the
inefficiency effects is zero. This indicates that the model is reduced to traditional response
function that include determinants of efficiency into the production function. The test
statistics reject this null hypothesis. For high technology industry, a key parameter
is0.94. For the low technology industry, this variable is 0.78. This implies that much of the
variation in the composite error term is due to the inefficiency component. The third null
hypothesis is that firms in the high technology sectors and low technology sectors are fully
efficient. When the only gamma is set to zero, it specifies that the inefficiency effects are
not stochastic. However, this assumption is rejected in this study.
The forth null hypothesis is that there is no inefficiency effect. When only inefficiency
effects are set to zero, it specifies that the inefficiency effects are not a linear function of the
inefficiency parameters. This hypothesis is also rejected which indicates that the joint
effects of these inefficiencies of production are significant, although individual effects of one
or more variables may not be significant.
The fifth null hypothesis is that inefficiency effect is time invariant. As reported in the
Table 3 and 4, year dummies give negative and significant results for the technical
inefficiency. This implies that the null hypothesis is rejected.
CONCLUSION
The adoption and the use of Information and Communication Technologies (ICTs) are
indications of technological progress and important keys for the development of
knowledge-based economy and its future sustainability. The existence of ICT infrastructure provides
business opportunities and helps firms build up business networks between suppliers,
buyers and customers. A large number of business tasks are succeeded through the internet
by means of personal computers and external network facilities which, in turn, decrease the
transaction costs. Moreover, use of ICTs provides an efficient channel for advertising,
marketing and direct distribution of goods and services. ICTs play a dual role in the
business world. It is both a technology stock of the firms and a channel for technology
ICT have three main components. These are telecommunication investment, hardware
investment and software investment. Unlike hardware and telecommunication investment,
measuring the software investment is difficult since it is generally supplied with the
hardware component. In recent years, a considerable effort has been directed to isolate the
effect of software investment as a part of intangible investment on firm efficiency. In
Turkey, there has been an increase in the software investment of Turkish manufacturing
firms during the period 2003-2007. In this study, we analyzed whether the increase in
software investment resulted in efficiency gains for software-intensive manufacturing firms
in Turkey by using time varying stochastic frontier approach. The main motivation was to
increase output by increasing efficiency with given amounts of resources. Therefore, the
term efficiency can be simply defined as the success in producing as large as possible with
the given input. Our results show that software investment is crucial both for the high
technology and the low technology manufacturing firms. However, its effect is much higher
in the high technology sectors such as electricity, chemicals, and machinery as compared to
the low technology sectors such as clothing, textiles, food, paper, and unclassified
manufacturing.
Despite its positive and significant effect on the firm efficiency, software investment does
not generate an effect as large as the research and development personnel which is another
component of intangible investment. Software intensive firms mostly rely on the skilled
workforce which is competent in research and development activities. This result shows
that the presence of R&D personnel has a crucial role for productive efficiency of the
APPENDICIES
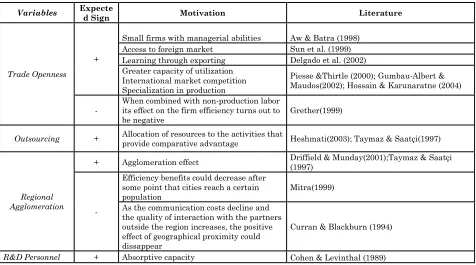
TABLE 1 . A list of Literature on the determinants of firm Efficiency and Expected Signs
Variables Expecte
d Sign Motivation Literature
Trade Openness +
Small firms with managerial abilities Aw & Batra (1998) Access to foreign market Sun et al. (1999) Learning through exporting Delgado et al. (2002) Greater capacity of utilization
International market competition Specialization in production
Piesse &Thirtle (2000); Gumbau-Albert & Maudos(2002); Hossain & Karunaratne (2004)
-
When combined with non-production labor its effect on the firm efficiency turns out to be negative
Grether(1999)
Outsourcing + Allocation of resources to the activities that
provide comparative advantage Heshmati(2003); Taymaz & Saatçi(1997)
Regional Agglomeration
+ Agglomeration effect Driffield & Munday(2001);Taymaz & Saatçi (1997)
-
Efficiency benefits could decrease after some point that cities reach a certain population
Mitra(1999)
As the communication costs decline and the quality of interaction with the partners outside the region increases, the positive effect of geographical proximity could dissappear
Curran & Blackburn (1994)
Expenditure Spillover effects from R&D in developed
countries to developing ones Coe et al. (1995); Huang & Liu (1994)
ICT
+
Higher growing firms exploit the adoption integrated technologies more than lower
growing firms Brasini & Freo(2012) Investment in ICT is not the only way of
achieving higher economic growth. ICT generates complementary effects on the variables as human capital and structural change in the different sectors
Castiglione (2012)
Higher economic growth depends on
technological progress Dimelis & Papaioannou.(2010)
n.s. Lack of significant effect of the internet use
for sales in firm's efficiency Romero & Rodriguez(2010) Software
Investment +
Software investment increases the scale of
firm operations Becchetti et al. (2003) Subcontracting
Expenditure + Network effect
Aoki(1989);Lazonick(1990);Burki & Terrel(1998);Taymaz & Saatci(1997)
Subsidy - Renk seeking behaviour Martin et al.(1983)
n.s. Subsidies go to R&D performers González et al. (2005)
Time effect + Privatization of the state monopoly Jha & Majumdar (1999);Ross et al.
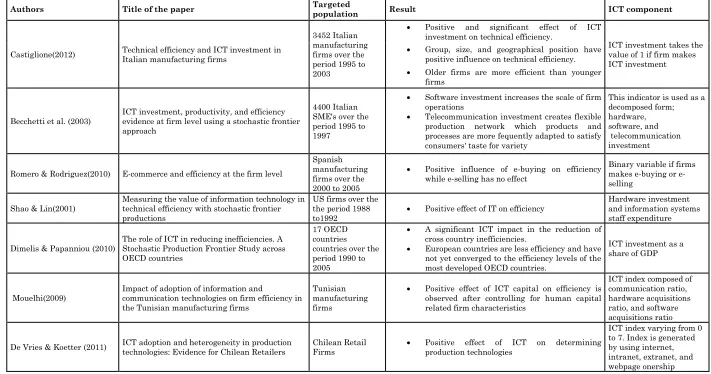
TABLE 2. Empirical Studies on the Effect of ICT on Efficiency
Authors Title of the paper Targeted
population Result ICT component
Castiglione(2012) Technical efficiency and ICT investment in Italian manufacturing firms
3452 Italian manufacturing firms over the period 1995 to 2003
Positive and significant effect of ICT investment on technical efficiency.
ICT investment takes the value of 1 if firm makes ICT investment Group, size, and geographical position have
positive influence on technical efficiency. Older firms are more efficient than younger
firms
Becchetti et al. (2003)
ICT investment, productivity, and efficiency evidence at firm level using a stochastic frontier approach
4400 Italian SME's over the period 1995 to 1997
Software investment increases the scale of firm operations
Telecommunication investment creates flexible production network which products and processes are more fequently adapted to satisfy consumers' taste for variety
This indicator is used as a decomposed form; hardware, software, and telecommunication investment
Romero & Rodriguez(2010) E-commerce and efficiency at the firm level
Spanish manufacturing firms over the 2000 to 2005
Positive influence of e-buying on efficiency while e-selling has no effect
Binary variable if firms makes buying or e-selling
Shao & Lin(2001)
Measuring the value of information technology in technical efficiency with stochastic frontier productions
US firms over the the period 1988 to1992
Positive effect of IT on efficiency
Hardware investment and information systems staff expenditure
Dimelis & Papanniou (2010)
The role of ICT in reducing inefficiencies. A Stochastic Production Frontier Study across OECD countries
17 OECD countries countries over the period 1990 to 2005
A significant ICT impact in the reduction of cross country inefficiencies.
European countries are less efficiency and have not yet converged to the efficiency levels of the most developed OECD countries.
ICT investment as a share of GDP
Mouelhi(2009)
Impact of adoption of information and
communication technologies on firm efficiency in the Tunisian manufacturing firms
Tunisian manufacturing firms
Positive effect of ICT capital on efficiency is observed after controlling for human capital related firm characteristics
ICT index composed of communication ratio, hardware acquisitions ratio, and software acquisitions ratio
De Vries & Koetter (2011) ICT adoption and heterogeneity in production technologies: Evidence for Chilean Retailers
Chilean Retail Firms
Positive effect of ICT on determining production technologies
TABLE 3. Stochastic Production Frontier Estimation Results for High Technology Firms
A. Frontier Functions Coefficients t-statistics
Constant 0.10 5.19
K 0.14 17.09
L 0.02 2.13
RM 0.59 72.43
E 0.05 5.86
T 0.04 5.98
K*K 0.02 5.73
K*L -0.01 -2.07
K*RM -0.08 -11.89
K*E 0.04 6.14
K*T -0.01 -2.29
L*L 0.00 0.47
L*RM 0.01 1.46
L*E 0.00 -0.49
L*T 0.00 -0.56
RM*RM 0.09 27.70
RM*E -0.05 -8.29
RM*T 0.03 6.14
E*E 0.01 3.01
E*T -0.01 -2.00
T*T 0.03 5.80
Chemicals 0.19 7.37
Electricity 0.05 2.27
Machinery 0.03 1.29
B. Inefficiency Effects Model
Constant -0.88 -1.98
Trade Openness -1.11 -5.84
Outsourcing -3.66 -7.37
Regional Agglomeration -2.13 -7.30 R&D personnel -0.44 -4.40 Software investment -0.12 -5.60
Year 2004 -1.15 -7.85
Year 2005 -1.54 -8.08
Year 2006 -2.31 -12.71
Year 2007 -0.83 -7.36
Variance Parameters,loglikelihood, and mean efficiency 2
2 2
u v
2 / ( 2 2)
u u v
Loglikelihood
0.75 9.34 0.94 116.99
-357.52
Mean efficiency 0.83
Number of observations 2212
[image:25.595.116.463.88.658.2]TABLE 4. Stochastic Production Frontier Estimation Results for Low Technology Firms
A. Frontier Functions Coefficients t-statistics
Constant -0.01 -0.30
K 0.08 13.80
L -0.01 -1.67
RM 0.66 98.28
E 0.03 4.51
T 0.03 4.84
K*K 0.01 5.20
K*L 0.01 1.62
K*RM -0.04 -8.21
K*E 0.00 0.65
K*T 0.00 -0.20
L*L 0.00 1.21
L*RM 0.00 0.71
L*E 0.00 0.60
L*T 0.00 0.35
RM*RM 0.10 35.80
RM*E -0.04 -6.97
RM*T 0.02 4.68
E*E 0.02 4.88
E*T -0.01 -2.80
T*T 0.03 5.08
Food -0.01 -0.37
Textiles 0.14 4.65
Paper 0.17 5.32
Unclassified manufacturing 0.02 0.62
B. Inefficiency Effects Model
Constant 0.39 2.62
Export share -5.63 -13.13 Outsourcing expenditure -0.21 -3.38 Outsourcing income 0.00 0.00
Subsidy 0.03 0.75
Regional Agglomeration -0.07 -1.00 R&D personnel expenditure -0.23 -5.75 Software investment -0.08 -4.00 Subcontracting expenditure -0.52 -5.77
Year 2004 -0.21 -3.50
Year 2005 -0.36 -4.50
Year 2006 -0.97 -6.06
Year 2007 -0.23 -3.29
Variance Parameters,loglikelihood, and mean efficiency 2
2 2
u v
2 / ( 2 2)
u u v
0.28 0.78 7.00 19.50 Loglikelihood -1111.6 [image:26.595.115.406.105.758.2]Number of observations 4160 TABLE 5. Test results
Null hypothesis
Loglikelihood Value
Test
Statistic Decision
Cobb Douglas production
All ’s are equal to zero
High Technology Sectors -691,03 666,06 Ho Reject
Low Technology Sectors -1738,4 1253.6 Ho Reject
No Inefficiency
0: 0 ... n 0
H
High Technology Sectors -632 548 Ho Reject
Low Technology Sectors - 1456 688.8 Ho Reject
Non Stochastic Inefficiency
0: 0 H
High Technology Sectors -632 533,2 Ho Reject
Low Technology Sectors -1456 314 Ho Reject
No Inefficiency Effects
0: 1 ... n 0
H
High Technology Sectors -365,4 14,8 Ho Reject
Low Technology Sectors -1299 375 Ho Reject
Time Invariant Inefficiency
0: 3 4 5 6 0
H
High Technology Sectors -363.8 32.4 Ho Reject
TABLE 6. Variable Definitions
Output (Q) Output which is measured as manufacturing
sales-changes in finished good inventories
Capital Stock (K) Depreciation Allowances
Labor (L) Average Number of Employees
Raw Material (RM) Total value of intermediate goods
Electricity and Fuel (E) Electricity and fuel purchased
Time (T) Time ( t,1,...5)
Industry Dummies
Food (Nace 15-16),textile (Nace 17-18), leather (Nace19),wood (Nace20),paper
(Nace21-22),chemicals (Nace25),plastics
(Nace25),nonmetals (Nace 26), metals(Nace 27-28),machinery(29),
electricity(Nace30-33),transportation equipment(Nace 34-35), and unclassified manufacturing(Nace 36-37)
R&D Personnel Dummy variable which takes the value of 1 if the
firm invests in R&D personnel expenditure
Regional Agglomeration Share of the firm’s revenues to the total revenue of
the region
Software Investment Share of software investment to total intangible
investment
Trade Openess Share of total product and services exports to total
revenues
Outsourcing revenue The share of total outsourcing expenditure to total
expenditure
Outsourcing expenditure The share of total outsourcing revenues to total
revenues
Subsidy Dummy variable which takes the value of 1 if the
firm receives subsidy and 0 otherwise
Suncontracting The share of subcontracting expenditure to total
expenditure
Time Effects Dummies for each year from 2004 to 2007. 2003 is
REFERENCES
Adams, M., & Oleksak, M. (2010). Intangible Capital: Putting knowledge to work in the 21st century organization. Santa Barbara, ABC-CLIO.
Alvarez, R., & Crespi, G. (2003). Determinants of technical efficiency in small firms. Small Business Economics, 20(3), 233-244.
Aoki, M. (1989). Information, incentives and bargaining in the Japanese economy: A microtheory of the Japanese Economy. New York, Cambridge University Press.
Atiyas, I. (2011). Regulation and competition in the Turkish telecommunications industry. In The Political Economy of Regulation in Turkey.New York, Springer.
Atrostic, B. K., & Nguyen, S. V. (2005). IT and productivity in US manufacturing: Do computer networks matter?. Economic Inquiry, 43(3), 493-506.
Atrostic, B. K., Motohashi, K., Nguyen, S. V. (2008). Computer Network Use and Firms' Productivity Performance: The United States vs. Japan (US Census Bureau Center for Economic Studies Paper No. CES-WP-08-30).
Retrieved March 18, 2015, from
http://papers.ssrn.com/sol3/papers.cfm?abstract_id=1269425.
Aw, B. Y., & Batra, G. (1998). Technology, exports and firm efficiency in Taiwanese manufacturing. Economics of Innovation and New Technology, 7(2), 93-113.
Balassa, B. (1978). Exports and economic growth: further evidence. Journal of Development Economics, 5(2), 181-189.
Basu, S., & Fernald, J. (2007). Information and communications technology as a general‐purpose technology: evidence from US industry data. German Economic Review, 8(2), 146-173.
Battese, G. E., & Coelli, T. J. (1992). Frontier production functions, technical efficiency and panel data: with application to paddy farmers in India. Netherlands, Springer.
Berghall, E. (2014). Has Finland advanced from an investment to an innovation-driven stage?. LTA, 1(14), 11-32.
Bertschek, I., Fryges, H., & Kaiser, U. (2006). B2B or Not to Be: does B2B e‐ commerce increase labour productivity?. International Journal of the Economics of Business, 13(3), 387-405.
Bessen, J., & Hunt, R. M. (2007). An empirical look at software patents. Journal of Economics & Management Strategy, 16(1), 157-189.
Birdshall, N., & Nellis, J. (2003). Winners and losers: assessing the distributional impact of privatization. World Development, 31(10), 1617-1633.
Bodman, P. M. (1996). On export-led growth in Australia and Canada: cointegration, causality, and structural stability, Australian Economic Papers, 35(67), 282-299.
Borgo, M. D., Goodridge, P., Haskel, J., & Pesole, A. (2013). Productivity and growth in UK Industries: an intangible investment approach. Oxford Bulletin of Economics and Statistics, 75(6), 806-834.
Bortolotti, B., D’Souza, J., Fantini, M., & Megginson, W. L. (2002). Privatization and the sources of performance improvement in the global telecommunications industry. Telecommunications Policy, 26(5), 243-268.
Bosworth, B. P., & Triplett, J. E. (2000). What’s new about the new economy? IT, economic growth and productivity. Washington, DC, Brookings Institution, Mimeo.
Brasini, S., & Freo, M. (2012). The impact of information and communication technologies: an insight at micro-level on one Italian region. Economics of Innovation and New Technology, 21(2), 107-123.
Burki, A. A., & Terrell, D. (1998). Measuring production efficiency of small firms in Pakistan. World Development, 26(1), 155-169.
Castiglione, C. (2012). Technical efficiency and ICT investment in Italian manufacturing firms. Applied Economics, 44(14), 1749-1763.
Castiglione, C., & Infante, D. (2014). ICTs and time-span in technical efficiency gains. A stochastic frontier approach over a panel of Italian manufacturing firms. Economic Modelling,41, 55-65.
Coe, D. T., Helpman, E. & Hoffmaister, A.W. (1995). North-South R&D spillovers, The Economic Journal, 107, 134-149.
Cohen, W. M., & Levin, R. C. (1989). Empirical studies of innovation and market structure. Handbook of Industrial Organization, 2, 1059-1107.