Demand Around the Clock: Time Use and Data Demand of
Mobile Devices in Everyday Life
Kelly Widdicks
1, Oliver Bates
1, Mike Hazas
1, Adrian Friday
1, and Alastair R. Beresford
21
School of Computing and Communications, Lancaster University, UK
2
Computer Laboratory, University of Cambridge, UK
{
k.v.widdicks, o.bates, m.hazas, a.friday
}
@lancaster.ac.uk, [email protected]
ABSTRACT
Motivated by mobile devices’ growing demand for connec-tivity, and concern in HCI with the energy intensity and sus-tainability of networked services, in this paper we reveal the impact of applications on smartphones and tablets in terms of network demand and time use. Using a detailed mixed meth-ods study with eight participants, we first provide an account of how data demand has meaning and utility in our partic-ipants’ social practices, and the timing and relative impacts of these. We then assess the scale of this demand by draw-ing comparison between our fine-grained observations and a more representative dataset of 398 devices from the Device Analyzer corpus. Our results highlight the significant cate-gories of data demanding practice, and the identification of where changes in app time and duration of use might reduce or shift demand to reduce services’ impacts.
Author Keywords
sustainability; data demand; ICT; demand designed into practices.
ACM Classification Keywords
H.5.m. Information Interfaces and Presentation (e.g. HCI): Miscellaneous
INTRODUCTION
Mobile devices (e.g. smartphones, tablets) are increasingly integrated throughout our daily lives to support the
“accom-plishment of social practices” [28]; this has implications
for the energy intensity of practices: the energy demands, not only of the devices themselves, but of the Internet and communications infrastructures, and cloud services that com-pose the information services we increasingly access and rely upon [31]. The quantifiable energy and emissions associated with this“demand for network connectivity and online
ser-vices”[19, p.2729] is known as data demand. Data demand
is effectivelydesigned into practicesthrough its embedding in technologies and apps that we use to support them.
Despite substantial efficiency gains in both the Internet core network and cloud data centres, the backdrop for our work is
Permission to make digital or hard copies of part or all of this work for personal or classroom use is granted without fee provided that copies are not made or distributed for profit or commercial advantage and that copies bear this notice and the full cita-tion on the first page. Copyrights for third-party components of this work must be honored. For all other uses, contact the owner/author(s). Copyright is held by the au-thor/owner(s).
CHI 2017, May 6-11, 2017, Denver, CO, USA. ACM ISBN 978-1-4503-4655-9/17/05.
http://dx.doi.org/10.1145/3025453.3025730
one of unprecedented and ongoing growth in demand for mo-bile technologies and related services. The increasing own-ership and usage of mobile digital technology is contribut-ing towards a predicted growth in European smartphone traf-fic from 1.2 GB to 6.5 GB per month, per user [7]. Cou-pled with this, initiatives driving growth in access to services, such as the UK Government’s aim for 95% of UK premises to access“superfast”(35 megabit) broadband by 2017 [21], furthers opportunities for demand through higher-bandwidth transmissions (e.g. higher definition video [6], the adoption of ultra HD and 4K video content [22, p. 115–6], the deploy-ment of HD voice [7])—a vicious cycle that has the potential to placeeven morereliance on cloud or Internet services.
In this paper, we establish the data demand relating to ev-eryday practices that involve mobile devices. We identify the most data (and thus associated energy) intensive practices (e.g. watching, listening and social networking) at a level finer than surveyed in existing work, such as Sandvine [30]. We explore the relative demand intensities of the practices, and identify the times of day at which they are most prevalent. Additionally we contrast data demand and time use for com-munication to the time use and environmental impact of SMS and phone calls; and examine the data demand of“hidden” non-interactive system updates, backups and background pro-cesses, calling out their relative impacts. This analysis is fa-cilitated by: (1) a quantitative and qualitative investigation of eight Android device users, juxtaposed with (2) a quantita-tive investigation of 398 Android devices. We summarise by contributing new implications for future HCI design.
RELATED WORK
The importance of taking a “holistic view”of the impacts of media and ICT (including mobile devices) has been pre-viously stressed by Bates et al. [2]. Such a view should include manufacture and distribution (embodied emissions), direct energy use (e.g. electricity consumption), indirect im-pacts and the practices that encompass use of these technolo-gies. While this work goes into details surrounding embodied emissions, direct energy and practices, indirect impact (i.e. data demand) is not quantified. However, with up to 90% of the use phase energy consumption of mobile technologies being due to data demand [15] we cannot afford to ignore the indirect impacts just because a large proportion of energy
is“hidden”in the communication network, content delivery
networks and data centres behind such services.
Addressing the embodied impacts of manufacture, HCI re-searchers have been discussing the importance of extending the lifetime of use of mobile digital technologies (e.g. [11, 13, 26]), and we would wholeheartedly endorse the core mes-sages of longevity and avoiding designs that lead to premature obsolescence and obviate reuse—especially given forecasts predicting continued escalation in adoption of digital tech-nologies (e.g. growth in the number of living room connected devices [27]) and growth in network traffic [7]. Our goal in this work, however, is to probe the connection between de-vice use in social practices [28, 38] and its growing impact as a consequence of overall and peak demand [25].
The role of ICT in supporting social practices can be seen to reduce some environmental impacts whilst increasing others. Hilty explores these opportunities, with first-, second- and third-order environmental effects of ICT [14]. The impact of manufacture, distribution and disposal is linked to negative first-order environmental impacts of ICT, whilst second-order impacts encourage positive environmental effects through their influence on processes of production, transport and con-sumption [14]. Third-order effects are the long-term
“adap-tations of behaviour and economic structures”[28, p. 349]
which can lead to rebound effects. Considering, as we see in this paper, that mobile ICT can loosen the spatial and tem-poral constraints surrounding practices [28], it is important to uncover the underlying times and places of use to better understand practices and demand.
Time of use of data demanding digital technologies in the home has been previously studied by Kawsar and Brush. They collected logs from 86 home routers, supplemented with 18 interviews and 55 surveys. They show that: there is higher activity in the afternoons and evenings for social networking and video watching [17, Figure 4]; tablets are used more fre-quently than smartphones [17, Figure 2]; and, screen size and usage context influence device preference for social network-ing [17, Figure 7]. These findnetwork-ings are important to consider when attempting to reduce the intensity of data demand, how-ever, this study doesn’t link its findings to energy or other impacts.
Personal communication via home broadband has been a fo-cus of prior work: Chetty et al. [5] study the effects of broadband in 12 US households, focusing on users’ expe-riences with bandwidth caps and ISPs’ monthly “use it or
lose it” data plans. They reveal directions for more
band-width sensitive designs, moving away from“all you can eat” plans. Furthermore, their study highlights that people can
be“mindful consumers”but have difficulty managing
band-width [5, p.3029]. Other work that studies everyday life and Internet connectivity has primarily explored the effects in terms of: wellbeing (e.g. digital gaming effects [34], alone-togetherness [39]); social expectations and negotiating friend and family relationships [1]; the relationship between pro-ductivity tools and busyness [18]; and the effects of email on productivity [20]. Whilst these studies focus on how ICT can affect everyday life, they do not quantify the data demand of the practices they observe, nor link this demand to time use.
Closest to our research, Lord et al. have quantified data de-mand and explored how mobile devices are integrated into the performance of practices [19]. However, this work does not examine the time use of practices and their relationship to data demand. Unlike Lord et al., we compare the impacts of phone calls and SMS to the data demanded by communi-cation apps, and provide insights into why users spend time away from their devices. Our study is informedby both quan-titative analysis of app usage data, along with complementary qualitative participant accounts that are used to explore nu-ance in the findings. This research also adds to Lord et al. through investigating Android devices rather than iOS, and provides an increased understanding of the data demanded through practices on a large, quantitative scale.
More recently, Preist et al. [24] discuss how current design paradigms encourage infrastructure demand through defining high expectations of users. These include ensuring access to services during times of peak demand and handling high qual-ity media. Using prior research, the paper sets out a number of questions upon which service designers should reflect, in regards to their services’ environmental impact. Through in-vestigating the current data demanded through practices in our research, we aim to further the information presented by Preist et al. by indicating which practices in everyday life are the most demanding, or have the most potential for demand decrease, in terms of data and time.
METHODS AND PARTICIPANTS
To investigate the integration of mobile technologies into the performance of social practices [28, 36], a two-phase study was carried out for understanding the use and demand of An-droid devices. In the first phase, we gathered and analysed quantitative and qualitative data from eight Android device users using the Device Analyzer data logger (Device Ana-lyzer is developed at The University of Cambridge1,2); this
records device-use data such as screen state, power state and app data usage. Logging was followed by face to face in-terviews to discuss the data. In the second phase, we corre-late these findings with log data drawn from the large-scale dataset the Device Analyzer team at Cambridge have col-lected. Throughout the paper we refer to the former dataset as Eight Participants, and the latter as Atlantic Archipelago.
1https://play.google.com/store/apps/details?id=uk.
ac.cam.deviceanalyzer
The devices investigated in these datasets are the participants’ own, rather than devices given out specifically for the study.
Phase 1: Demand in detail
We recruited participants by promoting the study via local and University mailing lists and snowballing methods, and approaching previous study participants via email. Whilst no incentives for participation were given, eight participants agreed to take part. These participants were studied between October 2014–January 2015. We use consistent pseudonyms throughout the remainder of this paper.
The participants are a mixture of undergraduate students (Harry, Mark, Victoria), postgraduate students (Holly, Xan-der), and full-time employees (Tim, Bob, Amanda). Two of these participants were tablet users (Holly, Xander), whilst the remaining six were smartphone users. A summary of the participants and their device use is shown in Table 1.
This phase of the study was split into quantitative data gather-ing and qualitative interviews. For the data gathergather-ing, the De-vice Analyzer was installed on each participant’s Android de-vice, where one device was studied per participant. Although the participants did own other devices (e.g. Mark owned an iPad, Holly owned a Windows phone, and Xander owned an iPhone), these were not studied as this research is an im-portant first step for associating data demand with practices; however, multiple device studies will be essential within fu-ture work. The quantitative logging phase lasted for a mini-mum of 14 days for each of the participants (mean 29 days), except for Xander where only 11 days of data was captured due to problems charging his tablet abroad. The duration of each participant’s logging period is shown in Table 1.
Semi-structured interviews were carried out with each par-ticipant to discuss typical practices that included mobile de-vice use, approaches to mobile and Wi-Fi connectivity, power management, charging, and times of use. In order to foster deeper discussion of the devices’ integration into everyday life, graphs created from their logged data were presented to them; these included visualisations of their device use, bat-tery level, charging habits and a break-down of app usage3.
During each interview, we encouraged discussion surround-ing the meansurround-ings and competence associated with the device as well as the social practices in which the mobile devices featured. The interview questions were tailored to account for differences between phone and tablet devices, and the in-terviews lasted from 38 mins–1 hour and 25 mins (median 56 mins). Each interview was fully transcribed, independently open-coded by two researchers, and then consolidated and re-coded for emerging themes.
To relate the devices’ data demand and time use across prac-tices, we manually categorised all of the apps and processes used across Eight Participants, totalling to 1121 apps4. It is important to note that these categories are not practices them-selves, as the categories (e.g.“browsers”) may cross multiple practices. Where we graph the categorised time use and data demand from devices in both datasets, we omit devices who
3Some sample visualisations are provided as supplemental material.
4A listing of all 24 categories and example apps falling into each
category are provided as supplemental material.
were not“active”for each category, i.e. were not seen to be used, or exhibit data demand. Rather than analysing broad aggregates like existing studies [30], we present use and de-mand this way, as we want to compare categories’ average usage, and identify where we might shift practices’ reliance upon different categories of apps. However, to expose the prevalence of these categories, we show the number of de-vices contributing in brackets on relevant plot legends (Fig-ures 2–7); in these plots, we average across days for each device and then average across devices. Throughout the pa-per, we definetime useas the number of times an app had foreground status when the device screen was both on and unlocked.
Phase 2: Scale of demand
The second phase of the study links the findings of our obser-vational study with a large device population. This consisted of quantitatively analysing Android device use from a large-scale dataset collected by the Device Analyzer team. 30,000 devices have contributed to the corpus, of which we selected a partition of 398 devices to carry out our analysis. We selected devices which: (1) contributed data for at least 14 days with the latest data collected on or after 1st January 2014, (2) had a network-based location in the UK or Ireland for at least half of the contribution days, and (3) used apps or demanded data during their logging period. Interesting insights from the first study phase (e.g. the impact of watching, the use of different communication mediums) helped us identify app groups and practices of interest. As with Eight Participants, we manually categorised apps used by devices in Atlantic Archipelago.
Limitations
It is important to point out that the time use of some categories of apps we account for may be less than that actually used: Device Analyzer logs the foreground priority of apps every five minutes, meaning that an app can be used and yet not be still in the foreground when sampled. Apps which are used quickly (e.g. communication apps which are more likely to
be“micro-used”[10]) will be missed more often than apps
used for longer periods of time; this is a limitation present in both datasets. However, the five-minute sampling interval only applies to counting when apps are in the foreground; data demand, phone calls and SMS uses are logged in real-time and hence are accounted for accurately in our method.
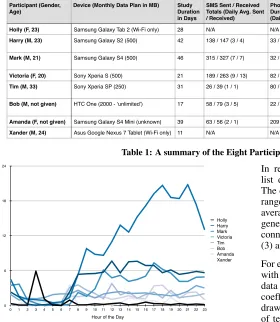
Participant (Gender, Age)
Device (Monthly Data Plan in MB) Study
Duration in Days
SMS Sent / Received Totals (Daily Avg. Sent / Received)
Phone Calls Count / Duration in Seconds Totals (Daily Avg. Count / Duration)
Data Demand Total in MB (Daily Avg. in MB)
Notable Categories (Daily Avg. Data Demand in MB)
Holly (F, 23) Samsung Galaxy Tab 2 (Wi-Fi only) 28 N/A N/A 3838 (137) Watching (72)
Harry (M, 23) Samsung Galaxy S2 (500) 42 138 / 147 (3 / 4) 33 / 2555 (1 / 61) 5644 (134) Watching (2), Online Dating (15),
Social Networking (96)
Mark (M, 21) Samsung Galaxy S4 (500) 46 315 / 327 (7 / 7) 32 / 2979 (1 / 65) 8359 (182) Online Dating (3), Social Networking
(145), Communication (13)
Victoria (F, 20) Sony Xperia S (500) 21 189 / 263 (9 / 13) 82 / 12743 (4 / 607) 441 (21) Social Networking (1)
Tim (M, 33) Sony Xperia SP (250) 31 26 / 39 (1 / 1) 80 / 32761 (3 / 1057) 14431 (466) Watching (5), Social Networking
(334), Communication (10)
Bob (M, not given) HTC One (2000 - ‘unlimited’) 17 58 / 79 (3 / 5) 22 / 1540 (1 / 91) 1199 (71) Watching (5), Social Networking
(26), Communication (3)
Amanda (F, not given) Samsung Galaxy S4 Mini (unknown) 39 63 / 56 (2 / 1) 209 / 30126 (5 / 772) 931 (24) Communication (0.02)
[image:4.612.60.340.64.386.2]Xander (M, 24) Asus Google Nexus 7 Tablet (Wi-Fi only) 11 N/A N/A 4622 (420) Watching (144)
Table 1: A summary of the Eight Participants and their device use.
N
u
mb
e
r
o
f
U
se
s
0 6 12 18 24
Hour of the Day
0 1 2 3 4 5 6 7 8 9 10 11 12 13 14 15 16 17 18 19 20 21 22 23
Holly Harry Mark Victoria Tim Bob Amanda Xander
Figure 1: The device use (averaged across days) for Eight Par-ticipants, estimated by the number of device screen on times.
OVERVIEW OF TIME USE AND ENERGY CONSUMPTION Routines around mobile devices from Eight Participants typ-ically start in the morning with the checking of current news and events (Tim, Xander, Bob, Harry), exercising (Tim), so-cial networking (Bob, Xander, Mark, Harry), and online dat-ing (Harry). Whilst all the participants maintain a regu-lar work day (roughly between 9am–5pm), use of devices continued throughout the day, specifically for smartphone users. This use during the working day varies between partic-ipants. For some, their device was sometimes used to aid with their work (Mark, Holly, Xander) and communicate with col-leagues (Bob). Whereas for others, mobile devices were used whilst at work or university for checking the time (Amanda, Victoria), filling in free time (Xander, Bob), communication with friends (Harry, Mark, Victoria, Bob, Xander), and so-cial networking (Mark, Tim, Bob, Holly); participants blur the lines between work and non-work practices, cf. [28]. Evenings were typically filled with social networking and communication, alongside more media-rich activities for entertainment-related practices. These included watching TV or movies (Holly, Xander), shopping (Tim), and browsing the Internet (Xander). This was similar to weekends, with com-munication, hobbies and social networking occurring more regularly. Examples of regular weekend use included keep-ing up to date with sportkeep-ing events (Tim), organiskeep-ing outkeep-ings and visits (Amanda), and bird watching (Harry). A summary of the participants’ hourly device use is shown in Figure 1.
In reporting our measurements throughout this paper, we list data demand in megabytes (MB) or kilobytes (KB)5.
The daily average data demand of Eight Participants devices ranges from 21–466 MB (Table 1), and was 316 MB for an average Atlantic Archipelago device. This data demand is generated by: (1) user interaction with an app that requires connectivity, (2) apps demanding data in the background, and (3) automatic and scheduled updates and backups.
For each gigabyte of data, the energy consumption associated with the Internet infrastructure, core Internet networks and data centres can be estimated to 200 watt-hours (Wh). This coefficient is a compound of three contemporary estimations drawn from the literature [31, 32, 33], assuming a mixture of text and video traffic; we use this coefficient throughout the paper to measure energy consumption. Using this esti-mate, the daily average energy consumption from the data demanded by the Eight Participants devices ranges from 4– 91 Wh, and is 62 Wh on average for a Atlantic Archipelago device. To put the energy consumption from data demand into perspective, the energy required to charge participants’ devices in Eight Participants ranges from 5–20 Wh per day6. Furthermore, using coefficients estimated by Berners-Lee [3] and converted using the Government emission conversion factor 2016 of 0.52 kg CO2e/kWh (including scope 3 emis-sions), we estimate that the energy consumption for a minute of phone call corresponds to 109.6 Wh, with 0.027 Wh cor-responding to a text message.
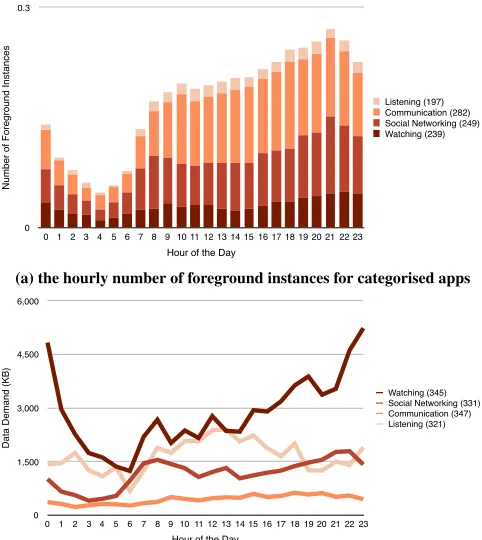
DATA DEMAND IN EVERYDAY LIFE
In this section we explore the relationship between time use and data demand for the most significant categories of apps used by Eight Participants: watching, online dating, social
networking and communication. Through examining the
qualitative data gathered from the interviews, we provide ac-counts of their practice use in everyday life, relating this to the time use and demand of app categories. The section fin-ishes by showing when automated updates and backups make large contributions to data demand.
5Throughout we use the MB notation to represent 1,048,576 bytes
or 1 Mebibyte (MiB), and the KB notation to represent 1024 bytes or 1 Kibibyte (KiB).
6Based upon the amount of time spent charging per day and the
N
u
mb
e
r
o
f
F
o
re
g
ro
u
n
d
I
n
st
a
n
ce
s
0 1
Hour of the Day
0 1 2 3 4 5 6 7 8 9 10 11 12 13 14 15 16 17 18 19 20 21 22 23
Watching (5) Social Networking (7) Communication (7) Online Dating (2)
(a) the hourly number of foreground instances for categorised apps
D
a
ta
D
e
ma
n
d
(KB)
0 3,000 6,000 9,000 12,000
Hour of the Day
0 1 2 3 4 5 6 7 8 9 10 11 12 13 14 15 16 17 18 19 20 21 22 23
Watching (7) Social Networking (7) Communication (7) Online Dating (2)
[image:5.612.54.296.63.335.2](b) the hourly data demand of categorised apps
Figure 2: The distribution of time use and data demand hourly across notable categories for Eight Participants. The most de-manding category, social networking, is ever present throughout the day (41% of overall data demand). Watching is less contin-uous, but is still demanding (16%) due to the data intensity of video media. Like social networking, communication apps are used regularly, but represent less data demand (2%).
Watching and downloading asynchronously
Video watching played a significant role in the lives of six of our participants (Holly, Mark, Harry, Tim, Bob, Xander), and was seen to cross practices (e.g. Holly watching TV or movies on-demand in bed, Xander watching content stored on his tablet, Bob watching DIY tutorials on YouTube). For Tim, BT Sport is used on Saturdays to watch the football, forward-ing video to his TV but not usforward-ing the app interactively. Whilst he explained how he listens to YouTube playlists when exer-cising in the morning, he was unable to recount what he else he would use YouTube for throughout the day,“I dunno... I
do use, I do use YouTube a lot”. This app demanded a total
of 41 MB of data during his study. Like Tim, Harry watches videos on YouTube, whereas Mark focuses on Sky Go.
Holly’s watching time use and data demand consists of
watching catch up TV via video-on-demand apps. This
watching occurred typically at midnight, corresponding with her explanation of how she would watch TV on her tablet when going to bed. This watching in the evening was a com-mon activity for Xander too, who is also a tablet user. He described how watching video is a part of his evening rou-tine: “There’s like a stage where you’re going to bed and you’re like ‘no I’m really going to bed now’, the laptop is
turned off... so I watch quite a lot of TV on [my tablet]”.
Xander’s watching use occurred between 17:00 and 20:00,
yet his watching data demand occurred later between 22:00 and 01:00 with very little time use within these later hours. When discussing watching with Xander, he explained that he primarily watches video that he has pre-loaded onto his tablet via his VPN app. This gives an insight into why increases in time use for watching do not always correspond with in-creases in its associated data demand.
Watching also occurs more spontaneously. Tim mentions that he sometimes watches videos that appear on his Facebook feed, “if there’s like videos on Facebook that people post I sometimes watch them as well”. Xander also streams from his web server directly to his device,“I stream stuff through like a web server, I think it goes through [MX Player]”. With apps such as the browser supporting watching, and social networks allowing the sharing and linking to videos, it is likely that the data demand and time spent watching is higher than we have attributed. This could be the case for Holly, as she mentioned she would use her browser for watching streamed content. Although we cannot assume that all the data demanded by Holly’s browser use is directly associated with watching, it contributed 55 MB to her daily data demand.
Online dating and obsessive data
Harry and Mark use online dating (OKCupid and Tinder by Harry, Tinder by Mark) apps regularly throughout the day, with the peaks in the morning (09:00) and again in the evenings (22:00–23:00) (Figure 2a). Whilst Mark’s daily use of Tinder halted in the middle of the study, Harry made his on-line dating part of his“obsessive checking”routine,“I gen-erally have a bit of a pattern of like Facebook, and Twitter,
and Rare Bird Alert, and sometimes Tinder”. This routine
explains why online dating is perhaps most similar in time use to social networking and communication.
Even though the demand arising from online dating may only be from two of the participants, this category is interesting to consider as it is relatively data intensive (e.g. online dat-ing contributed to 11% of Harry’s daily data demand), with demand throughout the day for communication being compa-rable (Figure 2b). Ten years ago, online dating would have primarily been carried out on a desktop or laptop computer; but mobile devices have come to allow (through dating apps) for the activity to be carried out in any space and at any time.
Social networking and communication
Social networking in many cases replaces older but less data intensive forms of connecting with others (e.g. messaging via SMS), but usually also adds richer (and more data demand-ing) media including images, URLs, and videos. This cate-gory was used consistently throughout typical waking hours (Figure 2a), yet its associated data demand was constantly high across all 24 hours of the day (Figure 2b).
N
u
mb
e
r
o
f
U
se
s
0 1 2
Hour of the Day
0 1 2 3 4 5 6 7 8 9 10 11 12 13 14 15 16 17 18 19 20 21 22 23
[image:6.612.54.295.62.201.2]Communication (7) Phone Calls (6) SMS Received (6) SMS Sent (6)
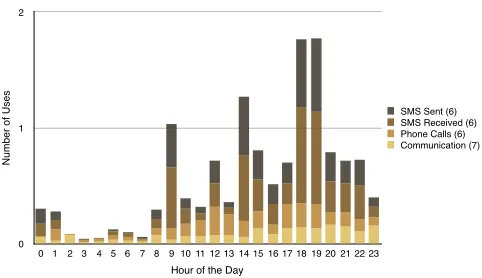
Figure 3: The distribution of communication time use hourly for Eight Participants. Hourly communication use consists of the number of: SMS sent and received, phone calls, and times communication apps were in the foreground.
used consistently throughout the day, SMS and phone calls are still an important means of participants’ communication with others (Figure 3). Whilst phone calls were prominent around lunchtime (12:00–13:00) and early evening (17:00– 19:00), SMS was a more popular medium for communication throughout the day. Both sent and received SMS were used significantly in the morning (09:00), after lunch (14:00) and after work (18:00–19:00).
Mobile device notifications were seen to reinforce a perceived urgency to reply to messages, particularly when communi-cating with friends or family. This urgency regularly lead to quick replies and short bursts of two-way communication, es-pecially when participants had more free time (e.g. Victoria is more likely to reply quickly if she’s free), and even feelings of anxiety for Bob: “I feel that you should respond to texts as soon as you can. But then you don’t want to end up in a situation where you’re like text, text, text...”.
When discussing communication apps, Xander mentioned that he prefers to use Facebook Messenger as he can see if his sent messages have been read. Instead of using this app, Vic-toria uses her browser for Facebook when connected to Wi-Fi, due to problems that she had faced with her phone’s cellular connection (e.g. 3G/4G). She explained how she only really uses Facebook to send messages when she has additional con-tent that wouldn’t necessarily be sent over SMS (e.g. photos, links to websites). Bob and Amanda also used communica-tion apps for sharing multimedia to support them in main-taining family relationships (e.g. Bob uses video chat to show his parents his son due to them living abroad, Amanda uses WhatsApp to see pictures of her partner’s grandchild). This indicates that preferences for communication use can vary based on the content users want to send (e.g. images) or re-ceive (e.g. confirmation that messages have been read).
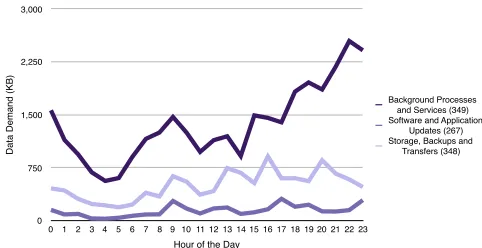
Hidden demand: updates and backups
Apps and services relating directly to updates and backups accounted for 7% of the participants’ daily aggregate data de-mand. This demand arises in the following scenarios: (1) updating an app or the OS, (2) downloading new apps from the app store, and (3) syncing and backing up of data to a server or Cloud service (e.g. syncing documents to Dropbox). Peaks (e.g. 07:00 for updates, 22:00 for backups) and troughs
D
a
ta
D
e
ma
n
d
(KB)
0 1250 2500 3750 5000
Hour of the Day
0 1 2 3 4 5 6 7 8 9 10 11 12 13 14 15 16 17 18 19 20 21 22 23
Background Processes
and Services (8) Software and Application
Updates (6) Storage, Backups and
[image:6.612.322.559.63.197.2]Transfers (8)
Figure 4: The distribution of data demand hourly across the
“hidden demand”categories for Eight Participants.
(09:00 for both) form the data demand for these categories (Figure 4), a trait shared by background processes (e.g. peaks at 07:00, troughs at 09:00). Although the reasons for the de-mand by these background processes is unknown, it accounts for 7% of the participants’ daily aggregate demand. This highlights how demand is buried deep in the design of mo-bile device operating systems and their supporting processes.
Both software and apps can perform updates and backups without users’ knowledge. For some, these updates are seen negatively, e.g. Bob gets frustrated when updates take a long time and prevent him from using his device. Xander manually manages his tablet updates, with automatic updates turned off; this does not mean updates do not happen at all however, as he updated and downloaded apps before his trip abroad, contributing to 56 MB of his daily data demand. Mark also manages his upgrades, choosing to update when there are updates available for several apps instead of updating them individually. Victoria however, actively avoids updates as she’s worried she’ll lose all the text messages stored on her phone, explaining why she was one of the two participants who didn’t contribute to the demand of updates (Figure 4).
Although we are able to differentiate specific apps for updates and backups, these can sometimes be hidden within the data demand of categories such as social networking. This was the case with Tim and his automatic uploads of videos and photos to the Google+ app. As Tim takes a large quantity of photos on his smartphone, this app demanded just under 10 GB dur-ing his study, indicatdur-ing that the demand from updates and backups crosses multiple categories and is therefore likely to be more than we have estimated here.
A REFLECTION OF USE THROUGH TIME
Filling time and notifications
Harry checks social networks, communication apps and bird watching news throughout the day. He views this pattern as
“obsessive”and has noticed that he uses his phone more
fre-quently now he has Twitter, stating that“Twitter keeps you up to date with what’s going on in the world all the time”. His checking is likely contributing to his higher device time use (Figure 1). Mark, the participant with the highest device use (Figure 1), is a sporadic checker of his smartphone too, par-ticularly when news feeds are announced that he is interested in (e.g. every“two to three minutes”during weekend foot-ball games). Tim is also a frequent user of his phone, where he checks notifications“when they flash up”to see what they are, even though he isn’t supposed to use his phone at work.
Obsessive checking, reactions to notifications, and pressures to work can be seen to fill time; this supports the finding by Lord et al. [19]. Having time to fill, along with the increased multitasking supported by digital technologies are“enabled by the partial decoupling of many practices from previous time and space constraints through the use of ICT, contribute
to a more densely packed everyday life”[28, p.356]. A more
densely packed everyday life can be seen to increase the use of digital technology, which in turn leads to increased de-mand. However, we have shown that there are some exem-plars where our participants increase the frequency in which they“obsessively”fill time (e.g. Mark filling time more when there’s football on, Tim checking even though he’s not sup-posed to). We also observe that notifications and filling time in the case of Harry can encourage him to travel to another place when there are bird sightings: “if there’s something around locally or whatever and I’ll go off ”.
Time out from mobile technology
For some, using their device less and getting away from tech-nology was seen as a necessary part of their everyday life. Amanda actively avoids technology in her own time: “I’m not a slave to technology, erm I use it at work ’cause I have to, I can download, I love the fact you can have information at your fingertips but I don’t want to be on it at the end of the
night”. Figure 1 shows Amanda’s overall device use decline
in the evening (18:00–23:00), with her leisure practices of dancing, walking and reading normally involving no digital technology. Bob’s work involves using a desktop computer, so he feels the need to take breaks from digital technology in the week; this explains his relatively low evening device use in comparison to other participants (Figure 1). He described how he goes for walks during his lunch break, often not using his smartphone at all. Similarly to Bob, Holly mentioned that reading from her tablet is the“last thing you kind of wanna do”when spending all day looking at a computer screen.
Although Victoria takes her phone everywhere she goes, and uses it throughout the day, she still likes time without her phone:“at night time I try and just leave it, erm if I’m com-municating with someone I’ll probably be on Facebook and then I’ll just try and have like rest from my phone cause I’ve
had it with me all day”. For Harry, his variation revolved
around his weekend hobbies, leading him to not use his smart-phone on Saturday mornings due to him being“out bird ring-ing”(attaching tags to wild birds).
Adapting to space and context
The spaces which the participants inhabit create variation in their device use. For example, at work, Amanda has no cel-lular reception, so there is little point checking her phone. If Amanda wants to use her phone she has to go outside,
other-wise“if anybody needs me 9–5 they phone [her workplace]”.
For the tablet users, use was influenced by connectivity. Holly recently had no Internet connection at home, so her tablet’s involvement in notable categories of demand was reduced (Table 1). She described how she planned her tablet use in ad-vance, i.e. pre-loading content (e.g. reading for work, videos), to use it at home. Xander also habitually pre-loads his tablet with videos, games, maps and work materials when he knows he’ll be without connection for longer time periods. Despite this, Xander occasionally tethers his tablet with his phone when there is no Wi-Fi, and will stream video content from his home server while travelling. He described how he tends to use his tablet in spaces where he doesn’t want to get his laptop out, or physically move to his laptop or desktop PC.
Tim actively manages mobile data when he’s in spaces with-out Wi-Fi (e.g. when he’s using his phone as a sat-nav), yet leaves his Wi-Fi on all of the time unless his battery is run-ning low. Victoria is unable to access mobile Internet on her device, due to a suspected problem with her phone, and is therefore limited to using the Internet on Wi-Fi only.
We saw that space and availability of infrastructure can both influence and limit usage. Whilst time spent in a space where a device is available can lead to usage just because it’s there (e.g. Xander using his tablet when his laptop is out of reach), availability limitations (e.g. Amanda’s poor signal at work, Victoria’s faulty phone) can significantly decrease opportu-nities for data demand. Participants nimbly adapted to their limited availability of infrastructure, carrying out download-ing activities in places with connectivity before their period of no connectivity (e.g. Holly pre-loading to use her tablet at home, Xander pre-loading to use his tablet whilst travelling).
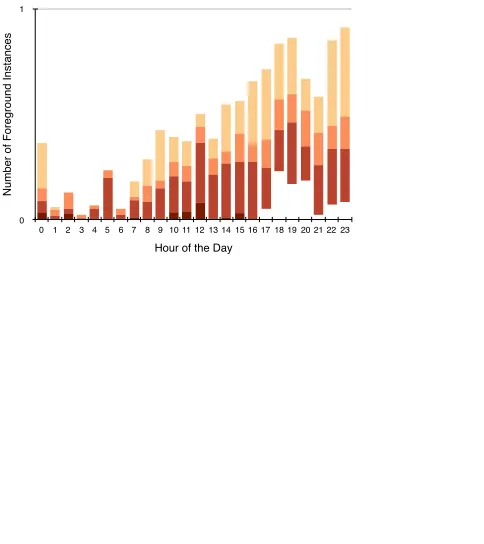
INSIGHTS FROM ATLANTIC ARCHIPELAGO
The data gathered from Eight Participants gives us a detailed account of Android device use in everyday life, and data de-mand and time use of associated practices. Drawing on quan-titative data collected from Atlantic Archipelago, we now ex-tend our analysis to a larger set of“common”Android device users to observe to what extent there are similarities and dif-ferences at a more representative scale.
The data demand for social networking and communication were continuous through the day (Figure 5b). Social network-ing is the more data demandnetwork-ing of the two with mean data demand of approximately 1.1MB/hour, around 700KB/hour more data intensive than communication (p < 0.01)7. The
data demand for social networking is comparatively high to other practices in Atlantic Archipelago, yet still lower than
7We use pair-wise two-sample and k-sample permutation tests to
N
u
mb
e
r
o
f
F
o
re
g
ro
u
n
d
I
n
st
a
n
ce
s
0 0.3
Hour of the Day
0 1 2 3 4 5 6 7 8 9 10 11 12 13 14 15 16 17 18 19 20 21 22 23
Watching (239) Social Networking (249) Communication (282) Listening (197)
(a) the hourly number of foreground instances for categorised apps
D
a
ta
D
e
ma
n
d
(KB)
0 1,500 3,000 4,500 6,000
Hour of the Day
0 1 2 3 4 5 6 7 8 9 10 11 12 13 14 15 16 17 18 19 20 21 22 23
Watching (345) Social Networking (331) Communication (347) Listening (321)
[image:8.612.54.295.64.334.2](b) the hourly data demand of categorised apps
Figure 5: The distribution of time use and data demand hourly across the notable categories for Atlantic Archipelago. Note that communication apps are often in the foreground and are used extensively during waking hours, but exhibit a fairly continuous 24hr data demand (3% of overall demand). Watching time use is comparatively less frequent, but exhibits high data demand intensity when it is (21%). Listening to audio (11%), which was uncovered and featured extensively in our Atlantic Archipelago, is almost triple communication demand and surprisingly nearly half of watching related demand.
that observed in Eight Participants for the same practice, with less pronounced social networking demand peaks (e.g. 08:00, 13:00) (Figures 2b and 5b). This was the opposite for the communication demand from the Atlantic Archipelago de-vices, where the hourly demand for this category is higher on average throughout the day (Figures 2b and 5b). The differ-ences in demand for these two categories could be due to the differences in app time use between the two datasets. Com-munication apps were used more in the morning and early af-ternoon (09:00–14:00) for Atlantic Archipelago devices (Fig-ure 5a), and whilst social networks were used slightly more by Atlantic Archipelago devices at specific times of the day (06:00) (Figure 5a), they were used less regularly throughout the day than the Eight Participants devices (Figure 2a).
[image:8.612.320.561.64.197.2]Despite the regular, hourly use of communication apps dis-covered with the Atlantic Archipelago devices, traditional modes of communication were still used throughout the day (Figure 6). In fact, SMS and phone calls dominated the com-munication use for all hours of the day; this corresponds for most hours with the Eight Participants devices.
Watching remains the most data demanding practice with mean data use of 2.8MB/hour, 1179KB/hour more than the next most demanding practice, “listening” at 1.6MB/hour
N
u
mb
e
r
o
f
U
se
s
0 1
Hour of the Day
0 1 2 3 4 5 6 7 8 9 10 11 12 13 14 15 16 17 18 19 20 21 22 23
Communication (282) Phone Calls (354) SMS Received (341) SMS Sent (331)
Figure 6: The distribution of communication time use hourly for Atlantic Archipelago. Hourly communication use consists of the number of: SMS sent and received, phone calls, and times communication apps were in the foreground.
(p < 0.01). Here we observe both differences and similar-ities between the two datasets. Although there are peaks of watching demand around midnight for both sets of devices, the top watching data demand peaks for Atlantic Archipelago devices are lower (e.g. 23:00–00:00) (Figure 5b). Adding to this, the overall demand through the day is much higher and more continuous (Figure 5b), rather than with obvious peaks and troughs (Figure 2b). Whilst the two datasets differ in watching time use throughout the day, evening watching (17:00–00:00) is a popular activity for both Eight Participants (Figure 2a) and Atlantic Archipelago (Figure 5a).
As no online dating app was installed on 50 or more devices, we were unable to analyse this category. However, we can say that while the category might have comparable demand to social networking for those who participate in it (as with Harry and Mark), Atlantic Archipelago indicates that it is a less common activity as compared to others (e.g. watching). Further contrasting to Eight Participants is the category of “listening”. This is significantly more demanding in Atlantic Archipelago with a mean data demand of 1.6MB/hour, using even more data than social networking for most hours of the day (Figure 5b). According to our statistical analysis, listen-ing uses on average 500KB/hour more data than social media (p<0.01). Whilst this category is demanding, it’s associated time use is extremely small (Figure 5a); this is most likely due to the ability of apps associated with listening to run in the background whilst other apps are in the foreground dur-ing use. Whilst seven of the Eight Participants did listen to music on their devices (all except Amanda), this only con-tributed to 0.37% of their total data demand, with Tim alone contributing to 97% of this demand due to his use of Spotify and TuneIn Radio. The low demand from the remaining par-ticipants is due to the use of offline media stored on devices rather than streamed, with participants occasionally transfer-ring their audio files from external storage via apps (Victoria through Dropbox), via cable (Mark, Xander) and syncing to local devices through Wi-Fi (Xander).
D
a
ta
D
e
ma
n
d
(KB)
0 750 1,500 2,250 3,000
Hour of the Day
0 1 2 3 4 5 6 7 8 9 10 11 12 13 14 15 16 17 18 19 20 21 22 23
Background Processes and Services (349) Software and Application
Updates (267) Storage, Backups and
[image:9.612.52.293.63.187.2]Transfers (348)
Figure 7: The distribution of data demand hourly across the
“hidden demand”categories for Atlantic Archipelago. Notably, background processes’ demand is greater in the evening, and does not exploit“off peak”hours.
throughout the day, with troughs (04:00 for updates, 05:00 for backups) and peaks (23:00 for updates, 20:00 for backups) (Figure 7). This increased evening demand for backups cor-responds with Eight Participants (Figure 4). Interestingly, the data demanded by background processes is significantly more throughout the day for a typical Atlantic Archipelago device (Figure 7) than an average Eight Participants device (Fig-ure 4); this is particularly the case at 00:00, 09:00 and 20:00. As a result, background processes contributed to 10% of the overall daily aggregate demand for Atlantic Archipelago. Clearly care is required when drawing inferences across datasets collected with different cohorts, such as our forma-tive and Atlantic Archipelago datasets. Yet we note that sim-ilar categories of demand to those we identify in both our datasets have also been observed independently by others. Sandvine show that real-time entertainment and social net-working are both top 5 composers of peak period traffic in Europe via fixed and mobile access, with communications also making the top 5 for mobile access [30]. Furthermore, Ericsson have reported that mobile data traffic will increase by 55% for video, 41% for social networking, and 37% for audio from 2015–2021, estimating that video will dominate at 70% of overall mobile traffic in 2021 [8]. Thus, we suggest that these trends of data demand we observe, are undeniably present in everyday practices at significant scale.
DISCUSSION
In this section we discuss the implications of the study find-ings, focusing on how HCI researchers and practitioners can adapt apps and services to reduce their data demand impacts.
Targeting the four big areas of data intensity
Half of the overall daily aggregate data demanded by Atlantic Archipelago was due to watching (21%), listening (11%), so-cial networking (8%), and background processes (10%). This demand roughly corresponds to 30 Wh of daily infrastructure energy consumption per device. Thus, we identify these four app categories as specific targets for data demand reduction. In line with reports of European aggregate data [30], we find that watching is the most demanding category for Atlantic Archipelago. This is particularly the case for late evenings (22:00-00:00) (Figure 5b)—just after traditional prime time viewing and before bedtime. Listening is also a crucial cat-egory to target due to its high hourly demand (Figure 5b).
Notably, listening demand peaks at lunchtime, and at 08:00 and 18:00, i.e. times at which people may be commuting to and from work whilst listening to their device (both Bob and Xander mentioned they listen to music whilst driving). While it helps that services such as BBC iPlayer and Spotify imple-ment the“nudge”approach (i.e. defaulting to lower quality streams) described by Preist et al. [24], we would point out that it is also thesheer number of devices demanding these services(345 or 87% for watching; 321 or 81% for listening) and the time invested in evening watching (Figures 2a and 5a) that are important to focus on. We also draw attention to the fact that the demand for watching and listening is still signifi-cant during non-waking hours (02:00–06:00); this shows that the data demand for these categories may not always neces-sarily be triggered by users, or may continue when they are asleep.
As we saw in Atlantic Archipelago (Figure 5a), others have observed that social apps are used less frequently (4.77% to-tal app launches) than communication apps (49.5%) [4]. De-spite this, the category of social networking leads to signifi-cantly higher energy demand than communication, and does so consistently throughout the day (Figure 5b). With rich me-dia increasingly designed into social apps, such as picture-enhanced feeds and the auto-playing of shared videos and ad-verts, we amplify calls for reconsideration towards slow de-sign [12, 35]. In addition to this, we propose that social me-dia apps be designed in a way which forces users to“work” for their rich media, e.g. through reducing media previews or increasing the number of access levels to such content; this may dissuade users from simply viewing media just because it’s easily accessible (rather than particularly important), and therefore address this data intensive category. Our conversa-tions with the Eight Participants indicated that there was of-ten little meaning or utility ascribed to the automated picture feeds, and video adverts common to many social media apps.
Whilst watching, listening, and social networking are relat-able to a number of areas of everyday practice, the demand from background services isdesigned into the operating sys-tem of devices. In fact, based on the app names in this cate-gory, these do not seem to support any particular activity or service. This background traffic has been observed in pre-vious work highlighting the differences in users’ smartphone usage [9], where the percentage of data received during ac-tive device use varied from 10–90% of overall data received. Whatever this demand is actually for, it is significant through-out the day (Figure 7). We call for further exploration into the demand from background processes to understand where and how it arises, and how we can design devices to avoid this system-initiated (rather than practice-supportive) demand.
SMS: A ready opportunity for lowering demand
device; this is 10 times the energy consumed for SMS at 0.2 Wh per day on average. By shifting the many simple text messages back to SMS or low-overhead instant messaging (as opposed to apps augmented with adverts and videos), we be-lieve that energy consumption in the communication category has the most straightforward potential to decrease.
Emphasising and going beyond Lord et al.’s suggestion to leverage traditional but lower impact phone services [19], our quantification of SMS use and communication apps sug-gests designers and systems architects should exploit the current utilisation and familiarity with simple SMS texting. Through design we can make it more convenient for users to switch between communication methods, in particular target-ing times of day when communication app use peaks (e.g. 20:00 for Eight Participants, 18:00 for Atlantic Archipelago); this would enable the same end-goal for users at a lower en-ergy impact. We also suggest that SMS and MMS services be revised to better suit the phone user today, such as by send-ing photos at a lower cost to the subscriber, catersend-ing better for group messages, and by informing users that their sent mes-sages have been received—all reasons why some of our Eight Participants used communication apps.
Shift and reduce peak demand
The energy consumed at peak times on the electricity grid tends to have higher carbon intensity. And as Sandvine point out [29], network operators use peak demand to plan their capacity. Building infrastructural capacity, itself, causes en-ergy consumption and carbon emissions. Watching, social networking, communication and listening were all demand-ing data by Atlantic Archipelago devices in peak electricity demand hours of 16:00–20:00 (Figure 5b). Both watching and listening were particularly demanding, with pronounced peaks at 18:00 for listening, and 19:00 for watching (Fig-ure 5b); this corresponds with“real-time entertainment” be-ing the top peak aggregate traffic category for Europe (fixed and mobile access) in 2015 [30]. In addition to this, the data demand from updates, backups and background processes is notably significant within these peak hours, particularly at 19:00 for background processes (Figure 7).
Previous work discusses how services should be designed to “reduce or avoid usage of infrastructure at peak times”, fo-cusing on the use of technology to shift users’ demand off peak [24]. With low levels of data demand during the early morning (03:00–05:00), we highlight that the peak demand for categories which do not require synchronous use (e.g. up-dates, backups and pre-downloads for watching) could easily be shifted to this time period for demand balancing. However, we argue that automatic shifts of demand off peak may not be the best strategy to reduce demand overall. The Eight Partic-ipants qualitative data shows that people already adapt to re-duced accessibility of infrastructure and anticipated times of slow connectivity, either by manually pre-downloading con-tent, or by simply avoiding device usage altogether in spe-cific locations and times. Given this, we suggest that HCI researchers and designers look for ways to engage users to transition their practices in less energy-intensive directions, while maintaining the meaning and utility of everyday prac-tice. Examples include coordinating with others to enjoy
programmes together, listening to locally-stored or cached music, and developing special, celebratory times (weekly or monthly) to more fully appreciate streamed media, rather than binge-watching.
Breaks from technology as the filler of time
Countering the blurring of practices and filling time high-lighted by both Røpke and Christensen [28], we have found that some of our participants actively take breaks from their technology, particularly in the evenings. This reveals how the prevalence of digital technologies in daily life can cause some users to disengage with their mobile devices. With growth in both device ownership and data demand, we must consider possible transitions to a future in which digital technologies aren’t the default filler of time.
Previous work in HCI certainly interrogates whether services could promote healthier relationships with technology [24], or propose less demanding apps for filling time (e.g. e-reader apps) [19]. We suggest that HCI researchers and practition-ers engage uspractition-ers in reflection and experimentation on ways to spend time away from their device, and most specifically in instances where users feel like they have time to fill. This re-quires that we confront the dogma of“all-you-can-eat data” designed into apps, devices and infrastructures. However, with some of our participants seeing time away from their devices as a positive, and at times necessary, action in their everyday lives, the challenge of reducing the time use (and thus data use) of devices may be easier than expected.
CONCLUSION
In this paper we have presented an account of the data and thus energy impacts associated with the use of mobile appli-cations in support of everyday practices—with special con-sideration to patterns of time use and data demand on An-droid devices. Based on our quantitative exploration of 398 participants’ logs of mobile device use, correlated with de-tailed accounts of how time use and data demand relate to practices for 8 participants; we have identified the notable and most demanding categories of use (watching, online dating, listening, social networking and communication) alongside updates, backups and background processes. We characterise and relate the data demands of these practices across the hours of the day. From this, we are able to contribute new implica-tions for HCI towards reducing the data demand by mobile device use beyond the device itself. These include: targeting watching, listening and social networking at particular times of the day; making the most of existing competencies with SMS; helping people transition to reduced consumption of services at times of peak demand; and building futures where time is filled in a positive and relaxing way, through the ded-icated absence of mobile technologies.
ACKNOWLEDGEMENT
We would like to thank all of our participants for their co-operation and the many contributors to the Device Analyzer project. We are grateful to the EPSRC for their financial sup-port (grant number W95738G). We have made data related to the paper available online: http://dx.doi.org/10.17635/
lancaster/researchdata/125. Due to the sensitive nature
REFERENCES
1. Morgan G Ames. 2013. Managing mobile multitasking: the culture of iPhones on stanford campus. In
Proceedings of the 2013 conference on Computer
supported cooperative work. ACM, 1487–1498.
2. Oliver Bates, Mike Hazas, Adrian Friday, Janine Morley, and Adrian K. Clear. 2014. Towards an Holistic View of the Energy and Environmental Impacts of Domestic Media and IT. InProc. CHI. 10.DOI:
http://dx.doi.org/10.1145/2556288.2556968
3. Mike Berners-Lee. 2011.How bad are bananas?: the carbon footprint of everything. Greystone Books.
4. Matthias B¨ohmer, Brent Hecht, Johannes Sch¨oning, Antonio Kr¨uger, and Gernot Bauer. 2011. Falling asleep with Angry Birds, Facebook and Kindle: a large scale study on mobile application usage. InProceedings of the 13th international conference on Human computer
interaction with mobile devices and services. ACM,
47–56.
5. Marshini Chetty, Richard Banks, A.J. Brush, Jonathan Donner, and Rebecca Grinter. 2012. You’re capped: understanding the effects of bandwidth caps on broadband use in the home. InProc. of CHI. 10.DOI:
http://dx.doi.org/10.1145/2207676.2208714
6. Cisco. May 29, 2013.Cisco Visual Networking Index:
Forecast and Methodology, 2012–2017. Technical
Report.
7. Ericsson. June 2015.Europe: Ericsson Mobility Report Appendix. Technical Report. Ericsson.
8. Ericsson. June 2016.Ericsson mobility report.Technical Report. Ericsson.
9. Hossein Falaki, Ratul Mahajan, Srikanth Kandula, Dimitrios Lymberopoulos, Ramesh Govindan, and Deborah Estrin. 2010. Diversity in smartphone usage. In Proceedings of the 8th international conference on
Mobile systems, applications, and services. ACM,
179–194.
10. Denzil Ferreira, Jorge Goncalves, Vassilis Kostakos, Louise Barkhuus, and Anind K Dey. 2014. Contextual experience sampling of mobile application micro-usage. InProceedings of the 16th international conference on Human-computer interaction with mobile devices &
services. ACM, 91–100.
11. Silke Gegenbauer and Elaine M. Huang. 2012. iPods, Ataris, and Polaroids: A Personal Inventories Study of Out-of-use Electronics in Swiss Households. InProc.
UbiComp. 5.DOI:
http://dx.doi.org/10.1145/2370216.2370294
12. Barbara Grosse-Hering, Jon Mason, Dzmitry Aliakseyeu, Conny Bakker, and Pieter Desmet. 2013. Slow design for meaningful interactions. InProceedings of the SIGCHI Conference on Human Factors in
Computing Systems. ACM, 3431–3440.
13. Kristin Hanks, William Odom, David Roedl, and Eli Blevis. 2008. Sustainable millennials: attitudes towards
sustainability and the material effects of interactive technologies. InProc. of CHI. 10.DOI:
http://dx.doi.org/10.1145/1357054.1357111
14. Lorenz M Hilty. 2011.Information technology and sustainability: Essays on the relationship between
information technology and sustainable development.
BoD–Books on Demand.
15. Roland Hischier, Vlad C Coroama, Daniel Schien, and Mohammad Ahmadi Achachlouei. 2015. Grey energy and environmental impacts of ICT hardware. InICT Innovations for Sustainability. Springer, 171–189.
16. Simon L Jones, Denzil Ferreira, Simo Hosio, Jorge Goncalves, and Vassilis Kostakos. 2015. Revisitation analysis of smartphone app use. InProceedings of the 2015 ACM International Joint Conference on Pervasive
and Ubiquitous Computing. ACM, 1197–1208.
17. Fahim Kawsar and A.J. Bernheim Brush. 2013. Home computing unplugged: why, where and when people use different connected devices at home. InProc. UbiComp.
10.DOI:
http://dx.doi.org/10.1145/2493432.2493494
18. Gilly Leshed and Phoebe Sengers. 2011. “I Lie to Myself That I Have Freedom in My Own Schedule”: Productivity Tools and Experiences of Busyness. In Proceedings of the SIGCHI Conference on Human
Factors in Computing Systems (CHI ’11). ACM, New
York, NY, USA, 905–914.DOI:
http://dx.doi.org/10.1145/1978942.1979077
19. Carolynne Lord, Mike Hazas, Adrian K. Clear, Oliver Bates, Janine Morley, and Adrian Friday. 2015. Demand in my pocket: mobile devices and the data connectivity marshalled in support of everyday practice. InProc. CHI.
20. Gloria Mark, Stephen Voida, and Armand Cardello. 2012. A pace not dictated by electrons: an empirical study of work without email. InProceedings of the SIGCHI Conference on Human Factors in Computing
Systems. ACM, 555–564.
21. Ofcom. 2015.Connected Nations Report 2015. Technical Report.
22. Ofcom. December 2014.Infrastructure Report 2014: Ofcom’s second full analysis of the UK’s
communications infrastructure. Technical Report.
Ofcom.
23. Antti Oulasvirta, Sakari Tamminen, Virpi Roto, and Jaana Kuorelahti. 2005. Interaction in 4-second bursts: the fragmented nature of attentional resources in mobile HCI. InProceedings of the SIGCHI conference on
Human factors in computing systems. ACM, 919–928.
24. Chris Preist, Daniel Schien, and Eli Blevis. 2016. Understanding and Mitigating the Effects of Device and Cloud Service Design Decisions on the Environmental Footprint of Digital Infrastructure. InProceedings of the 2016 CHI Conference on Human Factors in Computing
25. C. Preist and P. Shabajee. 2010. Energy Use in the Media Cloud: Behaviour Change, or Technofix?. In Cloud Computing Technology and Science (CloudCom),
2010 IEEE Second International Conference on.
581–586.DOI:
http://dx.doi.org/10.1109/CloudCom.2010.40
26. Christian Remy, Silke Gegenbauer, and Elaine M. Huang. 2015. Bridging the Theory-Practice Gap: Lessons and Challenges of Applying the Attachment Framework for Sustainable HCI Design. InProceedings of the 33rd Annual ACM Conference on Human Factors
in Computing Systems (CHI ’15). ACM, New York, NY,
USA, 1305–1314.DOI:
http://dx.doi.org/10.1145/2702123.2702567
27. Neil Robinson, Jon Freeman, Jan Gaspers, Veronika Horvath, Tess Hellgren, and Alex Hull. 2014. Living Room Connected Devices. (2014).
28. Inge Røpke and Toke Haunstrup Christensen. 2012. Energy impacts of ICT – Insights from an everyday life perspective.Telematics and Informatics29, 4 (2012).
29. Sandvine. 1h 2014.Global internet phenomena report. Technical Report. Sandvine Incorporated ULC.
30. Sandvine. 2015.Global internet phenomena report.
Asia-Pacific and Europe. Technical Report. Sandvine
Incorporated ULC.
31. Daniel Schien, Vlad C Coroama, Lorenz M Hilty, and Chris Preist. 2015. The energy intensity of the Internet: edge and core networks. InICT Innovations for Sustainability. Springer, 157–170.
32. Daniel Schien and Chris Preist. 2014. A review of top-down models of internet network energy intensity. In ICT for Sustainability 2014 (ICT4S-14). Atlantis Press.
33. Daniel Schien, Paul Shabajee, Mike Yearworth, and Chris Preist. 2013. Modeling and Assessing Variability in Energy Consumption During the Use Stage of Online Multimedia Services.Journal of Industrial Ecology (2013), n/a–n/a.DOI:
http://dx.doi.org/10.1111/jiec.12065
34. A. Fleming Seay and Robert E. Kraut. 2007. Project Massive: Self-regulation and Problematic Use of Online Gaming. InProceedings of the SIGCHI Conference on
Human Factors in Computing Systems (CHI ’07). ACM,
New York, NY, USA, 829–838.DOI:
http://dx.doi.org/10.1145/1240624.1240749
35. Phoebe Sengers. 2011. What I learned on Change Islands: reflections on IT and pace of life.interactions 18, 2 (2011), 40–48.
36. Elizabeth Shove, Mika Pantzar, and Matt Watson. 2012. The Dynamics of Social Practice: Everyday life and how it changes. Sage.
37. Tapio Soikkeli, Juuso Karikoski, and Heikki Hammainen. 2011. Diversity and end user context in smartphone usage sessions. In2011 Fifth International Conference on Next Generation Mobile Applications, Services and Technologies. IEEE, 7–12.
38. Yolande A.A. Strengers. 2011. Designing eco-feedback systems for everyday life. InProc. of CHI. 2135–2144.
DOI:http://dx.doi.org/10.1145/1978942.1979252
39. Sherry Turkle. 2012.Alone together: Why we expect
more from technology and less from each other. Basic
books.
40. Niels van Berkel, Chu Luo, Theodoros
Anagnostopoulos, Denzil Ferreira, Jorge Goncalves, Simo Hosio, and Vassilis Kostakos. 2016. A Systematic Assessment of Smartphone Usage Gaps. InProceedings of the 2016 CHI Conference on Human Factors in
Computing Systems. ACM, 4711–4721.
41. Sha Zhao, Julian Ramos, Jianrong Tao, Ziwen Jiang, Shijian Li, Zhaohui Wu, Gang Pan, and Anind K Dey. 2016. Discovering different kinds of smartphone users through their application usage behaviors. In
Proceedings of the 2016 ACM International Joint
Conference on Pervasive and Ubiquitous Computing.