© 2019, IRJET | Impact Factor value: 7.211 | ISO 9001:2008 Certified Journal
| Page 2597
Diabetes prediction using machine learning
Sudhir Pal
1, Sandhya Chauhan
2, Meghal Aggarwal
31,2,3
B.Tech Student, Computer Science, ABES Institute of Technology, Ghaziabad, India
---***---Abstract -
Diabetes mellitus is one of the most serious health challenges everywhere in the world.The diabetes mellitus is a classification problem which uses a binary dataset for classification that does the analysis whether a patient is suffering from the disease or not on the basis of different features available in the dataset. For cleaning the data, feature extraction, feature engineering different methods and the procedures are used. And different data mining algorithms can be used for prediction on Pima Indians Diabetes Dataset.
This proposed method uses Support Vector Machine (SVM), a machine learning method as the classifier for diagnosis of diabetes. The experimental results showed that support vector machine can be successfully used for diagnosing diabetes disease which is giving the highest accuracy among any other algorithm that is tested on dataset in predicting whether the patient is suffering from diabetes or not. We have also compared the support vector machine algorithm with k-nearest neighbour and the decision tree.
Key Words: radial basis function.RBF
1.INTRODUCTION
Diabetes is one of the common and briskly increasing disease. It is found that the diabetes is a very severe problem
in most of the countries. Diabetes is a condition in which your body is unable to produce the required amount of
insulin which is needed to regulate the amount of sugar in the body. This may lead to various diseases like heart
disease, kidney disease, blindness, nerve damage etc. Basically it is found out that there are two general reasons for
diabetes:
(1) The pancreas does not produce enough amount of insulin or the body is not able to produce adequate insulin.
This kind of problem come under Type-1 diabetes problem.
(2) Cells do not respond to the insulin that is produced is come under the Type-2 diabetes problem. Insulin is the
most important hormone that regulates uptake of glucose from the blood into most cells (including the muscle and
fat cells). If the amount of insulin present in the body is insufficient, then glucose will have its unusual effect so that
glucose will not be absorbed by the body cells that require it. Detection and diagnosis of diabetes at an early will
help the patient to get the early treatment. This will be helpful in preventing the further harm.
2.
DIABETES DISEASE DATASET
© 2019, IRJET | Impact Factor value: 7.211 | ISO 9001:2008 Certified Journal
| Page 2598
It is found that five patients had a glucose of 0, 28 patients had a diastolic blood pressure of 0, 11 patients more had a body mass index of 0, 192 others had skin fold thickness record of 0, and 140 patients had serum insulin levels of 0. After the deletion ,it is found that there were 460 cases with no missing values.Fig -1: Diabetes Dataset
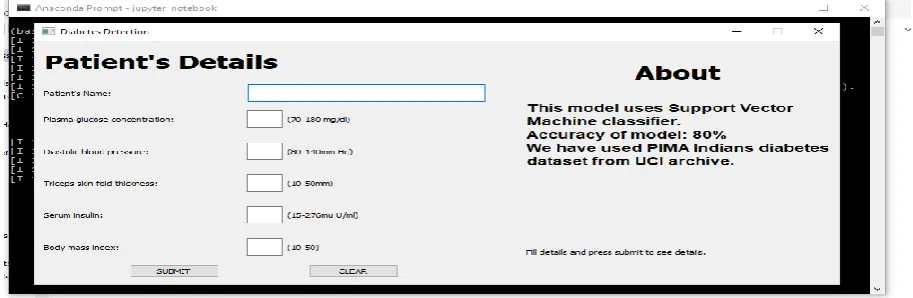
3. GRAPHICAL USER INTERFACE OF THE DIABETES DETECTION SYSTEM
This GUI of the Diabetes Detection System consist of the following fields: 1:patients Name 2. Glucoselevel 3. Bloodpressure 4. SkinFold thickness 5. Serium insulin 6. Bodymass index. The patient will enter the above mentioned detailed and will click on the submit button, then the patients detailed will get displayed. Basedon the information entered by the patient,the system will predict whether the patient is diabetes or not. This diabetes detection system will make use of the support vector machine algorithm running in the backend. This support vector machine algorithm is making prediction with 80% of the accuracy,which is giving the best result among other mining algorithm.
Fig -2: GUI of Diabetes prediciton system
4. METHODOLOGY
4.1
Experimental Classification [image:2.595.70.527.523.672.2]© 2019, IRJET | Impact Factor value: 7.211 | ISO 9001:2008 Certified Journal
| Page 2599
Fig -3: Architecture of the proposed modelThe diabetes dataset is divided into two parts such that some randomly samples are chosen from the Diabetes dataset, known as training data and they are trained using the SVM Model. And then the remaining other samples are known as the testing data, and here the actual prediction is performed using this testing data.The entire code is performed in python and machine learning concepts are also used. In the proposed model we have divided the entire dataset into 80:20 ratio. 80% of the dataset data is used for the training purpose so known as the training data. And 20% of the data is known as the testing data. on the training dataset we are getting the accuracy of 76% while on the testing data we are getting the accuracy of 80.5%.
4.2 Support Vector Machine Algorithm
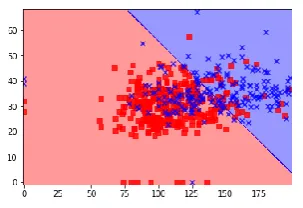
SVM is very popular and widely used supervised learning classification algorithm. An advantage of using this algorithm is that it can operate in even infinite dimension. SVM finds a hyperplane that leads to a homogeneous partition of data. A good separation is achieved by the hyperplane that has largest distance to the nearest training datapoints of any class .so we have to maximize the margin .The margin is defined as the distance between the separating the hyperplane(decision boundary) and the training samples that are closed to the hyperplane which are called the support vectors. The reason behind having decision boundaries with the larger margin is that they tend to have a low generalization error(prediction errors) whereas the models with smaller margins are more prone to the overfitting. We use the parameter ‘c’ to control the width of the margin.For larger value of ‘c’,the optimizer will choose a smaller margin hyperplane even if that hyperplane does a better job of getting all the remaining points classified correctly. A very small value of ‘c’ will cause the optimizer to look for a larger margin separating hyperplane, even if that hyperplane misclassified some points.
Chart -1: when kernel = Linear Chart -2: when kernel=’RBF’
[image:3.595.43.195.549.653.2]© 2019, IRJET | Impact Factor value: 7.211 | ISO 9001:2008 Certified Journal
| Page 2600
Gamma: is a parameter of the RBF kernel and can be thought of as the spread of the region. When the value of the gamma is low then the curve of the decision boundary is very low and thus leading to the decision region is very broad. When the gamma is high, the curve of the decision boundary is high which creates island of decision boundaries around the data points.4.3 K NEAREST NEIGHBORS ALGORITHM
KNN is a supervised machine learning algorithm , or also popular and known as the lazy learning ,because it
doesn’t use the training data at the time of training ,it directly make use of testing data .The k-NN algorithm is the
simplest among all machine learning algorithms .When the size of the dataset is very less so it can easily classify .It
does not perform well with the large dataset.
4.3.1 How this KNN algorithm works
The data which we need to classify to which is class it will belong is known as the test data. let suppose star is the test data, let we need to find out to which class it will belong, whether it may belong to the red circles or the green squares. For the classification purpose ,k value will be used .and k represent the neighbours around the test data. value of the k will be the odd no. let in above example the value of k is chosen as three. It will find out the three nearest neighbours around the test data with the help of calculating the distance between test data and nearest data using Euclidian distance formula.
KNN algorithm has many disadvantages like it has high computation costs it has to calculate the distance between test data to nearest neighbours Test data will always belong to those class which has high majority of particular class in nearest neighbour. It has disadvantage like it gives low accuracy in multidimensional dataset .it uses the closest point for predicting to which class it will belong, which is found not to be an effective mechanism.
Chart -3: Shows positive correlation
From the above figure we got to know that the following pairs had a positive correlation coefficient between them as compared to the other parameters:
1) Pregnancies and Age
2) Insulin and Skin thickness
3) BMI and Skin thickness
© 2019, IRJET | Impact Factor value: 7.211 | ISO 9001:2008 Certified Journal
| Page 2601
In our proposed model we divided the entire dataset into 80:20.here 80% of the data is for training and 20% of the data is for testing. When knn algorithm is performed on the dataset, testing the training dataset got an accuracy of 79% and while performing the testing on test data got an accuracy of 78%.Chart -4: Graph between accuracy and neighbour chosen
With this above graph we can conclude that on increasing the value of k, , i.e the nearest neighbour around the test point are larger in no, then it would be leading to higher accuracy which is beneficial to decide to which class it belongs to.
4.4 Decision Tree
A decision tree is like support tool that uses a tree model for decisions making and their possible consequences, it is a method that illustrates every possible outcome of a decision. We have created the decision tree by using the graphviz module in python. It is the way which represents an algorithm that contains only conditional control statements. Advantage of using the decision tree is that in very large size of dataset ,it can easily classify the data. We divided the complete dataset in 80:20 ratios. In our proposed model, on the training data accuracy is 81.8% and on the test data the accuracy is 76.6%. To have a confirmation on the best features present in diabetes dataset using Decision Tree. We also plotted the feature importance plot and found that Glucose and BMI to be the leading and the important parameter present.
Fig -4: Feature importance plot Fig -5: Decision tree
5. CONCLUSIONS
© 2019, IRJET | Impact Factor value: 7.211 | ISO 9001:2008 Certified Journal
| Page 2602
REFERENCES
[1] Cortes, C., Vapnik, V., “Support-vector networks”, Machine Learning, 20(2),pp. 273-297, 1995.
[2] Polat, Kemal and Salih Gunes, “An expert system approach based on principal component analysis and adaptive neurofuzzy inference system to
diagnosis of diabetes disease,” Expert system with Applications, pp. 702-710, Elseivier, 2007.
[3] I.Tsoulos, D. Gavrilis, E. Glavas,- “Neural network construction and training using grammatical evolution”, Science Direct Neurocomputing
Journal, Vol.72, Issues 13, December 2008,pp. 269-277.
[4] “Feature selection and classification model construction on type 2 diabetic patients‟ data”, Journal of Artificial Intelligence in Medicine, pp
251262, Elsevier, 2008.
[5] Yue, et al. “ An Intelligent Diagnosis to Type 2 Diabetes Based on QPSO Algorithm and WLSSVM,” International Symposium on Intelligent
Information Technology Application Workshops, IEEE Computer Society, 2008.
[6] Barakat,et al. “ Intelligible Support Vector Machines for diagnosis of Diabetes Mellitus.” IEEE Transactions on Information Technology in
Biomedicine, 2009.
[7] https://en.wikipedia.org/wiki/Bin_ary_classification
[8] https://www.webmd.com/a-to-zguides/body-mass-index-bmi-foradults