AbstrAct
Objective Cardiac resynchronisation therapy (CRT) is an
effective therapy for selected patients with heart failure (HF); however, a significant non-response rate exists. We examined current evidence on extracellular cardiac matrix (ECM) biomarkers in predicting response following CRT.
Methods Complete literature review of PubMed, Ovid
SP MEDLINE, Cochrane Library and TRIP, reference lists, international cardiology conferences and ongoing studies between December 1999 and December 2015 conducted according to prospectively registered study selection and analysis criteria (PROSPERO:CRD42016025864) was performed. All observational and randomised control trials (RCT) were included if they tested prespecified ECM biomarkers’ ability to predict CRT response. Risk of bias assessment and data extraction determined pooling of included studies was not feasible due to heterogeneity of the selected studies.
Results A total of 217 studies were screened; six (five
prospective cohort and one RCT substudy) were included in analysis with 415 participants in total. Study sizes varied (n=55–260), cohort characteristics contrasted (male: 67.8%–83.6%, ischaemic aetiology: 40.2%– 70.3%) and CRT response definitions differed (three clinical/functional, three echocardiographic). Consistent observation in all ECM biomarker behaviour before and after CRT implantation was not observed between studies. Lower type I and type III collagen synthesis biomarkers (N-terminal propeptides of type I and III procollagens) expression demonstrated replicated ability to predict reverse left ventricular remodelling.
Conclusion Collagen synthesis biomarkers offer the most
potential as ECM biomarkers for predicting CRT response. Heterogeneity between these studies was large and limited the ability to pool and compare results numerically. Use of different response definitions was one of the biggest challenges.
IntROduCtIOn
Cardiac resynchronisation therapy (CRT) is an effective therapy for selected patients with heart failure (HF).1 2 Current
guide-lines suggest that CRT is offered to those
with a left ventricular ejection fraction (LVEF) ≤35% with resting 12-lead ECG QRS duration ≥150 ms or 120–149 ms with Left Bundle Branch Block (LBBB) morphology and refractory to optimal medical therapy
(OMT).3 CRT reduces mortality and
improves morbidity, underpinned by reversal of pathophysiological adverse cardiac remodelling.1 2 Unfortunately, a significant
non-response rate of 20%–40% exists and has remained unchanged over the last decade, despite extensive research and investment.1 2
To cite: McAloon CJ, Ali D,
Hamborg T, et al. Extracellular
cardiac matrix biomarkers in patients with reduced ejection fraction heart failure as predictors of response to cardiac resynchronisation therapy: a
systematic review. Open Heart
2017;4:e000639. doi:10.1136/
openhrt-2017-000639
Received 9 April 2017 Revised 26 June 2017 Accepted 13 July 2017
1Department of Cardiology,
University Hospital Coventry, Coventry, UK
2Department of Medicine,
Warwick Medical School, University of Warwick, Coventry, UK
3Department of Life Sciences,
Coventry University, Coventry, UK
Correspondence to
Dr Faizel Osman; faizel. osman@ uhcw. nhs. uk
Extracellular cardiac matrix biomarkers
in patients with reduced ejection
fraction heart failure as predictors of
response to cardiac resynchronisation
therapy: a systematic review
Christopher J McAloon,1,2 Danish Ali,1,2 Thomas Hamborg,2 Prithwish Banerjee,1,2,3
Paul O'Hare,2 Harpal Randeva,2 Faizel Osman1,2
Key questions
What is already known about this subject?
► Cardiac resynchronisation therapy (CRT) is
associated with non-response in 20%–40% of selected patients with heart failure (HF). Selected vascular biomarkers are known to be associated with cardiac disease but it is unknown whether these can be used to predict CRT response.
What does this study adds?
► We performed a systematic review of all studies
examining vascular biomarkers in CRT. We found that collagen synthesis biomarkers have the most potential for predicting CRT response, particularly N-terminal propeptides of type I and III procollagens. Matrix metalloproteinases-2 and 9 have no conclusive predictive value and need further investigation.
How might this impact clinical practice?
► Use of vascular biomarkers to predict CRT
The extracellular cardiac matrix (ECM) is a dynamic support structure that remodels following cardiac injury and HF.4 5 Progressive ECM remodelling is closely linked
to HF severity and prognosis.4 5 Cardiac collagen turnover
alterations are central to the development and progres-sion of cardiac fibrosis and HF.5 Specific biomarkers
of type I and type III collagen synthesis (N-terminal propeptides of type I and III procollagens (PINP and PIIINP),6 7 carboxy-terminal propeptide of procollagen
type I (PICP))8 9 and degradation (carboxy-terminal
telo-peptide of type I collagen (ICTP or CITP))9 10 products
are associated with poor outcomes in HF. The proteolytic enzyme system matrix metalloproteinases (MMPs) and their regulators tissue inhibitors of MMPs (TIMPs) are involved in collagen degradation and have been impli-cated in HF development and progression.4 5 Specifically,
MMP-1,11 a collagenase, MMP-212 and MMP-9,13 both
gelatinases and TIMP-111 are associated with HF outcomes.
Galectin-3 (Gal-3) is a beta-galactoside-binding lectin released by activated cardiac macrophages, which are upregulated in HF, causing increased fibroblast prolifer-ation, collagen deposition and ventricular dysfunction.14
Gal-3 is strongly associated with inflammation and fibrosis with raised levels strongly predict poor HF outcomes.14
Turnover of ECM alters in HF and with reverse cardiac remodelling following CRT implantation may offer potential biomarkers for response prediction.15 This
systematic review examines the current evidence on the value of ECM biomarkers in predicting CRT response.
MetHOdOlOgy
Our systematic review was conducted according to the Preferred Reporting Items for Systematic Reviews and Meta-analysis (PRISMA) guidelines.16 It was
prospec-tively registered with PROSPERO (CRD42016025864), an international registry of systematic reviews. A protocol was designed and implemented prospectively in-line with PRISMA-P 2015.17
eligibility criteria
Strict eligibility criteria were applied to minimise hetero-geneity of included articles. Observational studies (prospective or retrospective) and randomised control trials (RCTs) (including substudies) were included; basic science and review articles were excluded. Included study populations represented patients with HF meeting international CRT implant guidelines.3 Studies had to
be conducted on adults (age ≥18 years). Articles were included if they examined an ECM biomarker previ-ously reported to predict HF outcomes.4 Baseline ECM
biomarkers, measured when patients were clinically stable prior to implantation, had to be compared with a predefined CRT ‘response’ criteria to evaluate their predictive value. Coronary sinus sampling and long-term trends in peripheral ECM biomarker behaviour were analysed if present.
A variety of clinical, functional or echocardiographic criteria and cardiovascular outcomes have been used to define CRT response in studies,18 which often correlate
poorly. All response criteria were included in the review. Cardiovascular outcomes could form part of a response definition or be presented separately; their absence was not an exclusion criterion.
database search strategies
Detailed searches were conducted on PubMed, Ovid SP MEDLINE, Cochrane Library (CENTRAL) and TRIP in February 2016 by one author (CM) and reviewed by another independently (DA). The search strategy used specific terms (cardiac resynchronisation therapy/ cardiac pacing/extracellular matrix) in combination, within titles/abstracts or Medical Subject Headings. Specific vascular biomarkers (‘TIMP’ ‘MMP’ ‘collagen’ ‘Myostatin’ ‘Syndecan-4’ and ‘Galectin-3’) were included in the search. A grey literature search involved searching the Clinical Trials database (www. clinicaltrials. gov) and international cardiology conferences (European Society of Cardiology, American Heart Association, American College of Cardiology) indexes for ongoing, abstracts and unpublished work. All included articles had their references searched for relevant publications. A date limitation of the last 15 years (31 December 1999– 31 December 2015) was applied. No language restrictions were applied.
Title and abstract reviews were performed inde-pendently (CM/DA), consensus on eligibility criteria was required to be taken forward to full paper review; any conflicts were decided by an independent reviewer (FO). Duplications of articles or cohort use were identified and only the most relevant (decided by consensus) taken forward. The Critical Appraisal Skills Programme check-list (dependent on study design) was applied to full paper review to guide evaluation of article quality.19 Consensus
had to be reached on full paper reviews before being selected for inclusion; where consensus was not reached a third reviewer (FO) made the final decision. Contact was attempted with all included article authors and any others at full paper review that were indicated.
data extraction and management
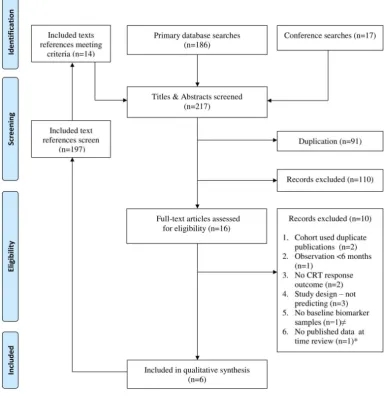
Figure 1 Flowchart of studies screening and selection. ≠Author contacted, poster presentation sent and no baseline extracellular cardiac matrix biomarker sample taken.22 *Clinical trial (NCT15019908) author contacted and manuscript in
preparation. CRT, cardiac resynchronisation therapy.
reviewers (CM/DA), a third independent reviewer (FO) resolved any disagreement.
Risk of bias assessment
Risk of bias for each study was assessed by two indepen-dent reviewers (CM, DA) utilising either the Risk of Bias Assessment Tool for Non-randomised Studies or the Cochrane Collaboration ‘Risk of Bias’ assessment tool.20 21
Both have established criteria to examine selection bias, exposure measurement, blinding and completeness of outcome data.20 21
data synthesis and analysis
A descriptive synthesis was performed to summarise find-ings of all selected articles. A meta-analysis of included study data for each specific ECM biomarker was not
possible due to heterogeneity of outcome definitions and study designs. Evaluation of study designs, defined outcomes and cohort characteristics was performed. The same biomarkers compared in different included articles were compared. Continuous variables were summarised using the same units for each variable in the original text. Data were presented as mean ± standard deviation (SD), unless specified otherwise.
Results
Figure 1 shows the screening and selection of published articles; 110 records were excluded after the screening stage as they did not meet inclusion criteria. Six articles met the inclusion criteria. Two abstracts22 23 and one clinical
taken to full review (for potential inclusion). Related arti-cles and information were sought, including contacting authors (all three kindly responded). None yet had arti-cles published and additional information provided led to exclusion from review (no baseline biomarkers taken22
or study design did not test biomarkers as predictors23).
study design
Five prospective cohort studies and one RCT substudy11
were included. Table 1 summarise the different study designs and CRT response outcome definitions used. Studies selected were published between 2008 and 2014. Risk of bias was assessed in each study using appropriate quality check tools. The lowest risk of bias was in the single RCT substudy.11 The prospective cohort studies
varied minimally in their bias assessment and none were excluded.
Garcia-Bolao et al9 stated that 61 participants were
consented; during the observation period there were four mortalities (three cardiac/one non-cardiac) and one functional assessment not performed at follow-up (6 min walk test not completed due to stroke). The cohort was 59 but no explicit statement about the two exclusions made. Lopez-Andres et al11 published a substudy in 2012 of the
‘The Effect of Cardiac Resynchronization on Morbidity and Mortality in Heart Failure’ (CARE-HF)1 RCT which
itself was published in 2005; interpretation of results is within this context. All studies included NYHA III–IV patients (mostly NYHA III). Two studies recruited NYHA II patients24 25 with one also requiring a bradycardia
pacing indication.24 All studies included QRS
dura-tion >120 ms, except Garcia-Bolao et al9 (QRS≥130 ms). In
the CARE-HF trial, those with QRS duration 120–149 ms needed dyssynchrony on echocardiography.1 8 All
trans-venous LV leads were implanted preferably to the most lateral position possible. Dong et al26 performed only
de novo CRT-defibrillator (CRT-d) implants. Three studies10 24 26 commented on right ventricular lead
place-ment with two26 explicitly aiming for the right ventricular
apex. In CARE-HF (and substudy), all had CRT-pace-maker (CRT-p) devices only.1 11 CRT response definitions
varied between included studies. Broadly, response defi-nitions used were classified as three clinical and three echocardiographic. Reported response rates varied between 48.9% and 71.8% (table 1).
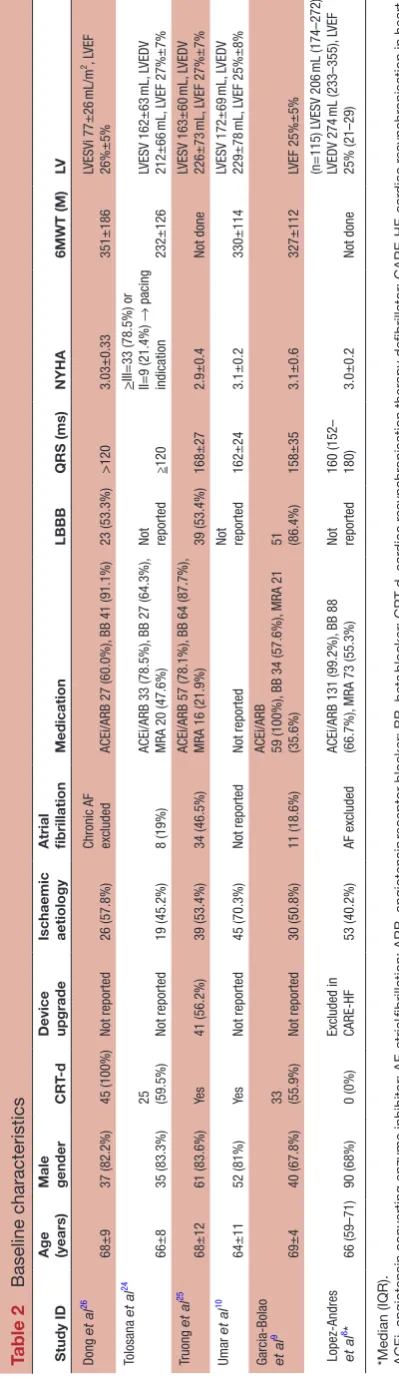
Baseline characteristics
The baseline characteristics of the patients are shown in table 2.
A total of 415 patients were included. The five prospec-tive observational studies had mean age of 67±10 years910
(Lopez-Andres et al8 excluded as presented as median
and IQR). There were 315 (75.9%) males in included studies, ranging 67.8%9–83.6%.25 There was large
varia-tion in frequency of CRT-d/CRT-p implants in each study with two not providing this data.10 25 One study included
a high proportion of device upgrades25; the CARE-HF
trial excluded upgrades,1 8 the remaining four studies
did not state upgrade status.9 10 24 26 Atrial fibrillation
(AF) was included in three prospective observational studies8 24 25; one did not report on AF or related
publi-cations.10 27 Precise QRS duration was not stated in two
studies.24 26 Reporting of LV volumetric data varied
between included studies. Three reported unadjusted LV end systolic volume (LVESV) and LV end diastolic volume (LVEDV) data which were similar to each other (table 3).10 24 25 Dong et al26 presented LVESV and LVEDV
volume indexed figures only. Garcia-Bolao et al9 provided
LVEF only. LVEF was compared between the five prospec-tive cohorts and showed similar mean LVEF between 25%–27%.9 10 24–26
Responder versus non-responders
Response status (responders vs non-responders (RvsNR)) was presented in four of the included studies.9 10 24 26
Truong et al25 did not provide characteristics of those
defined by response. Lopez-Andres et al8 outlined
char-acteristics by allocation to CRT-p versus OMT, however, not by response. There were some baseline characteristic differences between the four studies for RvsNR9 10 24 26;
Dong et al26 demonstrated differences between RvsNR
for LBBB status (15 (68.3%) vs 9 (39.1%), p=0.05) and ischaemic aetiology (9 (40.9%) vs 17 (73.9%], p=0.03). Tolosana et al24 reported lower creatinine levels in RvsNR
(1.25±0.3 mg/dL vs 1.76±0.8 mg/dL, p=0.01). Umar et al10 reported that responders were older and had longer
QRS duration than non-responders (age: 66±10 years vs 60±11 years, p=0.03; mean± standarderror QRS: 165±3 ms vs 135±8 ms, p=0.001). Notably, Hessel et al published a study using the same cohort as Umar et al and reported no difference in QRS duration for RvsNR (165±2 ms vs 153±3 ms, p=NS), suggesting one of these studies has recorded it incorrectly.10 27
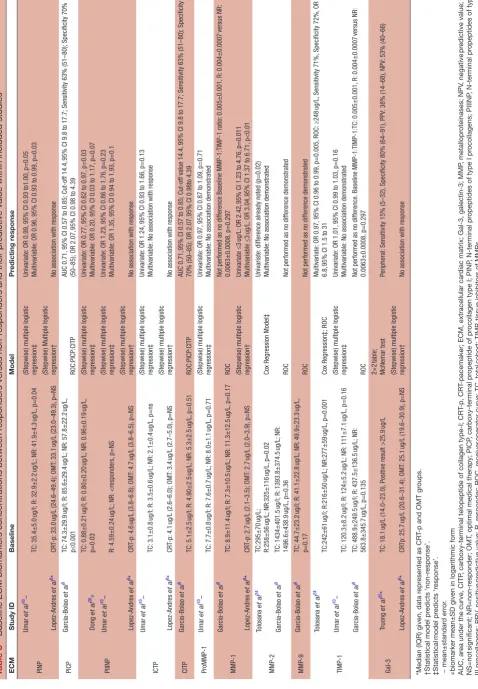
eCM biomarkers
All ECM biomarker baseline concentrations and magni-tude of association (if tested) are summarised in table 3. Lopez-Andres et al8 did not provide baseline
concentra-tions by response status, but comparison was made with the control group. Umar et al10 showed baseline results
for expression of ECM biomarkers studied. However, for PIIINP non-responders no baseline concentration was reported in the article, however no statistical significance is reported RvsNR.10
PInP/PICP
PINP and PICP share a 1:1 stoichiometric relationship with the collagen molecule; therefore, they were consid-ered together. Umar et al10 reported similar total cohort
means values to Lopez-Andres et al8 median values (the
skew of this data is unknown). Umar et al10 observed
higher PINP baseline level predicted poor response. Garcia-Balao et al9 reported the opposite for PICP.
Lopez-Andres et al8 observed no significant association
Table 1
Study designs and r
esponse outcome definitions
Study ID
Design
Participants recruited
HF/CR
T
participants
Inclusion criteria
Observation period
Assessments
ECM biomarkers
CR T r esponder definition Response rate Dong et al 26
Prospective obser
va
tional
65 (20 healthy controls)
45 LVEF≤35%, NYHA III–IV , QRS>120 ms, SR and OMT 6 months Baseline/3 months/6 months: NYHA, 6MWT , TTE, blood samples PIIINP ↓ ≥15%
LVESVi and sur
vived a t 6 months 22 (48.9%) Tolosana et al 24
Prospective obser
va
tional
55 (13 exc
luded after recruitment) 42 LVEF≤35%, NYHA III–IV , QRS>120 ms and
OMT or cardiac pacing indica
tion (L VEF<35%) 12 months Baseline/6 months/12 months: NYHA, QoL (MLHFQ), 6MWT , TTE, ECG, blood samples MMP-2, TIMP-1 ↑ >10% 6
MWT or if test not
performed
↑
>1
NYHA and sur
vived/
no heart transplant a
t 12 months 25 (59.6%) Truong et al 25
Prospective obser
va tional 73 73 LVEF<35%, NYHA II–IV , QRS≥120 ms, OMT , HF decompensa tion <12 months 24 months (IQR 20.4–24.0) Baseline: NYHA, ECG, TTE 1 month/3 months 6
months Clinical FU
Gal-3
Improvement HF c
linical composite
score
30 a
t 6 months 40 (54.7%) Umar et al 10
Prospective obser
va tional 64 64 LVEF<35%, NYHA III–IV , QRS>120ms 6 months Baseline/6 months: NYHA, TTE; QoL (MLHFQ), 6MWT
, blood samples
PINP , PIIINP , ICTP , proMMP-1, TIMP-1 ↓ ≥10% LVESV at 6 months 46 (71.8%) Garcia-Bolao et al 9
Prospective obser
va tional 61 59 LVEF≤35%, NYHA III–IV , LBBB, QRS≥130 ms, OMT 12 months Baseline/12 months: NYHA, QoL (ML WHFQ), 6MWT , TTE, ECG, blood samples PICP , CITP , MMP-1, MMP-2, MMP-9, TIMP-1 ↑ ≥10% 6
MWT and sur
vival from
cardiac mortality a
t 12 months 35 (59.3%) Lopez- Andres et al 8* Substud y
randomised control trial: CARE-HF 260 (CARE-HF cohort a
vailable) 132 (CR T-P only) LVEF<35%, NYHA III–IV , QRS>150 ms
or 120–149 ms with echocardiogra
phic dyssynchron y, OMT Substud y: 18 months; CARE-HF: 29.4 months (range, 18.0–44.7) Substud y Baseline/3 months/18 months: TTE, blood samples PINP , PIIINP , ICTP , MMP-1, Gal-3 Sur
vival and L
VEF more than 35%
at 18 months CR T-p (n=108): 72
(66.6%); OMT (n=117): 103 (88.0%),
p=0.0001
*Median (IQR). CITP
, carboxy-terminal telopeptide of collagen type-I; CR
T, car
diac r
esynchr
onisation therapy; CR
T-p, CR
T-pacemaker; ECM, extracellular car
diac matrix; Gal-3, galectin-3; HF
, heart failur
e; ICTP
, carboxy-terminal telopeptide of type I
collagen; L
VEF
, left ventricular ejection fraction; L
VESV
, left
ventricular end-systolic volume; L
VESVi, left
ventricular end-systolic volume indexed; 6MWT
, six
min walk test; MLHFQ, Minnesota
living with heart failur
e questionnair
e; MMP
,
metallopr
oteinases; NYHA, New Y
ork Heart Association; OMT
, optimal medical therapy; PINP
, N-terminal pr
opeptides of type I pr
ocollagens; PIIINP
, N-terminal pr
opeptides of type III pr
ocollagens; QoL=quality of life; SR, sinus rhythm;
TIMP
, tissue inhibitors of MMPs; TTE, transthoracic
echocar
Table 2
Baseline characteristics
Study ID
Age (years) Male gender
CR
T-d
Device upgrade Ischaemic aetiology Atrial fibrillation
Medication
LBBB
QRS (ms)
NYHA
6MWT (M)
LV
Dong
et al
26
68±9
37 (82.2%)
45 (100%)
Not reported
26 (57.8%)
Chronic AF exc
luded
ACEi/ARB 27 (60.0%),
BB 41 (91.1%)
23 (53.3%)
>120
3.03±0.33
351±186
LVESVi
77±26
mL/m
2, L
VEF
26%±5%
Tolosana
et al
24
66±8
35 (83.3%)
25 (59.5%)
Not reported
19 (45.2%)
8 (19%)
ACEi/ARB 33 (78.5%),
BB 27 (64.3%),
MRA 20 (47.6%)
Not reported
≥120
>
III=33 (78.5%) or II=9 (21.4%)
→
pacing
indica
tion
232±126
LVESV 162±63
mL,
L
VEDV
212±66
mL,
L
VEF 27%±7%
Truong
et al
25
68±12
61 (83.6%)
Ye
s
41 (56.2%)
39 (53.4%)
34 (46.5%)
ACEi/ARB 57 (78.1%),
BB 64 (87.7%),
MRA 16 (21.9%)
39 (53.4%)
168±27
2.9±0.4
Not done
LVESV 163±60
mL,
L
VEDV
226±73
mL,
L
VEF 27%±7%
Umar
et al
10
64±11
52 (81%)
Ye
s
Not reported
45 (70.3%)
Not reported
Not reported
Not reported
162±24
3.1±0.2
330±114
LVESV 172±69
mL,
L
VEDV
229±78
mL,
L
VEF 25%±8%
Garcia-Bolao et al
9
69±4
40 (67.8%)
33 (55.9%)
Not reported
30 (50.8%)
11 (18.6%)
ACEi/ARB 59 (100%),
BB 34 (57.6%),
MRA 21
(35.6%)
51 (86.4%)
158±35
3.1±0.6
327±112
LVEF 25%±5%
Lopez-Andres et al 8*
66 (59–71)
90 (68%)
0 (0%)
Exc
luded in
CARE-HF
53 (40.2%)
AF exc
luded
ACEi/ARB 131 (99.2%),
BB 88
(66.7%),
MRA 73 (55.3%)
Not reported 160 (152– 180)
3.0±0.2
Not done
(n=115) L
VESV 206
mL (174–272),
LVEDV 274
mL (233–355),
L
VEF
25% (21–29)
*Median (IQR). ACEi, angiotensin converting enzyme inhibitor; AF
, atrial
fibrillation; ARB, angiotensin
receptor
blocker; BB, beta
blocker; CR
T-d, car
diac r
esynchr
onisation therapy defibrillator; CARE-HF
, car
diac r
esynchr
onisation in heart
failur
e; LBBB, left bundle branch block; L
V, left ventricular; L
VESV
, left
ventricular end-systolic volume; L
VESVi, left
ventricular end-systolic volume indexed; L
VEDV
, left
ventricular end diastolic volume; 6MWT
, six
min walk
test; MRA, mineralcorticoid
receptor blocker; NYHA, New Y
ork Heart Association.
three studies were likely due to differences in response definitions and baseline characteristics. Garcia-Balao et al9 utilised a clinical definition of response, whereas the
other two studies used echocardiographic criteria.8 10 All
studies varied in duration of follow-up. Umar et al10 had
a higher proportion of men with ischaemic aetiology than the other studies. Lopez-Andres et al8 excluded
AF, whereas within the Garcia-Balao et al9 cohort it was
present in 18.6% of participants. Garcia-Balao et al9 tested
the predictive value of type I collagen turnover with the PICP:CITP ratio with a ratio ≥14.4 predicting response.
PIIInP
Variation was reported in trends of PIIINP levels at base-line. Dong et al26 reported logarithmic figures making
absolute figure comparison challenging. Geometric means could be calculated, but given small numbers of participants this was likely to underestimate the true mean.26 Higher PIIINP levels in HF versus healthy
controls (0.88±0.21 ug/L vs 0.71±0.14 ug/L, p=0.01) were observed.26 Responders had significantly lower PIIINP
baseline levels than non-responders (p=0.03).26 Umar
et al10 demonstrated no difference in baseline levels
between RvsNR. Lopez-Andres et al8 reported similar
baseline levels between CRT-p and OMT, but did observe PIIINP (>4.7 ug/L) in univariate analysis predicted cardiovascular outcomes (death or HF hospitalisation at 18 months) (OR 1.80, 95% CI 1.06 to 3.06, p=0.03).8
ICtP or CItP
Both ICTP and CITP were used to represent carbox-yl-terminal peptides of type I collagen in three included studies. Umar et al13 and Garcia-Balao et al12
demon-strated similar baseline means for ICTP/CITP for the entire cohort. Neither identified independent predictors of CRT response.9 10 Garcia-Bolao et al9 identified that
the PICP:CITP ratio strongly predicted response but was driven by PICP. Lopez-Andres et al8 observed similar
expression between CRT-p and OMT groups and showed no predictive value.
MMP-1, MMP-2 and MMP-9
There were variations in reported baseline concentra-tions for MMP-1. The mean for MMP-1 in Garcia-Bolao et al9 was higher than median observed in CRT-p and OMT
groups in Lopez-Andres et al,8 though the data skew is
unknown. Garcia-Bolao et al9 examined the predictive
value of MMP-1:TIMP-1, given their intrinsic regula-tory role in collagen turnover,5 but showed no statistical
significance. Lopez-Andres et al8 observed with a
base-line MMP-1 ≤3 ug/L an adjusted threefold increased risk of CRT non-response and an increased risk of death or N-terminal pro B-type natriuretic peptide >1000 ng/L (OR 2.23, 95% CI 1.00 to 5.00, p=0.051/0.073 adjusted with/without renal function).8 A precursor to MMP-1
called pro-MMP-1 (pro-MMP-1) was studied by Umar et al.10 They observed no difference in baseline pro-MMP-1
Table 3
Baseline ECM biomarkers concentrations between r
esponders versus non-r
esponders and their pr
edictive value within included studies
ECM Study ID Baseline Model Pr edicting r esponse PINP Umar et al 10~ TC: 35.4±5.0 ug/l; R: 32.9±2.2 ug/L; NR: 41.9±4.3 ug/L, p=0.04
(Stepwise) multiple logistic regression‡
Univaria
te:
OR 0.99,
95% CI 0.93 to1.00,
p=0.05
Multivariable:
OR 0.96,
95% CI 0.93 to 0.99,
p=0.03 Lopez-Andres et al 8* CR T-p: 33.0
ug/L (24.6–49.4); OMT
: 33.1
ug/L (23.0–49.3),
p=NS
(Stepwise) Multiple logistic regression†
No associa
tion with response
PICP Garcia-Bolao et al 9 TC: 74.3±29.9 ug/l; R: 85.6±29.4 ug/L; NR: 57.8±22.2 ug/L, p≤0.001 ROC:PICP:CITP AUC 0.71,
95% CI 0.57 to 0.85; Cut-off 14.4,
95% CI 9.8 to 17.7; Sensitivity 63% (51–80); Specificity 70%
(50–85); OR 2.07,
95% CI 0.98 to 4.39
PIIINP Dong et al 26≠ TC: 0.88±0.21 ug/l; R: 0.80±0.20 ug/L; NR: 0.96±0.19 ug/L, p = 0.03
(Stepwise) multiple logistic regression‡
Univaria
te:
OR 0.77,
95% CI 0.62 to 0.97,
p=0.03
Multivariable:
OR 0.20,
95% CI 0.03 to 1.17,
p=0.07 Umar et al 10~ R: 4.59±0.24 ug/L; NR: <responders, p=NS
(Stepwise) multiple logistic regression‡
Univaria
te:
OR 1.23,
95% CI 0.86 to 1.76,
p=0.23
Multivariable:
OR 1.35,
95% CI 0.94 to 1.93,
p=0.1 Lopez-Andres et al 8* CR T-p: 4.6
ug/L (3.8–6.8); OMT
: 4.7
ug/L (3.8–6.5),
p=NS
(Stepwise) multiple logistic regression†
No associa
tion with response
ICTP Umar et al 10~ TC: 3.1±0.8 ug/l; R: 3.5±0.6 ug/L; NR: 2.1±0.4 ug/L, p=ns
(Stepwise) multiple logistic regression‡
Univaria
te:
OR 1.24,
95% CI 0.93 to 1.66,
p=0.13
Multivariable:
No associa
tion with response
Lopez-Andres et al 8* CR T-p: 4.1
ug/L (2.6–6.0); OMT
: 3.4
ug/L (2.7–5.0),
p=NS
(Stepwise) multiple logistic regression†
No associa
tion with response
CITP Garcia-Bolao et al 9 TC: 5.1±2.5 ug/l; R: 4.90±2.5 ug/L; NR: 5.3±2.5 ug/L, p=0.51 ROC:PICP:CITP AUC 0.71,
95% CI 0.57 to 0.85; Cut-off value 14.4,
95% CI 9.8 to 17.7; Sensitivity 63% (51–80); Specificity
70% (50–85); OR 2.07,
95% CI 0.98to 4.39
ProMMP-1 Umar et al 10~ TC: 7.7±0.8 ug/l; R: 7.6±0.7 ug/L; NR: 8.0±1.1 ug/L, p=0.71
(Stepwise) multiple logistic regression‡
Univaria
te:
OR 0.97,
95% CI 0.87 to 1.09,
p=0.71 Multivariable: No associa tion demonstra ted MMP-1 Garcia-Bolao et al 9 TC: 8.9±11.4 ug/l; R: 7.3±10.5 ug/L; NR: 11.3±12.5 ug/L, p=0.17 ROC
Not performed as no difference Baseline MMP-1:TIMP-1 ra
tio: 0.005±0.001, R: 0.004±0.0007 versus NR: 0.0063±0.0008, p=0.297 Lopez-Andres et al 8* CR T-p: 2.7
ug/L (2.1–3.5); OMT
: 2.7
ug/L (2.0–3.9),
p=NS
(Stepwise) multiple logistic regression†
Univaria
te ≤3
ug/L:
OR 2.42,
95% CI 1.23 to 4.76,
p=0.011
Multivariable ≤3
ug/L:
OR 3.04,
95% CI 1.37 to 6.71,
p<0.01 MMP-2 Tolosana et al 24 TC:295±70 ug/L; R:258±56 ug/L; NR:325±116 ug/L, p = 0.02
Cox Regression Model‡
Univaria
te:
difference alread
y noted (p=0.02)
Multivariable: No associa tion demonstra ted Garcia-Bolao et al 9 TC: 1434±401.5 ug/l; R: 1393.8±374.5 ug/L; NR: 1496.6±438.9 ug/L, p=0.36 ROC
Not performed as no difference demonstra
ted MMP-9 Garcia-Bolao et al 9 TC: 44.7±23.2 ug/l; R: 41.1±22.8 ug/L; NR: 49.9±23.3 ug/L, p=0.17 ROC
Not performed as no difference demonstra
ted TIMP-1 Tolosana et al 24 TC:242±61 ug/l; R:216±50 ug/L; NR:277±59 ug/L, p = 0.001
Cox Regression‡; ROC
Multivaria
te:
OR 0.97,
95% CI 0.96 to 0.99,
p=0.005, ROC: ≥248 ug/L, Sensitivity 71%, Specificity 72%, OR 6.8,
95% CI 1.5 to 31
Umar et al 10~ TC: 120.3±8.2 ug/l; R: 124±5.2 ug/L; NR: 111±7.1 ug/L, p=0.16
(Stepwise) multiple logistic regression‡
Univaria
te:
OR 1.01,
95% CI 0.99 to 1.03,
p=0.16 Multivariable: No associa tion demonstra ted Garcia-Bolao et al 9 TC: 488.9±249.5 ug/l; R: 437.5±136.5 ug/L; NR: 563.8±345.7 ug/L, p=0.135 ROC
Not performed as no difference.
Baseline MMP-1:TIMP-1:TC: 0.005±0.001, R: 0.004±0.0007 versus NR: 0.0063±0.0008, p=0.297 Gal-3 Truong et al 25* TC: 18.1 ug/L (14.0–23.0), P
ositive result >25.9
ug/L
2×2
table;
McNemar test
Peripheral:
Sensitivity 15% (5–32),
Specificity 80% (64–91),
PPV
: 38% (14–68),
NPV
: 53% (40–66)
Lopez-Andres et al 8* CR Tp: 25.7
ug/L (20.6–31.4); OMT
: 25.1
ug/L (19.6–30.9),
p=NS
(Stepwise) multiple logistic regression†
No associa
tion with response
*Median (IQR) given, data r
epr
esented as CR
T-p and OMT gr
oups.
†Statistical model pr
edicts ‘non-r esponse’. ‡Statistical model pr edicts ‘r esponse’. ~ mean±standar d err or .
≠biomarker mean±SD given in logarithmic form AUC, ar
ea under the curve, CITP
, carboxy-terminal telopeptide of collagen type-I; C
R
T-p, CR
T-pacemaker; ECM, extracellular car
diac matrix; Gal-3, galectin-3; MMP
, metallopr oteinases; NPV , negative pr edictive value; NS=not significant; NR=non-r esponder; OMT
, optimal medical therapy; PICP
, carboxy-terminal pr
opeptide of pr
ocollagen type I; PINP
, N-terminal pr
opeptides of type I pr
ocollagens; PIIINP
, N-terminal pr
opeptides of type
III pr
ocollagens; PPV
, positive
pr
edictive value; R, r
esponder; ROC, r
eceiver
operator curve; TC, total
cohort; TIMP
Two studies reported cohort means for MMP-2 base-line concentration with large differences (table 3). Responders had lower MMP-2 baseline concentrations in both studies. Tolosana et al24 reported a significant
differ-ence between RvsNR (p=0.02), whereas Garcia-Bolao et al9 demonstrated no difference. The differences are not
fully explained by study design, response definition or cohort characteristics as they showed similarities (tables 1 and 2). Variation in levels may be due to Tolosana et al24
using plasma and Garcia-Bolao et al9 using serum in their
sandwich ELISAs. MMP-9 was reported by Garcia-Bolao et al,9 who observed a trend towards lower baseline MMP-9
concentration for Responders. Baseline MMP-9 did not predict CRT response.9
tIMP-1
Tolosana et al24 observed that responders had
signifi-cantly lower concentrations at baseline of TIMP-1 than non-responders. Neither Umar et al10 nor Garcia-Bolao et
al9 observed a significant difference in baseline TIMP-1
concentration between RvsNR. Higher peripheral TIMP-1 was identified as an independent predictor of non-response by Tolosana et al24 in multivariable analysis;
a concentration of ≥248 ug/L had a 71% sensitivity and 72% specificity for predicting non-response. However, Umar et al10 did not identify TIMP-1 as a predictor.
Garcia-Bolao et al9 tested TIMP-1 in the MMP-1:TIMP-1 ratio
and did not identify TIMP-1 as a significant predictor of RvsNR.
gal-3
Lopez-Andres et al8 reported higher baseline levels of
Gal-3 than Truong et al,25 due to different response
defi-nitions and variation in cohort characteristics. Lopez et al8 used an echocardiographic definition at 18 months
and Truong et al25 utilised HF clinical composite score at
6 months. Truong et al25 has higher ischaemic aetiology
(53.4% vs 40.2%) and included patients with AF. Neither study reported baseline concentrations for RvsNR.8 25
Truong et al25 observed that peripheral baseline Gal-3
above a preset concentration (>25.9 ug/L) had low sensi-tivity and high specificity for predicting CRT response.
dIsCussIOn
The ECM is a highly dynamic structure that is integral to myocardial structure and function which detrimentally remodels following cardiac injury leading to the altered turnover, replacing contractile tissue with collagen rich connective tissue and ultimately the development of myocardial fibrosis.5 Myocardial fibrosis is characterised
by adverse remodelling which contributes to systolic and diastolic HF.5 28 PINP, PICP and PIIINP are released
into the circulation during conversion and deposition of procollagen to collagen and are upregulated during myocardial fibrosis and associated with adverse HF outcomes.5 7 15 28 Mechanistically, higher upregulation
of collagen would challenge a CRT’s ability to reverse remodel and for the patient to respond. Umar et al10
supported this hypothesis observing significantly lower baseline PINP expression predicted echocardiographic response. Dong et al26 did observe lower baseline PIIINP
predicted echocardiographic response on univariate analysis, but not multivariable analysis. In contrast, Garcia-Balao et al9 observed higher baseline
expres-sion of PICP in responders and PICP:CITP ratio (type I collagen turnover) of ≥14.4 had greater than twofold increased chance of predicting functional response, driven by PICP. Critically, echocardiographic and clin-ical/functional response criteria correlate poorly,18 so
could not be contrasted. Importantly, Lopez-Andres et al,8
the largest study included in the review, did not observe upregulation of collagen synthesis predicting echocardio-graphic non-response, which does challenge the Umar et al10 and Dong et al26 observations; however, the cohort
characteristics and study designs were different. The observations of collagen synthesis following CRT implan-tation conflict with each other. Umar et al10 reported a
significant increase in PINP and decrease in PIIINP expression in responders at 6 months; both would mecha-nistically be expected to be lower at follow-up. In contrast Garcia-Bolao et al9 observed PICP levels decreased for
responders and increased for non-responders at 1 year, which would be expected, but is based on a functional response definition. In contrast to collagen synthesis, degradation biomarkers (ICTP or CITP) did not predict CRT response.8–10 Furthermore, no significant change in
ICTP or CITP expression was observed at follow-up across all three studies.8–10 Alteration in collagen synthesis rate
is observed to be more powerful at predicting response than collagen degradation. Different patterns of collagen synthesis biomarkers predicting response have been observed; lower expression predicted LV reverse remod-elling,10 26 whereas higher rates predicted functional
response.9 The variation in these patterns is explained
by the different response definitions and cohort charac-teristics. The study cohort for Umar et al10 had a higher
proportion of men and ischaemic cardiomyopathy than Garcia-Bolao et al.9 The heterogeneities between these
studies make drawing conclusions difficult. Lopez-Andres
et al8 also challenge any observations due to size of cohort
and no prediction value to collagen turnover observed. Overall, collagen synthesis is observed to be important in predicting CRT response, especially LV reverse remodel-ling, with results replicated in two studies that lower rates predict LV reverse remodelling.10 26
MMP-1, MMP-2 and MMP-9 perform a critical role in myocardial collagen degradation and have been identified as being important prognostic markers in HF.11 13 27 Predictive value for CRT non-response (death
or LVEF ≤35% at 18 months) was only demonstrated in baseline MMP-1 expression ≤3 ug/l8 supporting an
obser-vation by Jordan et al11 that lower MMP-1 inferred worse
HF prognosis. MMP-2 had large variations observed between the included studies,8 24 but was not
however, recently Dini et al13 demonstrated raised levels
(>238 ng/mL) and predicted worse HF outcomes. MMP activity was not considered in any of these studies as a predictor but would be important to consider in the future. Current evidence suggests that MMPs, especially MMP-2 and MMP-9, have not yet had their potential fully evaluated.
TIMP-1 regulates the endogenous proteolytic MMP system involving discordant inhibition and in chronic inflammatory states stimulating collagen synthesis and myocardial fibrosis.5 24 Tolosana et al24 observed a
signif-icant baseline difference in RvsNR expression with lower TIMP-1 in responders. Tolosana et al24
demon-strated that baseline TIMP-1 (≥248 ug/L) predicted CRT non-response. Trucco et al29 in long-term follow-up of
the same cohort demonstrated that the same threshold independently predicted mortality at 60±34 months (sensitivity 80% and specificity 71%). Tolosana et al24 also
demonstrated that statistically significant lower TIMP-1 is found in participants that do LV reverse remodel (LVESV reduction ≥10%). Umar et al10 and Garcia-Bolao et al9
observed no difference statistically at baseline. Variation between the reported literature in the magnitude of asso-ciation of TIMP-1 exists; however, Tolosana et al24 offers
a well-designed prospective observational study which is powered giving strength to the conclusions drawn.
Gal-3 stimulates fibroblasts to release TIMPs and MMPs that regulate collagen turnover, resulting in myocardial fibrosis.14 Elevated levels are independent predictors
of adverse outcomes in HF.14 Evaluation of Gal-3 as a
predictor of response was limited, as RvsNR was not reported in either of the two studies.8 25 Truong et al25
demonstrated peripheral baseline Gal-3 ≥25.9 ug/L had specificity for predicting CRT response. Lopez-Andres
et al8 observed Gal-3 baseline expression ≥30 ng/L had
nearly threefold increased risk of death or hospitalisation for worsening HF following CRT. Though not demon-strated to be a strong predictor, the evidence suggests that Gal-3 is a good biomarker for predicting poor outcomes in HF and needs further evaluation.
The greatest challenge for research into CRT response and one this review demonstrated is lack of an accepted response definition. Differing definitions rarely correlate,18 which our review clearly demonstrates.
Echocardiographic and clinical/functional definitions correlate very poorly and should never be compared or applied in a composite definition18; LV reverse
remodel-ling should be considered separately.18 30
study limitations
Heterogeneity among included studies was widespread despite a rigorous eligibility and screening criteria. The variations in study design, cohort characteristics and response definitions made pooling data in a meta-analysis impractical. CRT implantation techniques and indica-tions have evolved over the last 15 years and offer another source of heterogeneity. Furthermore differences in laboratory techniques account for some variation among
biomarker results. These limitations are particularly important to consider in future research studies.
COnClusIOns
Collagen synthesis biomarkers have shown the most potential, particularly PINP and PIIINP, but will require further study. MMP-2 and MMP-9 have no conclusive predictive value and need further investigation. Hetero-geneity is the greatest challenge for research in this field and needs to be minimised in future studies. The most important initial step is for a universal response defini-tion to be adopted and applied.
Acknowledgements We would like to acknowledge the Research, Development and Innovation department for their support, Medical and Life Science Fund (charity no. 1139383) for their kind support of Dr C McAloon, Petra Meeson and the University Hospital Coventry and Warwickshire library services for their assistance with the literature search, Professor Norman Waugh in Warwick Evidence for reviewing and offering his expert advice.
Contributors CJM had the original concept, designed methodology, performed literature search, article screening, data extraction, quality assessment, results analysis and drafted the manuscript. DA performed article screening, data extraction and quality assessment. TH reviewed statistical interpretation. PB, POH and HR reviewed methodology and critically edited manuscript. FO reviewed methodology, eligibility and critically edited manuscript.
Competing interests None declared.
Provenance and peer review Not commissioned; externally peer reviewed.
Open Access This is an Open Access article distributed in accordance with the Creative Commons Attribution Non Commercial (CC BY-NC 4.0) license, which permits others to distribute, remix, adapt, build upon this work non-commercially, and license their derivative works on different terms, provided the original work is properly cited and the use is non-commercial. See: http:// creativecommons. org/ licenses/ by- nc/ 4. 0/
© Article author(s) (or their employer(s) unless otherwise stated in the text of the article) 2017. All rights reserved. No commercial use is permitted unless otherwise expressly granted.
RefeRences
1. Cleland JG, Daubert JC, Erdmann E, et al. Cardiac resynchronization-heart failure study: the effect of cardiac
resynchronization on morbidity and mortality in heart failure. N Engl J Med 2005;352:1539–49.
2. Bristow MR, Saxon LA, Boehmer J, et al. Cardiac-resynchronization therapy with or without an implantable defibrillator in advanced chronic heart failure. N Engl J Med 2004;350:2140–50. 3. Tracy CM, Epstein AE, Darbar D, et al. 2012 ACCF/AHA/HRS
focused update of the 2008 guidelines for device-based therapy of cardiac rhythm abnormalities: a report of the American College of Cardiology Foundation/American Heart Association task force on practice guidelines. Heart Rhythm 2012;9:1737–53.
4. van Kimmenade RR, Januzzi JL. Emerging biomarkers in heart failure. Clin Chem 2012;58:127–38.
5. Spinale FG, Janicki JS, Zile MR. Membrane-associated matrix proteolysis and heart failure. Circ Res 2013;112:195–208. 6. Zannad F, Alla F, Dousset B, et al. Limitation of excessive
extracellular matrix turnover may contribute to survival benefit of spironolactone therapy in patients with congestive heart failure: insights from the randomized aldactone evaluation study (RALES). Rales investigators. Circulation 2000;102:2700–6.
7. Cicoira M, Rossi A, Bonapace S, et al. Independent and additional prognostic value of aminoterminal propeptide of type III procollagen circulating levels in patients with chronic heart failure. J Card Fail 2004;10:403–11.
9. García-Bolao I, López B, Macías A, et al. Impact of collagen type I turnover on the long-term response to cardiac resynchronization therapy. Eur Heart J 2008;29:898–906.
10. Umar S, Bax JJ, Klok M, et al. Myocardial collagen metabolism in failing hearts before and during cardiac resynchronization therapy.
Eur J Heart Fail 2008;10:878–83.
11. Jordán A, Roldán V, García M, et al. Matrix metalloproteinase-1 and its inhibitor, TIMP-1, in systolic heart failure: relation to functional data and prognosis. J Intern Med 2007;262:385–92.
12. George J, Patal S, Wexler D, et al. Circulating matrix
metalloproteinase-2 but not matrix metalloproteinase-3, matrix metalloproteinase-9, or tissue inhibitor of metalloproteinase-1 predicts outcome in patients with congestive heart failure. Am Heart J 2005;150:484–7.
13. Dini FL, Buralli S, Bajraktari G, et al. Plasma matrix
metalloproteinase-9 better predicts outcome than N-terminal protype-B natriuretic peptide in patients with systolic heart failure and a high prevalence of coronary artery disease. Biomed
Pharmacother 2010;64:339–42.
14. Stolen CM, Adourian A, Meyer TE, et al. Plasma galectin-3 and heart failure outcomes in MADIT-CRT (multicenter automatic defibrillator implantation trial with cardiac resynchronization therapy). J Card Fail 2014;20:793–9.
15. Li M, Zhou Y, Zhou Y, et al. Improvement in collagen metabolism after 12 weeks' cardiac resynchronization therapy in patients with ischaemic cardiomyopathy. J Int Med Res 2013;41:200–7. 16. Moher D, Liberati A, Tetzlaff J, et al. Preferred reporting items for
systematic reviews and meta-analyses: the PRISMA statement. Ann
Intern Med 2009;151:264–9.
17. Moher D, Shamseer L, Clarke M, et al. Preferred reporting items for systematic review and meta-analysis protocols (PRISMA-P) 2015 statement. Syst Rev 2015;4:1.
18. Fornwalt BK, Sprague WW, BeDell P, et al. Agreement is poor among current criteria used to define response to cardiac resynchronization therapy. Circulation 2010;121:1985–91.
19. Critical Appraisal Skills Programme (CASP) Cohort Study Check list Oxford. 2013; (accessed 02 May 2014).http://www. casp- uk. net/#!casp-tools-checklists/c18f8
20. Higgins JP, Altman DG, Gotzsche PC, et al. The Cochrane Collaboration's tool for assessing risk of bias in randomised trials. BMJ 2011;343:d5928.
21. Kim SY, Park JE, Lee YJ, et al. Testing a tool for assessing the risk of Bias for nonrandomized studies showed moderate reliability and promising validity. J Clin Epidemiol 2013;66:408–14.
22. Saba S, McTiernan C, Gutmann R, et al. London B: abstract 3252: clinical improvement Ater cardiac resynchronization therapy foretells lower serum levels of biomarkers reflecting cardiac Collagen deposition. Circulation 2009;120(Suppl 18):S771–S2.
23. Ducharme A, Prylutska H, Harel F, et al. 511 Similar remodeling benefit of LV-CRT and BiV-CRT in patients with heart failure and wide qrs: Insight from the evaluation of resynchronization therapy for heart failure (EARTH) trial. Can J Cardiol 2011;27:S248 http:// onlinelibrary. wiley. com/ o/ cochrane/ clcentral/ articles/ 446/ CN- 01020446/ frame. html
24. Tolosana JM, Mont L, Sitges M, et al. Plasma tissue inhibitor of matrix metalloproteinase-1 (TIMP-1): an independent predictor of poor response to cardiac resynchronization therapy. Eur J Heart Fail 2010;12:492–8.
25. Truong QA, Januzzi JL, Szymonifka J, et al. Coronary sinus biomarker sampling compared to peripheral venous blood for predicting outcomes in patients with severe heart failure undergoing cardiac resynchronization therapy: the BIOCRT study. Heart Rhythm 2014;11:2167–75.
26. Dong YX, Burnett JC, Chen HH, et al. Effect of cardiac
resynchronization therapy on broad neurohormone biomarkers in heart failure. J Interv Card Electrophysiol 2011;30:241–9. 27. Hessel MH, Bleeker GB, Bax JJ, et al. Reverse ventricular
remodelling after cardiac resynchronization therapy is associated with a reduction in serum tenascin-C and plasma matrix metalloproteinase-9 levels. Eur J Heart Fail 2007;9:1058–63. 28. Krum H, Elsik M, Schneider HG, et al. Relation of peripheral collagen
markers to death and hospitalization in patients with heart failure and preserved ejection fraction: results of the I-PRESERVE collagen substudy. Circ Heart Fail 2011;4:561–8.
29. Trucco E, Tolosana JM, Castel MA, et al. Guash E1, Matas M1, Arbelo E1, Berruezo A1, Brugada J1, Mont L1. plasma tissue inhibitor of matrix metalloproteinase-1 a predictor of long-term mortality in patients treated with cardiac resynchronization therapy.
Europace 2016;18:232–7.