© 2019, IRJET | Impact Factor value: 7.211 | ISO 9001:2008 Certified Journal
| Page 1210
DEVELOPMENT OF GUI BASED SIMULATOR FOR THE EBI SIGNAL
Manisha Yadav
1, Sudhakar Dubey
2, Neelam Bhoi
3, Silviya Alphanso
41
Assistant Professor, Department of Electronics Engineering, Thane
2
Network Operating Centre Engineer, Palghar
3,4
Assistant Professor, Department of Electronics and Telecommunication Engineering, Thane
---***---Abstract -The physical structure of any biological object in our universe is built by many living cells. The biological cell shows the changing relation with respect to the alternating electrical signal applied to it. Beneath this alternating electrical excitation, the biological cells of the selected region of the subject gives out an electrical bio-impedance (EBI) that relies on the amount of blood present in that area because electric current has a tendency to flow through the low resistance value. It is found that the Impedance Cardiography (ICG) which comes under the EBI non-invasive procedure performs quite well in terms of curve fitting models as compared to the other non-invasive methods like Electrocardiogram (ECG) [2]. Once we acquire the EBI information, then the corresponding signals are taken into practice for modelling the respective data. It will be practice to guide the modelling of the Impedance Cardiography (ICG) and Impedance respirography (IRG) signals within the presence of noise. Six curve fitting models Polynomial, Fourier series, Sum of Sine waves, Exponential, Gaussian and Rational Polynomial models are estimated for the eight EBI datasets. The analysis criteria are estimated in terms of the Sum of square errors (SSE), high correlation between actual data and modelled data (R-Square), as-well-as Execution time. GUI based signal simulator provides liberty to the users to simulate EBI signals as per his/her desires for additional analysis. The developed GUI based simulator for the EBI signal may be used for research and analysis purposes.
Key Words: Electrical Bio-impedance (EBI), Impedance
cardiography (ICG), Impedance Respirography (IRG), Electrocardiogram (ECG), Sum of Squares error (SSE), R-Square, Execution time.
1. INTRODUCTION
In this paper a unique framework has been suggested, that may be a pathway to model a signal and develop bioelectrical applications. The distinctive approach within the proposal of such a framework is provides a pathway between biological systems and therefore the development of bioelectrical applications [1]. A framework is suggested to guide the physiological signals for modelling and further to develop a GUI based simulator for the Bio-impedance signal. The framework could be a bridge to develop bioelectrical applications. The bioelectrical data should be modeled by using a sample signals and so given out a corresponding simulated signal that helps in development of GUI based simulator. The modeling of the signals permits the
advancement of information concerning the interaction of anatomical structures and physical phenomena that contribute to pathophysiological behaviors [2]. An application of this information area is found in analysis and education. A very important application of modeling in medical domain analysis is to estimate the performance of algorithms, e.g. separation algorithms.
2. SUBJECT AND METHODS
© 2019, IRJET | Impact Factor value: 7.211 | ISO 9001:2008 Certified Journal
| Page 1211
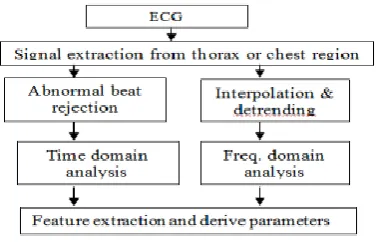
Figure 1: Block diagram of framework for modelling the Sample signals and developing of a corresponding
simulator
3. BIO-SIGNAL GENERATION
There are different bio-signals which have relevance with human anatomy for the prognosis of cardiac diseases. The basic invasive and non-invasive techniques have made significant contribution towards the classifications.
Figure 2 : : Ecg signal model
Here, our emphasis is to study and analysed the ECG base model and compare it other related techniques. The Electrocardiogram provides the overview of electrical and muscular activity of heart and information about cardiac health. Cardiovascular variability helps in determining cardiac problems. Cardiovascular (CV) variability carries a detailed knowledge about CV regulation systems. Various methods are studied till date which gives vital information about Heart Rate and other information related to cardiac health. Various points of ECG give several functionality of heart at different point of time while pumping. Time domain analysis of ECG related with statistical analysis, whereas Poincare method and Geometrical methods are also useful in determining various features of ECG [4-6]. However, Frequency domain analysis gives spectrum, energy and entropy of a given signal while adapting different methods. HRV contains many Non-linear parameters which can be studied through different models. Different approach gives
various feature extraction and de-noising effects on ECG signals.
Cardiac impedance is a measurement of the mechanical activation of the heart. The recorded cardiac impedance can be able to relate with the electrical activation of the heart that is the electrocardiogram (ECG). The process of recording the cardiac impedance from the thorax region is normally known as impedance cardiography, which is denoted by ZCG or ICG. The measurement of electrical impedance shows the value of opposition to an alternating current (or AC) current flow within a circuit that is the similar way resistance opposes the current. On supply of high frequency and low voltage current through the chest, the signal will naturally take the path of minimum resistance through the blood [7][8]. When the blood volume increases then simultaneously the impedance value decreases, and vice-versa. The cardiac impedance signal is denoted by Z0. Since it is a measure of electrical resistance, Z0 is measured in Ohms .A cycle of impedance cardiography is represented by dZ/dt. This is the first derivative of Z, or the change in impedance with respect to the time. For impedance analysis, dZ/dt waveform is actually much more telling than the corresponding Zo signal.
4. IMPLEMENTATION
The curve-fitting models are required to model the Impedance Cardiography and Impedance Respirography EBI signals. Various curve-fitting models are estimated by analyzing the measured and modelled signals in terms of mathematical parameter that is regression analysis and visual match. Within the curve-fitting technique, six completely different curve-fitting models are compared, specifically Polynomial, Fourier series, Sum of sines, Exponential, Gaussian and Rational polynomial. The comparison criterion relies on regression analysis specially Sum of sq. errors (SSE), R-Square and execution time. The GUI based EBI signal simulator is made to support the six curve fitting models. The EBI signal from the simulator is basically generated by the addition of all the signal parameter and the modelled signal got from the user side and they are the ICG signal, IRG signal, motion artefacts, and a white Gaussian noise [9]. So as to induce the EBI wave form from the signal models, the EBI knowledge is taken summation of the subsequent four components:
[image:2.595.74.263.395.516.2]© 2019, IRJET | Impact Factor value: 7.211 | ISO 9001:2008 Certified Journal
| Page 1212
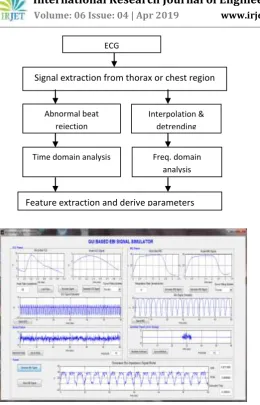
Figure 3: End-user GUI of the BISS simulator based on Fourier curve fitting method
Fig. 3 shows the developed GUI based EBI signal simulator where the recorded information is loaded. The end-user interface of the simulator is shown that is built with the six curve fitting model. Initially the end-user will load the respective database based on the recorded states (Controlled and spontaneous ventilation) with different ages and weights of the patients. Then the consecutive measured data goes through the cleaning and modelling of the ICG and IRG signal depends on the six curve fitting models. The additive white Gaussian noise, and therefore the recorded artifacts caused by motion (in this instance by swinging the arm during the measurement) came into existence. The final output shows the simulated EBI signals model supported the end-user’s entered parameters and therefore show the generated EBI signal simulator. Furthermore, we can add more buttons that permit the user to save the generated EBI signal model.
5. RESULT
The databases which are taken into consideration are of random age and year’s group. These datasets which have been taken are consists of children and adult group and
[image:3.595.307.561.168.271.2]accuracy is calculated on the basis of used curve fitting models. The accuracy percentage values of these entire datasets are taken and separated by the regression analysis parameters that are SSE and R-sq. parameters. These calculated parameters are plotted and shown in the figure 4.
Figure 4: Accuracy of SSE parameter in ECG vs ICG
In the figure 4, it can be seen that the accuracy values of SSE for the curve fitting methods like Fourier, Polynomial, Sum of Sines, Gaussian and Rational polynomial is comparatively better whereas exponential method shows the accuracy of 50% for both the statistical parameters. In this section, the bifurcation of used curve fitting model wise comparison is shown. It is found that the first three methods performs quite well for the ICG method and shows the better accuracy result as compared to the ECG, and Fourier curve fitting model is best suited to the ICG signal modelling in terms of SSE parameter result.
The figure 5 below shows that the accuracy percentage values of R-sq. parameter in terms of the all six curve fitting methods. The values of R-sq. parameters are almost alike with equal accuracy for the Exponential and Gaussian as seen in the figure 5. From the result of R-sq. it is again concluded that the Fourier model is the best suited model for the ICG signal modelling in the process of generating the EBI signal.
Figure 5: Accuracy of R-sq. parameter in ECG vs ICG
The Overall accuracy is also calculated for showing the comparative result for both the SSE and R-sq. parameters shown in the figure 6 below. The overall accuracy is prepared from the 8 database with their 82 results of respective SSE and R-sq. parameters.
ECG
Signal extraction from thorax or chest region
Abnormal beat rejection
Interpolation & detrending
Time domain analysis Freq. domain
analysis
[image:3.595.307.560.545.659.2]© 2019, IRJET | Impact Factor value: 7.211 | ISO 9001:2008 Certified Journal
| Page 1213
Figure 6: Overall accuracy ECG vs ICG
The Fourier series model performs quite well for the ICG signal and also shows good results as compared to other curve fitting models which has been used. Here, Fourier series model turns out the best method for modelling the ICG signal. But it takes longer time to execute as compared to the polynomial model and it is quicker than the sum of sines waves model. The last model that is Rational polynomial is not fitted for the many of the datasets because its resultant SSE and R-sq. parameters are not giving the good result, it is not effective to reduce the random error for the dataset. Hence, this technique is not-effective as compared to the other modelling techniques.
[image:4.595.306.561.311.421.2]The graph plotted below is for the comparative analysis of the entire applied curve fitted model, mainly the ICG signal modelling. The average value of all the resultant parameter readings are taken and result is concluded. The database which is taken into consideration is of random age and years group. Datasets 1, 3, 4 and 5 are taken for spontaneous ventilation case whereas other Datasets 2, 6, 7 and 8 are from controlled ventilation. Spontaneous ventilation is a normal breathing without any support that is through muscular movements of the lungs. Whereas, in controlled ventilation breathing is provided by the mechanical device.
Figure 7: SSE average value
The SSE average value shown is provided approximately good result to all the methods except rational polynomial. For rational polynomial, the average result comes a value of 1250.81 which is not a satisfactory result. Hence, the rational polynomial model can be eliminated. Fourier series performs quite well except for the database 2. However close to 0 is the best for the model to be used
Figure 8: R-sq. average value
The R-sq. average value shown is provided good result to all the other method except for the Gaussian and the rational polynomial model. The R-sq value close to 1 is said to be the best for modelling the signal. Hence, here Gaussian and Rational polynomial are not providing the good result and they can be eliminated for modelling the ICG signal.
Figure 9: Execution time average value
The average value of execution time graph is shown above. It is shown that Sum of sines, Gaussian and rational polynomial takes a much more time to calculate the values of the statistical parameters. Hence they can be eliminating on the basis of the outcomes. The remaining three methods Fourier, Polynomial and Exponential are giving the satisfactory results. However, when we compared the accuracy of these models of ICG with the ECG then the accuracy percentage of the Polynomial and Exponential models not providing the good result as compared to the Fourier. Fourier shows the 100% accuracy for the ICG method whereas Polynomial and exponential shows the accuracy of 62.5% and 50% respectively.
3. CONCLUSION
[image:4.595.37.289.523.618.2]© 2019, IRJET | Impact Factor value: 7.211 | ISO 9001:2008 Certified Journal
| Page 1214
find the results for errors related to the fitting of the models with the actual data. SSE is for finding the error or fluctuation between an observed value and the fitted value provided by the curve fitting models which are used. The R-square is a statistical parameter that gives the result of the ability of the regression curve, which approximates to the actual data. Both SSE and R-sq used for regression analysis but there way of finding it, is different. They both give the information about the goodness of fit of a model. Supported to our evaluated results and usually speaking, the six models perform quite well with all the eight datasets except the rational polynomial. The EBI signal simulator permits the end-user to simulate the EBI signal as per his/her desires for additional analysis. However, the developed EBI signal simulator may even be used for research and analysis purposes. The accuracy of the ICG method is compared with one of the very popular non-invasive method known as ECG. It is found that the accuracy of curve fitting models supported the ICG method irrespective to ECG. By comparing the results with the ECG it is concluded that the Fourier series models is the best curve fitting models which should be applied to ICG signal for modelling the measured data in future. Hence, for modelling the ICG signal it is beneficial to choose Fourier series model apart from the any other modelling techniques. From the study it is concluded that the ICG and IRG signals need to be modelled rather than depending on the measured data only. The developed GUI simulator can be made more practical by adding the further calculated physiological parameters like stroke volume (SV) and cardiac output (CO) from the generated EBI signals.
REFERENCES
[1] Shuji Takahashi, Kenta Sakawa, Yoichi Shiraishi and Hiroshi Miyashita, “ Modelling, Simulation and parameter estimation of the cardiovascular system by using model based approach”, SICE annual conference, Nagoya, Japan, pp. 493-500, 2013.
[2] Asma Ayadi, Ridha Ben Salah, Kais Ouni and Wassila Sahtout,“ Determination of cardio-vascular parameters from bio-impedance signal ”, 2nd International conference on advance technologies for Signal and Image processing, pp. 403-407, 2016.
[3] Yar M. Mughal, Paul Annus and Mart Min, “An Overview of the Impedance Models of the Thorax and the Origin of the Impedance Cardiography Signal for modelling of the Impedance Signals”, 2014 IEEE Conference on Biomedical Engineering and Sciences, pp. 526-531, 2014.
[4] Ashly Elizabeth Vincent and Sreekumar K, “A survey on approaches for ECG signal analysis with focus to feature extraction and classification”, International Conference on Inventive Communication and Computational Technologies (ICICCT), pp.140-144, 2017.
[5] Mughal Y.M., “Decomposing of Cardiac and Respiratory Signals from Electrical Bio-impedance Data Using Filtering Method”, The International Conference on
Health Informatics. IFMBE Proceedings, vol 42. Springer, Cham, 2014.
[6] P.Manimegalai, Delpha Jacob,andDr.K.Thanushkodi, “Estimation of cardiovascular parameters from ECG and PPG signals ”,Bioengineering Conference (NEBEC), 2012 38th Annual Northeast, pp. 237-238, 2012. [7] Kun-Yang LI, Wen-Hui CHEN and Lian-Rong ZHENG, “ A
method to detect heart rate based on the electrical impedance signal ”, ITM Web of Conferences 7, pp.2-4, 2016.
[8] D. K. Kamat, SanikaDadhi and Dr. P. M. Patil, “ A heart rate measurement using bio-impedance signal analysis”, Internatioanl journal of advance research electrical, electronics and instrumentation engineering (IJAREEIE), vol.3, issue.4, pp.8446-8451, 2014. [9] Y.M.Mughal, Y Le Moullec, P.Annus and A Krivoshei, “ A