warwick.ac.uk/lib-publications
Manuscript version: Author’s Accepted Manuscript
The version presented in WRAP is the author’s accepted manuscript and may differ from the published version or Version of Record.
Persistent WRAP URL:
http://wrap.warwick.ac.uk/115244
How to cite:
Please refer to published version for the most recent bibliographic citation information. If a published version is known of, the repository item page linked to above, will contain details on accessing it.
Copyright and reuse:
The Warwick Research Archive Portal (WRAP) makes this work by researchers of the University of Warwick available open access under the following conditions.
Copyright © and all moral rights to the version of the paper presented here belong to the individual author(s) and/or other copyright owners. To the extent reasonable and
practicable the material made available in WRAP has been checked for eligibility before being made available.
Copies of full items can be used for personal research or study, educational, or not-for-profit purposes without prior permission or charge. Provided that the authors, title and full
bibliographic details are credited, a hyperlink and/or URL is given for the original metadata page and the content is not changed in any way.
Publisher’s statement:
Please refer to the repository item page, publisher’s statement section, for further information.
A machine learning perspective on responsible gambling
In-press at Behavioural Public Policy
Arman Hassanniakalager1
Philip W. S. Newall2
1
University of Bath, Claverton Down, Bath, BA2 7AY, United Kingdom
2
Applied Psychology, WMG, University of Warwick, Coventry, CV4 7AL, United Kingdom
Correspondence: Philip Newall, PhD, email: [email protected]
Running head: Machine learning and responsible gambling
Declaration of funding: The authors received no funding for this research.
Acknowledgements: Thanks to Tadgh Hegarty and Lukasz Walasek for their useful feedback.
Abstract
Introduction
Consumers purchasing gambling and alcohol products receive similar advice. “Please gamble responsibly” is seen perhaps as frequently as advice to, “please drink responsibly.” But how should this advice be followed? With alcohol, the familiar alcohol by volume percentage (ABV %) tells consumers about product strength, and this information is further broken down into the number of units of alcohol per serving on the majority of alcohol sold in the UK (Portman Group, 2017). In gambling, a similar percentage determines product strength in terms of statistical risk, but this advice is given to consumers more inconsistently. Electronic gambling machines are one UK gambling product coming with product risk information, where by law statistical risks are presented as (J. Parke, Parke, & Blaszczynski, 2016):
“return-to-player” % = 100 - house edge
current failings, evidence from the behavioral risk communication literature suggests that this information could be communicated to more people through the use of graphical risk representations,(Garcia-Retamero & Cokely, 2017), while the tobacco literature suggests that making these warning labels more prominent should also boost effectiveness (Hammond, 2011) . But despite these significant failings, many UK gambling products are marketed with even less product risk information than is currently given on return-to-player warning labels.
Soccer is the UK’s national sport, and soccer betting is now the most popular form of gambling with British problem gamblers (Gambleaware, 2017). The most common advice featuring on soccer bets, either at point of purchase or on marketing communications, is currently the generic, “when the fun stops, stop.” Absolutely no advice is given on relative product risk, even as these risks may vary substantially, in contrast to return-to-player or ABV % labels. When consumers see a soccer bet, either in a physical bookmaker, on a bookmaker’s website, or in a marketing communication, they typically receive only one piece of risk information: the betting odds. For example, a bet on the correct score in soccer, “Arsenal to win by three goals to one, 25-to-1” means that gamblers will win £25 of profit for every £1 bet if the team Arsenal wins by three goals to one (Cortis, 2015). But each potential payout must be multiplied by its probability of happening in order to calculate a gambler’s long-term returns. In European roulette, potential payout and event probability happen to be perfectly negatively correlated, so that the house edge is a constant 2.7%. Some psychologists have recently proposed that payout and probability are in fact negatively correlated in many real-world environments, resulting in roughly constant average expected returns (Pleskac & Hertwig, 2014). However, as we show next, the house edge can fluctuate wildly across different bet types in soccer betting.
bookmakers’ odds (Cortis, 2015), under the assumption that bookmakers offset the risks of different bets (Stark & Cortis, 2017). Each soccer match ends in one of three salient outcomes: home win, draw, away win. Bets on these outcomes are the oldest bets that can be made in soccer (Forrest, 2008), and will be called “home-draw-away” bets here. These events are high-profile, and are relatively few, so it should be easy for gamblers to shop around and find the bookmaker with the best home-draw-away odds, especially with odds comparison sites such as oddschecker.com. And the house edge on home-draw-away bets has decreased in recent years (Buhagiar, Cortis, & Newall, 2018; Constantinou & Fenton, 2013). For example, a study found home-draw-away edges of 4.5% on average over the 2014 World Cup (Newall, 2015), compared to an average house edge of 10.3% in data from the 1990s (Kuypers, 2000). But bookmakers are increasingly innovating new bet types (Newall, Thobhani, Walasek, & Meyer, 2018; Newall, 2015; Newall, 2017). Correct score bets, for example, pay off if a gambler can predict the more specific final scoreline. The same 2014 World Cup study found a far higher house edge of 21.9% on correct score bets (Newall, 2015), which is proportionally not much lower than the 26% house edge found on correct score bets from a study in the 1990s (M. J. Dixon & Pope, 2004). The house edge in soccer depends a lot on the type of bet chosen, and can be more than eight times the 2.7% European roulette house edge on a per-bet basis. This is important for gamblers, as a lower house edge allows gamblers to benefit from a lower “price” of gambling, and to thereby be able to afford a higher number of gambling experiences from some fixed budget allocated for gambling (Woolley et al., 2013).
not especially skilled at predicting sports outcomes. Sports fans are overconfident, even when the financial stakes are high (Simmons & Massey, 2012), and are subject to wishful thinking (Babad, 1987). And soccer experts are not necessarily better than non-experts at predicting outcomes (Andersson, Edman, & Ekman, 2005; Andersson, Memmert, & Popowicz, 2009). Prediction skill means that soccer bettors can plausibly receive returns which are both better and worse than the averages summarized in the previous paragraph. This paper will therefore use machine learning to investigate the total potential impact of prediction skill across four soccer betting types. Although it could be difficult to directly make sports bettors more skilful, it might be easier to alert sports bettors to observable product features, such as the level of betting odds, which are correlated with product risk. For example with alcohol, it is reasonable to guess that the ABV% of a bottle of whiskey is higher than a bottle of wine, which is higher than the ABV% of a bottle of beer. Any salient attribute of sports bets which is correlated with the returns that gamblers receive could similarly be used to communicate product risk non-numerically.
the variable nature of sports betting risks also provides a unique opportunity to reduce the harms associated with sports betting.
Gambling-related harm increases as gamblers’ total losses increase (Markham, Young, & Doran, 2014; Markham, Young, & Doran, 2016). But gamblers’ losses are not fixed in sports betting, and depend on the relative skill levels across gamblers and bookmakers. At present, British bookmakers are creating soccer bets with ever increasing potential payoffs, the only piece of risk information currently communicated to gamblers (Newall et al., 2018; Newall, 2015; Newall, 2017). This matters because these high potential payoff bets have higher house edges than traditional home-draw-away bets. But changing the behavior of even a small number of gamblers, for example by making them more aware of how potential payoff combines with event probability to determine the house edge, could incentivize bookmakers to compete on “price” -- the house edge (Woolley et al., 2013). House edges have decreased for home-draw-away bets since the late 1990s (Buhagiar et al., 2018; Constantinou & Fenton, 2013; Kuypers, 2000), demonstrating that bookmakers can compete on price. Any decreases in the house edge means then even gamblers who do not change their behavior in any way can also benefit from resulting decreases in their gambling losses.
freedom-preserving public health intervention on this spectrum. We have used the examples of alcohol and electronic gambling machine warning labels to highlight an omission of product risk information for sports bets. However, any new warning label should be trialled experimentally and in field trials before being rolled out at a population level, to ensure consumer understanding and to mitigate the risk of any behavioral backfiring (Stibe & Cugelman, 2016). Any gambling warning label should also ideally leverage insights from the behavioral risk communication literature (Garcia-Retamero & Cokely, 2017), which current UK electronic gambling machine labels do not (Collins et al., 2014; Rowe et al., 2017). And, if warning labels are not effective at protecting consumers, then stronger public health interventions should also be considered (Nuffield Council on Bioethics, 2007). These are all important goals for future research. This paper tackles a more fundamental issue in soccer betting: risks must be understood before they can be communicated.
This paper will use machine learning to investigate how product risk varies across the largest dataset of past betting odds and results available to us. The aim is to uncover information relevant to the concept of “responsible gambling”:
“If gambling is to be conceptualized as a leisure activity to be engaged in as an individual choice, …, then it is fundamental that the individual is presented with all relevant information, in a timely fashion, in order to make an informed choice.” (A. Parke, Harris, Parke, Rigbye, & Blaszczynski, 2015), p. 31.
This will be operationalized through three research questions:
RQ1. What is the variation in prediction skill across four key soccer bet types?
bet types. We have data for home-draw-away, correct score, and two other bet types (explained in the “Data” section below). The model will do this with three strategies, to mimic the variability across human sports bettors. Model performance will then be compared across bet types and strategies, using the strategies’ arithmetic average returns for comparison. If a gambler approaches a given bet type with a given strategy, this percentage gives the amount of staked money lost on average per bet.
Some human sports bettors try to get the highest return possible, by inspecting recent performance and developing knowledge about the sport. This strategy will be mimicked by a strategy we call “most-skilled.” The existence of skill can be demonstrated via showing an improvement in performance over a strategy which requires no skill (or knowledge). Therefore, to check the validity of our machine learning model, a second strategy called “Random” will be generated. For RQ1, Random places a bet on every available outcome within a bet type. For RQ1 this generates more precise estimates of what a truly random betting strategy will return than just selecting one bet at random. It should be the case that the most-skilled strategy yields higher returns than Random. However, if it’s possible to beat a random strategy, then it’s also possible to do worse than a random strategy. But there should be limits to how bad a strategy can do, as even the most unlikely events do eventually happen in sports betting (such as Leicester FC winning the 2015/2016 English Premier League). Our machine learning model will mimic the worst returns a human might get, via the “least-skilled” strategy. For RQ1 we hypothesize that the returns will be distributed within each bet type as: most-skilled > Random > least-skilled. Prediction skill likely matters more for some bet types than others, and this will also be investigated in RQ1.
RQ1 provides the best estimates of the returns from placing a single bet, under those three strategies. But many gamblers place sequences of bets from a given starting amount of dedicated gambling money, called a “bankroll.” Average arithmetic returns provide an incomplete picture for such sequences of gambles (Chen & Ankenman, 2006). RQ2 attempts to mirror the returns of the three strategies (most-skilled, Random, and least-skilled), as measured by the number of bets before half an initial amount of money is lost, on average. This should provide a more accurate measure of what repeat gamblers could experience. This research question is motivated by the statistical concept of the “Gambler’s Ruin,” which shows how a gambler with negative expected returns will eventually lose all their money (Harik, Cantú-Paz, Goldberg, & Miller, 1999; Mohan, 1955). The 10% proportion was chosen heuristically by us, in the absence of us having any human betting data to compare against (Chagas & Gomes, 2017). Larger percentage bet sizes can compress the differences between betting strategies, for example, with a bet of 50% one losing bet hits the “half-life” definition. Smaller bet sizes can do the opposite, as gamblers’ bankrolls asymptote toward lasting forever.
As with RQ1, it should be the case that, within each bet type, the strategies have half-lives of: most-skilled > Random > least-skilled. For RQ2, Random involves randomly picking one bet per bet type. This is because betting on every outcome, as in RQ1, creates a portfolio of offsetting bets which loses a small amount of money with certainty, due to the house edge, leading to an artificial boost in the bankroll half-life (and no gambler would enjoy losing a small amount of money with certainty). RQ2 therefore investigate how gamblers’ bankrolls evolve across different betting strategies and bet types.
Machine learning should ideally provide insights to help human decision makers. Humans often overestimate the likelihood of low-probability events (Kahneman & Tversky, 1979). This tendency has been reflected in sports betting via the “favorite-longshot” bias, where longshots with low winning chances yield higher an average losses for gamblers than bets on favorites (Vaughan Williams, 1999). Favorite-longshot bias has been observed in large dataset investigations of home-draw-away soccer odds (Buhagiar et al., 2018; Constantinou & Fenton, 2013). Ideally, the least-skilled strategy will look like a biased human sports bettor, while the most-skilled strategy will bet differently. Looking at recurring features of the specific bets chosen by the most- and least-skilled strategies could also help inform strategies intended to educate gamblers about observable bet attributes which are correlated with product risk.
Model
Data
We wanted to train the model on as many bet types as possible, given the ever-increasing number of ways to bet on soccer. However, long-running freely-available datasets were required, limiting the number of bet types that could be studied. Historical odds were available for the following four betting types: correct score, home-draw-away, over/under, and Asian handicap. Data for eight seasons of English Premier League soccer (the highest English club competition) betting odds and results from 2010/2011-2017/2018 were taken from oddsportal.com.
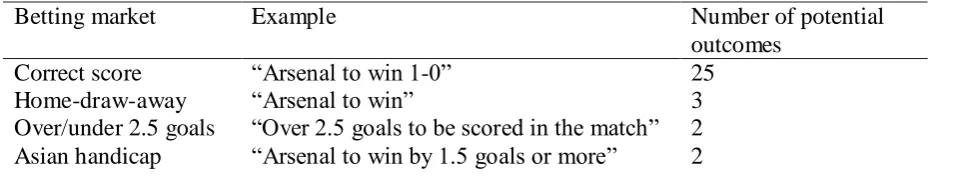
[image:13.595.65.542.681.770.2]Summary information is provided in Table 1. Of the four bet types, correct score bets stand out as an outlier in Table 1 with 25 potential outcomes. Although there is in theory no limit on the number of goals scored by both teams in a soccer match, reliable data were available only on the 24 most common scorelines. All other potential scorelines were included as a 25th catch-all outcome in the model. Home-draw-away bets have three potential outcomes (home win, draw, away win). The over/under is a bet on the number of goals scored: to be either between zero and two goals, or three or more goals (two potential outcomes). The Asian handicap performs a skill adjustment on the two teams, effectively removing the potential of a draw (e.g., Arsenal to win by 1.5 goals or more, therefore two potential outcomes).1 “Complex” bet types with many potential outcomes, such as correct score bets, have previously been associated with high house edges (Ayton, 1997), and an overestimation by soccer fans of average event probability (Newall, 2017).
Table 1. Example of betting odds data
Betting market Example Number of potential
outcomes Correct score “Arsenal to win 1-0” 25
Home-draw-away “Arsenal to win” 3
Note: Although there is potentially an infinite number of potential correct scores, reliable betting odds were only available for the 24 most-likely scorelines. Therefore, we include these 24 scorelines (either team scoring up to 4 goals, excluding 4-4) while adding a 25th catch-all outcome for any other scoreline.
The model was also given in-game statistics of recent team performance (explained at greater length in the Inputs section, below). This data was downloaded from football-data.co.uk.
Model specifications
Machine learning models approach new data sets like a cautious gambler, learning patterns between current data and future outcomes, before making any predictions (the learning phase). The first three seasons were solely used to learn from the data.2 Prediction quality on these learned associations was then assessed only in a new, unseen part of the data (the prediction phase). From the fourth season on, the model strategies placed (simulated) bets and received hypothetical returns. Because old data becomes gradually less informative, each season of prediction was based only on the previous three seasons of learning.
Prediction phase performance was available for five seasons in total: 2013/2014 – 2017/2018. Prior to running any analysis, a decision was made to discard the first five games of each season due to potentially-large between-season variations in team performance. This leaves a total sample size of 1,650 matches to compare model performance on (330 matches per-season). Each prediction is based on 990 learning phase observations (3 seasons). The required number of learning phase observations to obtain 95% statistical power is 380 for the low-complexity bet types (home-draw-away, over/under 2.5 goals, Asian handicap), and 950 for the high-complexity correct score bet type (Hsieh, Bloch, & Larsen, 1998).
Appropriate machine learning model choice depends on the underlying data’s statistical properties. Some soccer forecasting models were developed for individual matches, which is typically accounted for by multinomial logistic regression models, given the three main outcomes of a soccer match (e.g., (Khazaal et al., 2012; Koning, 2000; Willoughby, 2002)). But the present model also forecasts bet outcomes, which depend on the specific teams’ characteristics, where a conditional logistic regression is more appropriate (Smith, Paton, & Vaughan Williams, 2009). Each of these features needs to be accounted for separately. Therefore, we used a combination of multinomial and conditional (mixed) logistic regression to capture the full scope of the data (Lessmann, Sung, Johnson, & Ma, 2012; McFadden, 1974; McFadden & Train, 2000).
Inputs
seem that adding more inputs should boost predictive power. However, adding more inputs can increase the risk of “overfitting,” where chance random associations are discovered and erroneously predicted to recur in the prediction phase, hence leading to poor prediction phase performance (Yarkoni & Westfall, 2017).
Our first model input was an average of relevant match betting odds, using around an average of 30 bookmakers per data point. Betting odds have shown to successfully predict outcomes in the soccer forecasting literature (Goddard & Asimakopoulos, 2004; Štrumbelj & Šikonja, 2010; Štrumbelj, 2014). Betting odds tend to fare even better than other prediction methods, such as Elo rating systems, originally designed for chess ratings (Hvattum & Arntzen, 2010; Leitner, Zeileis, & Hornik, 2010). As is the standard in the literature, these odds were averaged, to reduce random forecast error, and were normalized to remove the effect of the house edge3 (Hvattum & Arntzen, 2010; Leitner et al., 2010).
Gamblers will often factor in recent performance. Therefore, the model was provided with in-game statistics summarizing each team’s performance over the previous five matches. Based on successful in-game predictors from the previous literature, we chose the cumulative number of points earned -- three for a win, one for a draw, and zero for a loss (Goddard & Asimakopoulos, 2004; Goddard, 2005), and the number of goals scored and conceded (Angelini & De Angelis, 2017; Baio & Blangiardo, 2010; M. Dixon & Robinson, 1998; Oberstone, 2009). Predictors which have been used in the previous literature, but were not included here include the number of: corners won (Andersson et al., 2009), shots on target (Oberstone, 2009), recent injuries (Constantinou & Fenton, 2017), and disciplinary bookings (Titman, Costain, Ridall, & Gregory, 2015).
return from each bet with different strategies. The most-skilled strategy chose the bet with the highest long-run expected return within each bet type for each match, while the least-skilled strategy chose the bet with the lowest long-run expected return.
Results
In response to RQ1, the arithmetic average percentage returns varied over both the four bet types and the three betting strategies used, as summarized in Figure 1. Figure 1 presents the results of different hypothetical bettors, so it is more accurate to present the returns as experienced by each betting strategy, rather than as the bookmaker’s overall house edge. The negative returns experienced by each strategy in figure 1 can be interpreted as showing that predictions were never able to overcome the bookmaker’s house edge. A return of -3.3% is equivalent to a house edge of 3.3%, or equivalently a return-to-player of 96.7%. In each bet type it can be seen that the most-skilled prediction performed best, the least-skill strategy performed worst, and Random was in the middle. Therefore, in each bet type, (positive) betting skill improved performance, while (negative) betting skill worsened performance. Prediction skill mattered most in with correct score bets. With correct score bets, the least-skilled strategy returned -58.9% on average, Random -34.3%, and the most-skilled strategy -3.3% (returns as experienced by the model). No other betting strategy experienced returns worse than -10% per-bet (even the least-skilled strategies). And in the other three bet types, the per-bet difference in returns across the three betting strategies was 7% or under. Prediction skill always mattered, but especially with correct score bets (where there were many potential outcomes).
performance, which was most-skilled Asian handicap, -1.1%. The variation in relative performance was large. The least-skilled correct score strategy lost 54.0 times more per-bet than the lowest-lost performance. High relative losses were not unique to correct score bets, with for example the least-skilled home-draw-away strategy losing 8.0 times more per-bet than the lowest-loss performance.
Figure 1: Prediction skill variability over each bet type and strategy.
Table 2. Relative per-bet losses (in percentages), standardized so the lowest loss strategy (Asian handicap, most-skilled) = 1.
Strategy Correct Score
Home-Draw-Away
Over/Under Asian Handicap
Least-skilled 54.0 8.0 7.2 5.0
Random 31.5 6.5 5.5 2.9
Most-skilled 3.0 1.6 3.8 1.0 (-1.09%)
-65% -60% -55% -50% -45% -40% -35% -30% -25% -20% -15% -10% -5% 0%
Asian Handicap Over/Under Home-Draw-Away Correct Score
Average return
[image:18.595.70.487.599.707.2]The half-life measured the number of bets before an average of 50% of starting wealth was lost (betting 10% of remaining wealth per-match). Half-life variation is summarized in Figure 2, in response to RQ2. Similar to Figure 1, the most-skilled strategy had the highest life across each of the four bet types, and the least-skilled strategy had the smallest half-life. Correct score bets had half-lives of 10.8 to 7.0 bets, making it an outlier compared to the other three bet types. The other three bet types had least-skilled half-lives of 22.2 (home-draw-away), 52.2 (over/under), and 64.4 bets (Asian handicap), all performing better than the most-skilled correct score strategy. A comparison of relative half-lives in Table 3 highlights the large differences. The highest half-life strategy (Asian handicap, most-skilled, 129.6 bets), lasted 18.5 times the lowest half-life strategy (correct score, least-skilled, 7.0 bets). There was again a large spread in betting outcomes, as measured by the half-life. All correct score betting strategies had low half-lives because this is the most volatile bet type.
Figure 2. Half-life variability over each betting market and strategy.
Table 3. Relative half-lives (in number of bets), standardized so the lowest half-life strategy (Correct score, least-skilled) = 1.
0 10 20 30 40 50 60 70 80 90 100 110 120 130 140
Asian Handicap Over/Under Home-Draw-Away Correct Score
Half-life: number of bets
Strategy Correct Score Home-Draw-Away
Over/Under Asian Handicap Least-skilled 1.0 (7.0 bets) 3.2 7.5 9.2
Random 1.3 4.3 10.7 9.9
Most-skilled 1.5 8.3 14.0 18.5
Next we investigated the outcomes chosen by the most- and least-skilled prediction strategies across each bet type. Figure 3 provides an answer to RQ3. There are clear
differences, as the most-skilled strategy preferred low-scoring home wins with correct score bets (panel a), and home wins with home-draw-away bets (panel b). Figure 3 also provides the average decimal odds across each outcome shown on the x-axis. The decimal odds represent the total payoff from a successful bet of $1 (Cortis, 2015). The higher the decimal odds, the more extreme a longshot the bet is. In soccer, the team playing at home is usually the favorite to win (due to home advantage). By convention, the home team’s score is written first, so a scoreline of 2-0 translates to the home team scoring twice and not conceding.
(33.9%, average decimal odds = 81.9). (Each scoreline is estimated separately by the models, we have grouped similar scorelines together for simplicity.) The most-skilled strategy tended to bet on favorites, while the least-skilled strategy tended to bet on lower-probability
longshots, reflecting the established human bias of overweighting small probabilities (Kahneman & Tversky, 1979)
a) b) 81.9 28.2 11.8 25.4 17.0 45.8 116.2 0% 5% 10% 15% 20% 25% 30% 35% 40% 45% 50% 55% 60% 65%
4-0 3-0 1-0 0-0 0-1 0-3 0-4
4-1 3-1 2-0 1-1 0-2 1-3 1-4
4-2 3-2 2-1 2-2 1-2 2-3 2-4
4-3 . . 3-3 . . 3-4
Choice frequency: Correct Score
Most-skilledc) d) 2.8 4.0 4.8 0% 5% 10% 15% 20% 25% 30% 35% 40% 45% 50% 55% 60% 65% 70%
Home Win Draw Away Win
Choice frequency: Home-Draw-Away
Most-skilled Least-skilled
1.9 2.0
0% 5% 10% 15% 20% 25% 30% 35% 40% 45% 50% 55% 60% 65%
Over 2.5 goals Under 2.5 goals
Choice frequency: Over/Under
Most-skilledFigure 3. Most- and least-skilled specific choice frequencies across each betting market. The decimal odds are shown above each x-axis category, showing the total average payoff from a successful bet of $1. Similar scorelines were grouped together in panel a), although the model estimates frequencies for each scoreline separately. By convention, scorelines are written as home team score - away team score.
Discussion
The introduction called soccer betting a “skill-based gambling form.” In support of this claim, it was found that prediction skill mattered in each of the four soccer bet types. Most strikingly, it was found that the gamblers’ losses varied by a factor of 54 (from 1.1% to 58.9%). To return to the alcohol ABV% comparison from the Introduction, this is like the difference between a reduced-alcohol lager and a strong whiskey. Meanwhile, the “half-life” number of bets before a starting bankroll fell in half varied by a factor of 18.5 (from 7.0 to 129.6 bets). The large number of outcomes makes every correct score bet a longshot with
1.9 1.9
0% 5% 10% 15% 20% 25% 30% 35% 40% 45% 50% 55% 60% 65% 70% 75% 80%
Home Win Away Win
Choice frequency: Asian Handicap
Most-skilledcorrect score bets, compared to the three other bet types. Usually starving, but occasionally feasting, is a poor way to maintain wealth on average over time. This suggests that
responsible gamblers should limit their exposure to volatile bet types such as correct score bets. The least-skilled strategy tended to bet on lower-probability longshots, reflecting the established human bias of overweighting small probabilities (Kahneman & Tversky, 1979). But how else might these results be relevant to the topic of responsible gambling in humans?
The wide variation in gamblers’ losses here contrasts with European roulette, where each possible bet has a constant house edge of 2.7%. This variability in soccer betting only increases the amount of information which should be given to gamblers, in keeping with responsible gambling principles (A. Parke et al., 2015). But at present, UK soccer bets are marketed with only the betting odds, and generic advice such as, “when the fun stops, stop.” By contrast, the more informative house edge is currently communicated to electronic machine gamblers as the “return-to-player” percentage (J. Parke et al., 2016). And, from April 2019, a £2 wagering limit will be placed on UK electronic gambling machines (Casey, 2018). By comparison, soccer betting, which is the most popular form of gambling with British problem gamblers (Gambleaware, 2017), has seen neither element of consumer protection.
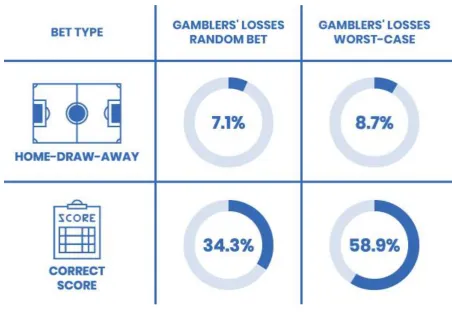
Providing more information to soccer bettors could be seen as an informational “nudge” (Thaler & Sunstein, 2008), as an example of “boosting” (Hertwig, 2017), or of consumer education (Peters, 2017). Figure 4 provides an example of how more information could be given for home-draw-away and correct score bets, the two bet types from this paper which have been seen in observational studies of UK gambling advertising (Newall et al., 2018; Newall, 2015; Newall, 2017). Figure 4 provides a prototype example of how the
much information to consumers, such as the most-skilled strategy returns, which could plausibly cause confusion given that sports fans are prone to wishful thinking (Babad, 1987).
Figure 4. Example of warning labels for home-draw-away and correct score markets. The “worst-case” column corresponds to the returns of the least-skilled prediction strategy.
some British bookmakers appear to be currently competing to create new bets with high betting odds, which consumers observe, but high hidden house edges (Newall, 2019).
There are many aspects of any new warning label which should first be empirically tested. Any new warning label should ideally be trialled in both the laboratory and in the field before being introduced into the population, to mitigate the risk of any behavioral backfiring (Stibe & Cugelman, 2016). For example, qualitative research suggests that some young drinkers use ABV% information to find cost-effective ways of maximizing their alcohol consumption (Jones & Gregory, 2009; Maynard et al., 2017). While we think that few gamblers will want to purposively maximize their gambling losses, there are other issues from other public health domains of potential relevance gambling risk communication. Any warning label should ideally be as attention grabbing as other product features. One eye-tracking study of alcohol warning labels showed that participants spent only 7% of their time looking at current UK alcohol warning labels (Kersbergen & Field, 2017). The tobacco literature demonstrates that larger warning labels are the most effective (Hammond, 2011), which is relevant to any new warning label and to present return-to-player warning labels. Previous gambling research showed that many regular electronic machine gamblers had not even seen return-to-player warning labels before (Collins et al., 2014), and that many
gamblers find return-to-player warning labels confusing (Collins et al., 2014; Harrigan et al., 2017; Rowe et al., 2017). The behavioral risk communication literature suggests for example that visual aids could boost gamblers’ risk understanding (Garcia-Retamero & Cokely, 2017).
Another approach is to educate gamblers not about statistical risks, but about
longshots have higher average losses than bets on favorites. This is unlike European roulette, where the potential payoff and event probability are perfectly negatively correlated to create a constant average loss of 2.7%. A public health awareness campaign could therefore seek to warn gamblers about the above-average risks of longshot soccer bets. There is some evidence that sports bettors do learn to improve their returns over time, partly by avoiding longshots (Feess, Müller, & Schumacher, 2014). This natural learning process could be enhanced with more explicit advice.
It could be the case that warning labels and education campaigns are an insufficient intervention to debias consumers about the complex statistical information underlying modern soccer bets (Weiss-Cohen, Konstantinidis, Speekenbrink, & Harvey, 2018), and given the messages in gambling marketing prompting more frequent and riskier gambling (Hing, Russell, Li, & Vitartas, 2018; Hing, Russell, Thomas, & Jenkinson, 2019). This may particularly be the case in soccer betting, given evidence that sports fans are prone to wishful thinking (Babad, 1987), and are overconfident even when the financial stakes are high (Simmons & Massey, 2012). If this is the case, than less freedom-preserving public health interventions should also be considered (Nuffield Council on Bioethics, 2007). For example, a stronger intervention is to “restrict choice,” which is already being used for UK electronic gambling machines, where the maximum bet size will be reduced from £100 to £2 from April 2019 (Casey, 2018). Tax incentives are also being used in UK alcohol policy, with stronger forms of alcohol being subject to different rates of tax duty than lower strength alcohol. Any public health intervention should be informed by the fundamental data on product risk which this paper attempts to uncover for soccer betting.
bettors is data that we did not have access to for this paper. Data on human betting volume could plausibly highlight a different set of high-loss soccer bets that are important for the promotion of responsible gambling. We hope that gambling operators will share more data on gamblers’ actual behavior (Cassidy, Loussouarn, & Pisac, 2013), in order to determine the extent to which these machine learning strategies reflect actual differences in human betting skill, and to enable further research on responsible gambling in humans.
References
Andersson, P., Edman, J., & Ekman, M. (2005). Predicting the world cup 2002 in soccer: Performance and confidence of experts and non-experts. International Journal of Forecasting, 21(3), 565-576.
Andersson, P., Memmert, D., & Popowicz, E. (2009). Forecasting outcomes of the world cup 2006 in football: Performance and confidence of bettors and laypeople. Psychology of Sport and Exercise, 10(1), 116-123.
Angelini, G., & De Angelis, L. (2017). PARX model for football match predictions. Journal of Forecasting, 36(7), 795-807.
Ayton, P. (1997). How to be incoherent and seductive: Bookmakers' odds and support theory. Organizational Behavior and Human Decision Processes, 72(1), 99-115.
Babad, E. (1987). Wishful thinking and objectivity among sports fans. Social Behaviour, 2(4), 231-240.
Baio, G., & Blangiardo, M. (2010). Bayesian hierarchical model for the prediction of football results. Journal of Applied Statistics, 37(2), 253-264.
Bajgrowicz, P., & Scaillet, O. (2012). Technical trading revisited: False discoveries, persistence tests, and transaction costs. Journal of Financial Economics, 106(3), 473-491.
Buhagiar, R., Cortis, D., & Newall, P. W. S. (2018). Why do some soccer bettors lose more money than others? Journal of Behavioral and Experimental Finance, 18(2018), 85-93. doi:10.1016/j.jbef.2018.01.010
Casey, J. (2018). UK government confirms FOBT change now set for april 2019. Retrieved from https://www.gambling.com/news/uk-government-confirms-fobt-change-now-set-for-april-2019-1674400
Cassidy, R., Loussouarn, C., & Pisac, A. (2013). Fair game: Producing gambling research - the goldsmiths report. London: Goldsmiths, University of London.
Chagas, B. T., & Gomes, J. F. (2017). Internet gambling: A critical review of behavioural tracking research. Journal of Gambling Issues, (36) doi:10.4309/jgi.2017.36.1
Chen, B., & Ankenman, J. (2006). The mathematics of poker. Pittsburgh, Pennsylvania: ConJelCo LLC.
Collins, D., Green, S., d'Ardenne, J., Wardle, H., & Williams, S. (2014). Understanding of return to player messages: Findings from user testing. London: NatCen Social Research.
Constantinou, A. C., & Fenton, N. E. (2013). Profiting from arbitrage and odds biases of the european football gambling market. The Journal of Gambling Business and Economics, 7(2), 41-70.
Cortis, D. (2015). Expected values and variances in bookmaker payouts: A theoretical
approach towards setting limits on odds. The Journal of Prediction Markets, 9(1), 1-14.
Dixon, M. J., & Pope, P. F. (2004). The value of statistical forecasts in the UK association football betting market. International Journal of Forecasting, 20(4), 697-711.
Dixon, M., & Robinson, M. (1998). A birth process model for association football matches. Journal of the Royal Statistical Society: Series D (the Statistician), 47(3), 523-538.
Feess, E., Müller, H., & Schumacher, C. (2014). The favorite-longshot bias and the impact of experience. Business Research, 7(2), 217-234.
Forrest, D. (2008). Soccer betting in britain. In D. B. Hausch, & W. T. Ziemba (Eds.), Handbook of sports and lottery markets (pp. 421-446) Elsevier. doi:10.1016/B978-044450744-0.50023-8
Gambleaware. (2017). Remote gambling research: Interim report on phase II. Retrieved from
https://about.gambleaware.org/media/1549/gamble-aware_remote-gambling-research_phase-2_pwc-report_august-2017-final.pdf
Garcia-Retamero, R., & Cokely, E. T. (2017). Designing visual aids that promote risk literacy: A systematic review of health research and evidence-based design heuristics. Human Factors, 59(4), 582-627.
Goddard, J. (2005). Regression models for forecasting goals and match results in association football. International Journal of Forecasting, 21(2), 331-340.
Hammond, D. (2011). Health warning messages on tobacco products: A review. Tobacco Control, 20(5), 327-337. doi:10.1136/tc.2010.037630 [doi]
Harik, G., Cantú-Paz, E., Goldberg, D. E., & Miller, B. L. (1999). The gambler's ruin problem, genetic algorithms, and the sizing of populations. Evolutionary Computation, 7(3), 231-253.
Harrigan, K., Brown, D., & Barton, K., R. (2017). Classification of slot machines in ontario: Providing relevant information to players. Guelph, Ontario, Canada: Gambling Research Exchange Ontario.
Harvey, C. R., & Liu, Y. (2015). Backtesting. Journal of Portfolio Management, 42(1), 13-28.
Hertwig, R. (2017). When to consider boosting: Some rules for policy-makers. Behavioural Public Policy, 1(2), 143-161.
Hill, I. (1974). Association football and statistical inference. Applied Statistics, 23(2), 203-208.
Hing, N., Russell, A. M., Li, E., & Vitartas, P. (2018). Does the uptake of wagering
inducements predict impulse betting on sport? Journal of Behavioral Addictions, 7(1), 146-157.
Hing, N., Russell, A. M., Thomas, A., & Jenkinson, R. (2019). Wagering advertisements and inducements: Exposure and perceived influence on betting behaviour. Journal of
Hsieh, F. Y., Bloch, D. A., & Larsen, M. D. (1998). A simple method of sample size
calculation for linear and logistic regression. Statistics in Medicine, 17(14), 1623-1634.
Hvattum, L. M., & Arntzen, H. (2010). Using ELO ratings for match result prediction in association football. International Journal of Forecasting, 26(3), 460-470.
Jones, S. C., & Gregory, P. (2009). The impact of more visible standard drink labelling on youth alcohol consumption: Helping young people drink (ir) responsibly? Drug and Alcohol Review, 28(3), 230-234.
Kahneman, D., & Tversky, A. (1979). Prospect theory: An analysis of decision under risk. Econometrica, 47(2), 263-292.
Kasparov, G. (2017). Deep thinking: Where machine intelligence ends and human creativity begins. London, UK: John Murray.
Kaunitz, L., Zhong, S., & Kreiner, J. (2017). Beating the bookies with their own numbers-and how the online sports betting market is rigged. arXiv Preprint arXiv:1710.02824,
Kersbergen, I., & Field, M. (2017). Alcohol consumers’ attention to warning labels and brand information on alcohol packaging: Findings from cross-sectional and experimental studies. BMC Public Health, 17(1), 123.
Khazaal, Y., Chatton, A., Billieux, J., Bizzini, L., Monney, G., Fresard, E., . . . Zullino, D. (2012). Effects of expertise on football betting. Substance Abuse Treatment, Prevention, and Policy, 7(18)
Korn, D. A., & Shaffer, H. J. (1999). Gambling and the health of the public: Adopting a public health perspective. Journal of Gambling Studies, 15(4), 289-365.
Kuypers, T. (2000). Information and efficiency: An empirical study of a fixed odds betting market. Applied Economics, 32(11), 1353-1363.
Leitner, C., Zeileis, A., & Hornik, K. (2010). Forecasting sports tournaments by ratings of (prob) abilities: A comparison for the EURO 2008. International Journal of Forecasting, 26(3), 471-481.
Lessmann, S., Sung, M., Johnson, J. E., & Ma, T. (2012). A new methodology for generating and combining statistical forecasting models to enhance competitive event prediction. European Journal of Operational Research, 218(1), 163-174.
Livingstone, C., & Woolley, R. (2007). Risky business: A few provocations on the regulation of electronic gaming machines. International Gambling Studies, 7(3), 361-376.
Lopez-Gonzalez, H., Estévez, A., & Griffiths, M. (2017). Marketing and advertising online sports betting: A problem gambling perspective. Journal of Sport and Social Issues, 41(3), 256-272.
Markham, F., & Young, M. (2015). “Big gambling”: The rise of the global industry-state gambling complex. Addiction Research & Theory, 23(1), 1-4.
Markham, F., Young, M., & Doran, B. (2016). The relationship between player losses and gambling‐related harm: Evidence from nationally representative cross‐sectional surveys in four countries. Addiction, 111(2), 320-330.
Maynard, O. M., Langfield, T., Attwood, A. S., Allen, E., Drew, I., Votier, A., & Munafò, M. R. (2017). No impact of calorie or unit information on ad libitum alcohol consumption. Alcohol and Alcoholism, 53(1), 12-19.
McFadden, D. (1974). Conditional logit analysis of qualitative choice behavior. In P.
Zarembka (Ed.), Frontiers in econometrics (pp. 105-142). New York: Academic Press.
McFadden, D., & Train, K. (2000). Mixed MNL models for discrete response. Journal of Applied Econometrics, 15(5), 447-470.
Metz, C. (2016). The sadness and beauty of watching google's ai play go. Retrieved from https://www.wired.com/2016/03/sadness-beauty-watching-googles-ai-play-go/
Mohan, C. (1955). The gambler's ruin problem with correlation. Biometrika, 42(3/4), 486-493.
Moravčík, M., Schmid, M., Burch, N., Lisý, V., Morrill, D., Bard, N., . . . Bowling, M. (2017). DeepStack: Expert-level artificial intelligence in heads-up no-limit poker. Science, 356(6337), 508-513. doi:10.1126/science.aam6960
Newall, P. W. S., Thobhani, A., Walasek, L. & Meyer, C. (2018). “Impulsiveness and urgency:” Gambling advertising and the 2018 soccer world cup. Retrieved from https://psyarxiv.com/3uc9s
Newall, P. W. S. (2015). How bookies make your money. Judgment and Decision Making, 10(3), 225-231.
Newall, P. W. S. (2019). Dark nudges in gambling. Addiction Research & Theory, 27(2), 65-67. doi:10.1080/16066359.2018.1474206
Newall, P. W. S. (2017). Behavioral complexity of british gambling advertising. Addiction Research & Theory, 25(6), 505-511. doi:10.1080/16066359.2017.1287901
Nuffield Council on Bioethics. (2007). Public health: Ethical issues. UK: Cambridge Publishers.
Oberstone, J. (2009). Differentiating the top english premier league football clubs from the rest of the pack: Identifying the keys to success. Journal of Quantitative Analysis in Sports, 5(3)
Orford, J. (2010). An unsafe bet?: The dangerous rise of gambling and the debate we should be having. Singapore: John Wiley & Sons.
Parke, J., Parke, A., & Blaszczynski, A. (2016). Key issues in product-based harmm minimisation: Examining theory, evidence and policy issues relevant in great britain. London: Responsible Gambling Trust.
Peters, E. (2017). Educating good decisions. Behavioural Public Policy, 1(2), 162-176.
Pleskac, T. J., & Hertwig, R. (2014). Ecologically rational choice and the structure of the environment. Journal of Experimental Psychology: General, 143(5), 2000-2019.
Portman Group. (2017). A review of research into the impacts of alcohol warning labels on attitudes and behaviour. Retrieved from http://www.portmangroup.org.uk/docs/default-source/alcohol-health-toolkit/final-for-publication-08-sept-17.pdf?sfvrsn=2
Potter van Loon, R. J., van den Assem, M. J., & van Dolder, D. (2015). Beyond chance? the persistence of performance in online poker. PloS One, 10(3), e0115479.
doi:10.1371/journal.pone.0115479 [doi]
Purdum, D. (2018). Inside how sports betting went mainstream. Retrieved from
http://www.espn.com/chalk/story/_/id/24310393/gambling-how-media-daily-fantasy-new-thinking-us-pro-sports-commissioners-helped-sports-betting-become-accepted
Rowe, B., De Ionno, D., Holland, J., Flude, C., Brodrick, L., Vinay, A., . . . Moutos, M. (2017). Responsible gambling: Collaborative innovation identifying good practice and inspiring change Revealing Reality.
Smith, M. A., Paton, D., & Vaughan Williams, L. (2009). Do bookmakers possess superior skills to bettors in predicting outcomes? Journal of Economic Behavior & Organization, 71(2), 539-549.
Stark, D., & Cortis, D. (2017). Balancing the book: Is it necessary and sufficient? The Journal of Gambling Business and Economics, 11(1), 1-6.
Stibe, A., & Cugelman, B. (2016). Persuasive backfiring: When behavior change
interventions trigger unintended negative outcomes. In A. Meschtscherjakov, B. De Ruyter, V. Fuchsberger, M. Murer & M. Tscheligi (Eds.), Persuasive technology (pp. 65-77) Springer.
Štrumbelj, E. (2014). On determining probability forecasts from betting odds. International Journal of Forecasting, 30(4), 934-943.
Štrumbelj, E., & Šikonja, M. R. (2010). Online bookmakers’ odds as forecasts: The case of european soccer leagues. International Journal of Forecasting, 26(3), 482-488.
Thaler, R. H., & Sunstein, C. R. (2008). Nudge: Improving decisions about health, wealth, and happiness. New Haven, CT: Yale University Press.
Thorp, E. O. (1998). The invention of the first wearable computer. Paper presented at the Wearable Computers, 1998. Digest of Papers. Second International Symposium on
Wearable Computers. 4-8.
Vaughan Williams, L. (1999). Information efficiency in betting markets: A survey. Bulletin of Economic Research, 51(1), 1-39.
Weiss-Cohen, L., Konstantinidis, E., Speekenbrink, M., & Harvey, N. (2018). Task complexity moderates the influence of descriptions in decisions from experience. Cognition, 170, 209-227.
Willoughby, K. A. (2002). Winning games in canadian football: A logistic regression analysis. The College Mathematics Journal, 33(3), 215-220.
Woolley, R., Livingstone, C., Harrigan, K., & Rintoul, A. (2013). House edge: Hold
percentage and the cost of EGM gambling. International Gambling Studies, 13(3), 388-402.
Yarkoni, T., & Westfall, J. (2017). Choosing prediction over explanation in psychology: Lessons from machine learning. Perspectives on Psychological Science, 12(6), 1100-1122.
Footnotes
1There are a small number of instances where the Asian handicap was set as a discrete
number of goals, e.g. Arsenal to win by 1 goal or more. Then, if Arsenal do in fact win by exactly 1 goal, a third outcome is created where the bet neither wins nor loses, a “push.” In this instance the original stake is returned to the gambler.
2
Machine learning does not have strong methodological norms over what proportion of the data to use for learning and prediction. Even for similar research questions, splits as variable as 90-10 (Harvey & Liu, 2015) and 50-50 (Bajgrowicz & Scaillet, 2012) have been observed. Given the limits on our time-series (eight seasons), we chose a conservative ratio of three learning phase seasons for every prediction phase season, to reduce potential problems from more extreme ratios. Other learning/prediction phase splits were not tested.
3