Using Domain Similarity for Performance Estimation
Vincent Van Asch
CLiPS - University of Antwerp Antwerp, Belgium
Walter Daelemans
CLiPS - University of Antwerp Antwerp, Belgium
Abstract
Many natural language processing (NLP) tools exhibit a decrease in performance when they are applied to data that is lin-guistically different from the corpus used during development. This makes it hard to develop NLP tools for domains for which annotated corpora are not available. This paper explores a number of metrics that attempt to predict the cross-domain per-formance of an NLP tool through statis-tical inference. We apply different sim-ilarity metrics to compare different do-mains and investigate the correlation be-tween similarity and accuracy loss of NLP tool. We find that the correlation between the performance of the tool and the sim-ilarity metric is linear and that the latter can therefore be used to predict the perfor-mance of an NLP tool on out-of-domain data. The approach also provides a way to quantify the difference between domains.
1 Introduction
Domain adaptation has recently turned into a broad field of study (Bellegarda, 2004). Many re-searchers note that the linguistic variation between training and testing corpora is an important fac-tor in assessing the performance of an NLP tool across domains. For example, a tool that has been developed to extract predicate-argument structures from abstracts of biomedical research papers, will exhibit a lower performance when applied to legal texts.
However, the notion of domainis mostly arbi-trarily used to refer to some kind of semantic area. There is unfortunately no unambiguous measure to assert a domain shift, except by observing the performance loss of an NLP tool when applied across different domains. This means that we typ-ically need annotated data to reveal a domain shift.
In this paper we will show how unannotated data can be used to get a clearer view on how datasets differ. This unsupervised way of looking at data will give us a method to measure the difference be-tween data sets and allows us to predict the perfor-mance of an NLP tool on unseen, out-of-domain data.
In Section 2 we will explain our approach in detail. In Section 3 we deal with a case study involving basic part-of-speech taggers, applied to different domains. An overview of related work can be found in Section 4. Finally, Section 5 con-cludes this paper and discusses options for further research.
2 Approach
When developing an NLP tool using supervised learning, annotated data with the same linguistic properties as the data for which the tool is devel-oped is needed, but not always available. In many cases, this means that the developer needs to col-lect and annotate data suited for the task. When this is not possible, it would be useful to have a method that can estimate the performance on cor-pus B of an NLP tool trained on corcor-pus A in an unsupervised way, i.e., without the necessity to an-notate a part of B.
In order to be able to predict in an unsupervised way the performance of an NLP tool on different corpora, we need a way to measure the differences between the corpora. The metric at hand should be independent from the annotation labels, so that it can be easily applied on any given corpus. The aim is to find a metric such that the correlation be-tween the metric and the performance is statisti-cally significant. In the scope of this article the conceptmetricstands for any way of assigning a sufficiently fine-grained label to a corpus, using only unannotated data. This means that, in our view, a metric can be an elaborate mixture of fre-quency counts, rules, syntactic pattern matching or
even machine learner driven tools. However, in the remainder of this paper we will only look at fre-quency based similarity metrics since these met-rics are easily applicable and the experiments con-ducted using these metrics were already encourag-ing.
3 Experimental design
3.1 Corpus
We used data extracted from the British National Corpus (BNC) (2001) and consisting of written books and periodicals1. The BNC annotators pro-vided 9 domain codes (i.e. wridom), making it possible to divide the text from books and peri-odicals into 9 subcorpora. These annotated se-mantic domains are: imaginative (wridom1), nat-ural & pure science (wridom2), applied science (wridom3), social science (wridom4), world af-fairs (wridom5), commerce & finance (wridom6), arts (wridom7), belief & thought (wridom8), and leisure (wridom9).
The extracted corpus contains sentences in which every token is tagged with a part-of-speech tag as defined by the BNC. Since the BNC has been tagged automatically, using the CLAWS4 au-tomatic tagger (Leechet al., 1994) and the Tem-plate Tagger (Paceyet al., 1997), the experiments in this article are artificial in the sense that they do not learnrealof-speech tags but rather part-of-speech tags as they are assigned by the auto-matic taggers.
3.2 Similarity metrics
To measure the difference between two corpora we implemented six similarity metrics: R´enyi2 (R´enyi, 1961), Variational (L1) (Lee, 2001), Euclidean (Lee, 2001), Cosine (Lee, 2001), Kullback-Leibler (Kullback and Leibler, 1951) and Bhattacharyya coefficient (Comaniciu et al., 2003; Bhattacharyya, 1943). We selected these measures because they are well-described and pro-duce results for this task in an acceptable time span.
The metrics are computed using the relative fre-quencies of words. For example, to calculate the
1This is done by selecting texts with BNC category codes
for text type (i.e. alltyp3 (written books and periodicals)) and for medium (i.e. wrimed1 (book), wrimed2 (periodical), and wrimed3 (miscellaneous: published)).
2The R´enyi divergence has a parameterαand
Kullback-Leibler is a special case of the R´enyi divergence, viz. with
α= 1.
R´enyi divergence between corpusP and corpusQ the following formula is applied:
Renyi´ (P;Q;α) = (α−11)log2 Pkp1k−αqαk
!
pkis the relative frequency of a tokenkin the first corpusP, andqkis the relative frequency of tokenkin the second corpusQ.αis a free param-eter and withα= 1the R´enyi divergence becomes equivalent to the Kullback-Leibler divergence.
Rényi 0.99 Euclidean
LESS SIMILAR MORE SIMILAR social-art social-belief social-world
social-imaginative
art-social
MORE SIMILAR
LESS SIMILAR social-art social-belief social-world
[image:2.595.311.522.227.384.2]social-imaginative
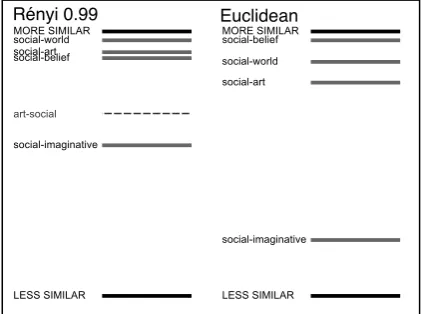
Figure 1: A visual comparison of two similarity metrics: R´enyi withα= 0.99and Euclidean.
Figure 1 gives an impression of the difference between two similarity metrics: R´enyi (α= 0.99) and Euclidean. Only four domain combinations are shown for the sake of clarity. From the graph it can be observed that thesocialandimaginative domains are the least similar in both cases. Be-sides the different ordering, there is also a differ-ence in symmetry. Contrary to the symmetric Eu-clidean metric, the R´enyi scores differ, depending on whethersocial constitutes the test set and art the training set, or vice versa. The dashed line on Figure 1 (left) is a reverse score, namely for art-social. A divergence score may diverge a lot from its reverse score.
according to the Pearson product-moment corre-lation. For majority this correlation was 0.91, for Mbt 0.93, and for SVMTool 0.93.
3.3 Part-of-speech tagging
The experiments carried out in the scope of this article are all part-of-speech (POS) tagging tasks. There are 91 different POS labels in the BNC cor-pus which are combinations of 57 basic labels. We used three algorithms to assign part-of-speech la-bels to the words from the test corpus:
MajorityThis algorithm assigns the POS label
that occurs most frequently in the training set for a given word, to the word in the test set. If the word did not occur in train, the overall most frequent tag was used.
Memory based POS tagger (Daelemans and
van den Bosch, 2005) A machine learner that stores examples in memory (Mbt) and uses the kNN algorithm to assign POS labels. The default settings were used.
SVMTool POS tagger(Gim´enez and M´arquez,
2004) Support vectors machines in a sequential setup are used to assign the POS labels. The de-fault settings were used.
3.4 Results and analysis
Figure 2 shows the outcome of 72 cross-validation experiments on the data from the British National Corpus. The graph for the majority baseline is shown in Figure 2a. The results for the memory based tagger are shown in Figure 2b and the graph for SVMTool is displayed in Figure 2c.
For every domain, the data is divided into five parts. For all pairs of domains, each part from the training domain is paired with each part from the testing domain. This results in a 25 cross-validation cross-domain experiment. A data point in Figure 2 is the average outcome of such a 25 fold experiment. The abscissa of a data point is the R´enyi similarity score between the train-ing and testtrain-ing component of an experiment. The α parameter was set to 0.99. We propose that the higher (less negative) the similarity score, the more similar training and testing data are.
The ordinate is the accuracy of the POS tagging experiment. The dotted lines are the 95% predic-tion intervals for every data point. These bound-aries are obtained by linear regression using all other data points. The interpretation of the inter-vals is that any point, given all other data points
25 20 15 10 5
Rényi divergence score with alpha=0.99 74
76 78 80 82 84 86 88 90 92
Majority accuracy (%)
(72 data points) Majority accuracy prediction
95% prediction interval
(a) Majority POS tagger.
25 20 15 10 5
Rényi divergence score with alpha=0.99 86
87 88 89 90 91 92 93 94 95
Mbt accuracy (%)
(72 data points) Mbt accuracy prediction
95% prediction interval
(b) Memory based POS tagger.
25 20 15 10 5
Rényi divergence score with alpha=0.99 88
89 90 91 92 93 94 95 96
SVMTool accuracy (%)
(72 data points) SVMTool accuracy prediction
95% prediction interval
[image:3.595.321.510.75.600.2](c) SVMTool POS tagger.
Figure 2: The varying accuracy of three POS tag-gers with varying distance between train and test corpus of different domains.
Majority Mbt SVMTool average accuracy 84.94 91.84 93.48 standard deviation 2.50 1.30 1.07
Table 1: Average accuracy and standard deviation on 72 cross-validation experiments.
when taking the middle of the interval as the ex-pected accuracy, the maximum error is 0.8% for SVMTool. Since the difference between the best and worst accuracy score is 4.93%, using linear re-gression means that one can predict the accuracy three times better. For Mbt with a range of 5.84% between best and worst accuracy and for majority with 12.7%, a similar figure is obtained.
Table 1 shows the average accuracies of the al-gorithms for all 72 experiments. For this article, the absolute accuracy of the algorithms is not un-der consiun-deration. Therefore, no effort has been made to improve on these accuracy scores. One can see that the standard deviation for SVMTool and Mbt is lower than for majority, suggesting that these algorithms are less susceptible to domain variation.
The good linear fit for the graphs of Figure 2 cannot be reproduced with every algorithm. For algorithms that do not have a sufficiently strong re-lation between training corpus and assigned class label, the linear relation is lost. Clearly, it remains feasible to compute an interval for the data points, but as a consequence of the non-linearity, the pre-dicted intervals would be similar or even bigger than the difference between the lowest and highest accuracy score.
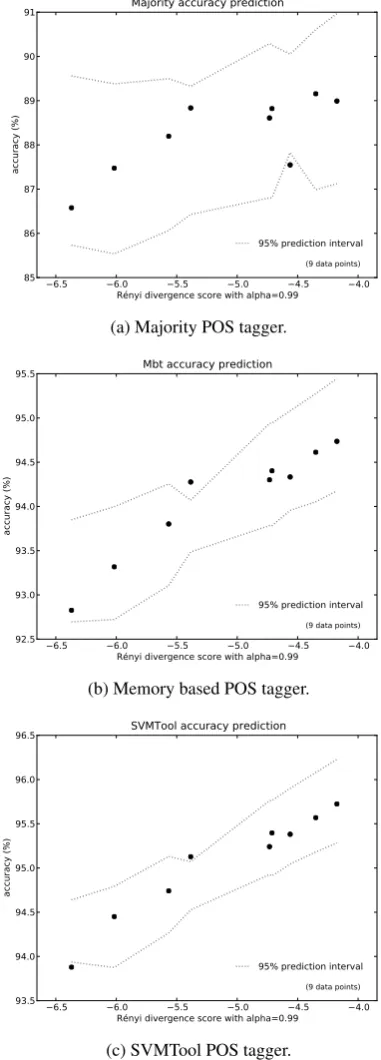
In Figure 3 the experiments of Figure 2 are reproduced using test and training sets from the same domain. Since we used the same data sets as for the out-of-domain experiments, we had to carry out 20 fold cross-validation for these exper-iments. Because of this different setup the results are shown in a different figure. There is a data point for every domain.
Although the average distance between test and training set are smaller for in-domain experiments, we still observe a linear relation for Mbt and SVM, for majority there is still a visual hint of linearity. For in-domain the biggest difference between test and train set is for theleisuredomain (R´enyi score: -6.0) which is very close to the smallest out-of-domain difference (-6.3 for social sciences–world affairs). This could mean that the random tion between test and train can approach the
varia-6.5 6.0 5.5 5.0 4.5 4.0
Rényi divergence score with alpha=0.99 85
86 87 88 89 90 91
accuracy (%)
(9 data points) Majority accuracy prediction
95% prediction interval
(a) Majority POS tagger.
6.5 6.0 5.5 5.0 4.5 4.0
Rényi divergence score with alpha=0.99 92.5
93.0 93.5 94.0 94.5 95.0 95.5
accuracy (%)
(9 data points) Mbt accuracy prediction
95% prediction interval
(b) Memory based POS tagger.
6.5 6.0 5.5 5.0 4.5 4.0
Rényi divergence score with alpha=0.99 93.5
94.0 94.5 95.0 95.5 96.0 96.5
accuracy (%)
(9 data points) SVMTool accuracy prediction
95% prediction interval
(c) SVMTool POS tagger.
[image:4.595.319.510.157.688.2]tion between domains but this observation is made in abstraction from the different data set sizes for in and out of domain experiments. For majority the average accuracy over all domains is 88.25% (stdev: 0.87), for Mbt 94.07% (0.63), and for SVMTool 95.06% (0.59). Which are, as expected, higher scores than the figures in Table 1.
4 Related Work
In articles dealing with the influence of domain shifts on the performance of an NLP tool, the in-domain data and out-of-domain data are taken from different corpora, e.g., sentences from movie snippets, newspaper texts and personal weblogs (Andreevskaia and Bergler, 2008). It can be ex-pected that these corpora are indeed dissimilar enough to consider them as separate domains, but no objective measure has been used to define them as such. The fact that the NLP tool produces lower results for cross-domain experiments can be taken as an indication of the presence of sepa-rate domains. A nice overview paper on statisti-cal domain adaptation can be found in Bellegarda (2004).
A way to express the degree of relatedness, apart from this well-known accuracy drop, can be found in Daum´e and Marcu (2006). They propose a domain adaptation framework containing a pa-rameterπ. Low values ofπmean that in-domain and out-of-domain data differ significantly. They also used Kullback-Leibler divergence to compute the similarity between unigram language models.
Blitzeret al. (2007) propose a supervised way of measuring the similarity between the two do-mains. They compute the Huber loss, as a proxy of the A-distance (Kifer et al., 2004), for every instance that they labeled with their tool. The re-sulting measure correlates with the adaptation loss they observe when applying a sentiment classifi-cation tool on different domains.
5 Conclusions and future work
This paper showed that it is possible to narrow down the prediction of the accuracy of an NLP tool on an unannotated corpus by measuring the similarity between this unannotated corpus and the corpus the tagger was trained on in an unsuper-vised way. A prerequisite to be able to make a reli-able prediction, is to have sufficient annotated data to measure the correlation between the accuracy and a metric. We observed that, in order to make a
prediction interval that is narrower than the differ-ence between the lowest and highest accuracy on the annotated corpora, the algorithm used, should capture sufficient information from training.
The observation that it is feasible to make re-liable predictions using unannotated data, can be of help when training a system for a task in a do-main for which no annotated data is available. As a first step, the metric resulting in the best linear fit between the metric and the accuracy should be searched. If a linear relation can be established, one can take annotated training data from the do-main that is closest to the unannotated corpus and assume that this will give the best accuracy score.
In this article we implemented a way to mea-sure the similarity between two corpora. One may decide to use such a metric to categorize the avail-able corpora for a given task into groups, depend-ing on their similarity. It should be noted that in order to do this, a symmetric metric should be used. Indeed, an asymmetric metric like the R´enyi divergence will give a different value depending on whether the similarity between corpus P and corpus Q is measured as Renyi´ (P;Q;α) or as Renyi´ (Q;P;α).
Further research should explore the usability of linear regression for other NLP tasks. Although no specific adaptation to the POS tagging task was made, it may not be straightforward to find a lin-ear relation for more complicated tasks. For such tasks, it may be useful to insert n-grams into the metric. Or, if a parser was first applied to the data, it is possible to insert syntactic features in the met-ric. Of course, these adaptations may influence the efficiency of the metric, but if a good linear relation between the metric and the accuracy can be found, the metric is useful. Another option to make the use of the metric less task dependent is by not using the distribution of the tokens but by using distributions of the features used by the ma-chine learner. Applying this more generic setup of our experiments to other NLP tools may lead to the discovery of a metric that is generally applicable.
Acknowledgments
References
Alfred V. Aho and Jeffrey D. Ullman. 1972. The
Theory of Parsing, Translation and Compiling, vol-ume 1. Prentice-Hall, Englewood Cliffs, NJ.
Alina Andreevskaia and Sabine Bergler. 2008. When Specialists and Generalists Work Together: Over-coming Domain Dependence in Sentiment Tagging.
Proceedings of the46thAnnual Meeting of the Asso-ciation for Computational Linguistics: Human Lan-guage Technologies (ACL-08:HLT), 290–298. As-sociation for Computational Linguistics. Columbus, Ohio, USA.
Jerome R. Bellegarda. 2004. Statistical language
model adaptation: review and perspectives. Speech
Communication, 42:93–108.
Anil Bhattacharyya. 1943. On a measure of divergence between two statistical populations defined by their probability distributions. Bulletin of the Calcutta Mathematical Society, 35:99–109.
John Blitzer, Mark Dredze, and Fernando Pereira.
2007. Biographies, Bollywood, Boom-boxes and
Blenders: Domain Adaptation for Sentiment
Clas-sification. Proceedings of the 45th Annual
Meet-ing of the Association of Computational LMeet-inguistics, 440–447. Association for Computational Linguis-tics. Prague, Czech Republic.
British National Corpus Consortium. 2001. The
British National Corpus, version 2 (BNC World).
Distributed by Oxford University Computing
Services on behalf of the BNC Consortium. http://www.natcorp.ox.ac.uk (Last accessed: April 2, 2010).
Dorin Comaniciu, Visvanathan Ramesh, and Peter
Meer. 2003. Kernel-Based Object Tracking. IEEE
Transactions on Pattern Analysis and Machine In-telligence, 25(5):564–575.
Walter Daelemans and Antal van den Bosch. 2005.
Memory-Based Language Processing. Cambridge University Press, Cambridge, UK.
Hal Daum´e III and Daniel Marcu. 2006. Domain
Adaptation for Statistical Classifiers. Journal of Ar-tificial Intelligence Research, 26:101–126.
T. Mark Ellison and Simon Kirby. 2006. Measuring Language Divergence by Intra-Lexical Comparison.
Proceedings of the21stInternational Conference on Computational Linguistics and 44th Annual Meet-ing of the ACL, 273–280. Association for Computa-tional Linguistics. Sidney, Australia.
Jes´us Gim´enez and Llu´ıs M´arquez. 2004. SVMTool: A general POS tagger generator based on Support
Vector Machines. Proceedings of the 4th
Interna-tional Conference on Language Resources and Eval-uation (LREC’04), 43–46. European Language Re-sources Association. Lisbon, Portugal.
Daniel Kifer, Shai Ben-David, and Johannes Gehrke.
2004. Detecting change in data streams.
Proceed-ings of the 30th Very Large Data Bases Conference (VLDB’04), 180–191. VLDB Endowment. Toronto, Canada.
Solomon Kullback and Richard. A. Leibler. 1951. On
Information and Sufficiency. The Annals of
Mathe-matical Statistics, 22(1):79–86.
Lillian Lee. 2001. On the Effectiveness
of the Skew Divergence for Statistical
Lan-guage Analysis. 8th International Workshop
on Artificial Intelligence and Statistics (AISTATS 2001), 65–72. Florida, USA. Online reposi-tory http://www.gatsby.ucl.ac.uk/aistats/aistats2001 (Last accessed: April 2, 2010).
Geoffrey Leech, Roger Garside, and Michael Bryant. 1994. CLAWS4: The tagging of the British Na-tional Corpus. Proceedings of the 15th International Conference on Computational Linguistics (COLING 94), 622–628. Kyoto, Japan.
Michael Pacey, Steven Fligelstone, and Paul Rayson.
1997. How to generalize the task of annotation.
Corpus Annotation: Linguistic Information from Computer Text Corpora, 122–136. London: Long-man.
Alfr´ed R´enyi. 1961. On measures of information
and entropy. Proceedings of the4thBerkeley