http://www.scirp.org/journal/ars ISSN Online: 2169-2688 ISSN Print: 2169-267X
DOI: 10.4236/ars.2017.63013 Sep. 6, 2017 175 Advances in Remote Sensing
Quantification of Annual Urban Growth
of Dar es Salaam Tanzania from Landsat
Time Series Data
Kamara Emanuel Gombe, Ichio Asanuma, Jong-Geol Park
Graduate School of Informatics, Tokyo University of Information Sciences, Chiba, Japan
Abstract
The information on urban land cover distribution and its dynamics is useful for understanding urbanization and its impacts on the hydrological cycle, wa-ter management, surface energy balances, urban heat island, and biodiversity. This study utilizes machine learning, texture variables and spectral bands to quantify the urban growth annually. We used multi-temporal Landsat satellite image sets from 2007 to 2016 and Random Forest classification to map urban land-use in Dar es Salaam. We also applied Annual classification approach to detect the spatiotemporal patterns of urban areas. This approach improved classification accuracy and aided in understanding the urban land-use system dynamics operating in our study area. The results pointed out that, the total built-up areas have grown from 318 km2, 388.6 km2 and 634.7 km2 in 2007, 2012 and 2016 respectively. The built up areas growth rate is almost 8%, which makes Dar es Salaam be among the fastest growing cities in Africa. The results indicate that, combining spectral bands, texture variables (NDVI BCI, MNDWI) and annual classification map approach was sufficient to map the urban areas. The approach applied in this research provides a useful guide to the urban growth studies and may also serve as a tool for land management planners.
Keywords
Random Forest, Annual Classification Map, Texture Analysis, Dar es Salaam
1. Introduction
Globally, more people live in urban areas than in rural areas, by 2050 66 per cent of the world’s population is projected to reside in urban [1]. Projections also
in-How to cite this paper: Gombe, K.E., Asanuma, I. and Park, J.-G. (2017) Quanti-fication of Annual Urban Growth of Dar es Salaam Tanzania from Landsat Time Series Data. Advances in Remote Sensing, 6, 175-191.
https://doi.org/10.4236/ars.2017.63013
Received: August 3, 2017 Accepted: September 3, 2017 Published: September 6, 2017
Copyright © 2017 by authors and Scientific Research Publishing Inc. This work is licensed under the Creative Commons Attribution International License (CC BY 4.0).
DOI: 10.4236/ars.2017.63013 176 Advances in Remote Sensing dicate that between 2010 and 2025 some African cities will account for up to 85% of the population [2].
This rapid growth is direct proportional to the environmental consequence by modification of land surfaces where large amount of natural lands have been or will be converted to various developed lands within which impervious surfaces are a major composition [3]. Converting Earth’s land surface to urban uses, ac-celerates the loss of highly productive farmland, affects energy demand, alters the climate, modifies hydrologic and biogeochemical cycles, fragments habitats, and reduces biodiversity [4][5].
From satellite observations of higher frequency, land dynamics now can be better understood from long-term data records at high spatial and temporal res-olution [6].
Urban environments are heterogeneous at relatively small scales and com-posed of a variety of land covers, including impervious surface (built-up areas, roads etc), green vegetation and soil (VIS) [7].
Several indices have been developed to extract land cover information from satellite data. The Normalized Difference Vegetation Index (NDVI) is the most popular example of a land cover index based on band ratios in multispectral re-mote sensing data. NDVI is not only band ratio used in urban areas but there are many more such as Modified Normalized Difference Water Index (MNDWI), Normalized Difference Built-up Index (NDBI); [8], Normalized Difference Im-pervious Surface Index (NDISI) [9], and recently Biophysical Composition In-dex (BCI) [10] which was found to be effective in identifying the characteristics of impervious surfaces and vegetation, as well as distinguishing bare soil from impervious surfaces.
Impervious surfaces can be mapped at annual frequency [11] also we can de-rive the magnitude, timing, and duration change and characterizing urban growth [12].
But estimation of impervious surface from single or multi-temporal images mainly focused on the spectral differences between impervious surfaces and other land covers, have been ineffective to a certain degree due to the problem of mixed pixels in the coarse or medium resolution imagery and the intra-class spectral variability problem in high resolution imagery [13].
In trying to solve some of these problems, some researchers fused optical and SAR images to improve the land cover classification and impervious surface es-timation [14][15][16]. However, it has been observed that, the feature-level fu-sion is subject to influences of feature selections which may introduce uncertain-ties into the characterization of impervious surfaces [17]. Geostatistical features and textural measures also has been applied to distinguish between different land cover classes, and increase the accuracy of classification [18].
DOI: 10.4236/ars.2017.63013 177 Advances in Remote Sensing dispersed training data and useful where process under investigation is complex or represented by high dimensional input [21]. Comprehensive review on dif-ferent machine learning and techniques for classification surfaces can be found in [20][21].
Dar es Salaam, the business city of the United Republic of Tanzania, has expe-rienced the highest population growth, according to the 2016 Tanzania Popula-tion and Housing projecPopula-tion [22] the city had a population of 5.46 million with average annual growth rate of 5.6 percent from 2002 to 2012 [22]. With popula-tion densities reaching 1500 persons/hectare (on average, approximately 150 persons/ hectare), it has a population about seven times the size of the next most populated city, Mwanza, and continues to attract more migrants [23]. These high growth rates have led to pressures on existing urban infrastructure and fa-cilities including land.
The advances in spatial analysis from Geographical Information System (GIS) and Remote Sensing (RS) techniques, studying and monitoring urban growth dynamics has become easier now days. A previous study that utilized linear and non linear complex modeling to quantifies land cover changes revealed that, the city is growing at annual rate of 6% [24]. On the other hand, a study which used Landsat images experienced difficulties in differentiating spectral similarity be-tween bare soil and artificial white surfaces which led to poor classification espe-cially in mixed urban areas [25]. Nevertheless both studies quantify the urban growth up to 2011, which create a need to understand urban land dynamic in last 5 years. In an effort to improve the classification accuracy, urban growth quantification and mapping of the missed period (2012-2016), we propose a new approach involving machine learning, texture analysis, and spectral bands to quantify urban growth.
A supervised algorithm called “Random Forest” used to classify each of the Landsat images from 2007-2016. Mean texture features of Biophysical Composi-tion Index (BCI), Normalized Difference VegetaComposi-tion Index (NDVI), Normalized Difference Water Index (MNDWI), and original Landsat images combined to-gether detect the urban land consumption rate and the changes that have taken place during the last decade. Annual classification map approach applied to detect the spatiotemporal pattern and quantify the urban growth.
2. Data and Methods
2.1. Study Area Description
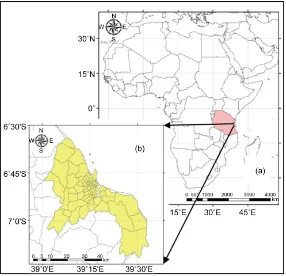
DOI: 10.4236/ars.2017.63013 178 Advances in Remote Sensing Figure 1. Africa and Tanzania (a) study area, Dar es Salaam (b).
during which temperatures rise up to 35˚C. It is relatively cool between May and August, with the monthly average temperature around 25˚C. Annual rainfall is approximately 1100 mm (lowest 800 mm and highest 1300 mm), and in a nor-mal year there are two rainy seasons: the long rains from March/April to May and the short rains from October to November/December. Humidity is around 96% in the morning and 67% in the afternoon. The climate is also influenced by the southwesterly monsoon winds from April to October and northwesterly monsoon winds between November and March. The city is a lowland area with its altitude ranging from the sea level at the coast to an approximately 250 m in the South-west along Pugu hills situated about 25 km from the city centre.
2.2. Data Source
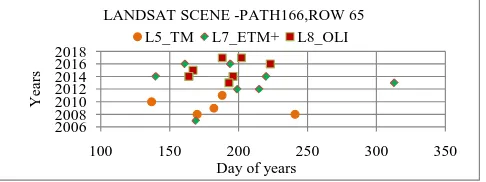
DOI: 10.4236/ars.2017.63013 179 Advances in Remote Sensing Figure 2. Number of Landsat 5, 7, and 8 (TM, ETM+, OLI) data
(path/row = 166/65) downloaded from USGS/Earth Explore.
2.3. Biophysical Composition Index (BCI) and Other Indices
Before calculating BCI, tasseled cap transformation required. For the first time, tasseled cap transformation was proposed by Kauth and his colleagues [27]. Since then, others have presented versions of the tasseled cap transformation for other platforms and sensors such as Landsat TM TOA [28], Landsat ETM+ TOA [29], and Landsat 8 TOA [30]. Three tasseled cap components related to “Brightness”, “Greenness” and “Wetness” respectively were derived and norma-lized as proposed by Deng and Wu [10].
BCI was derived as per Equation (1), sourced from equation (2), (3), and (4).
(
)
(
)
0.5
0.5
H L V
BCI
H L V
+ −
=
+ + (1)
where H, V, L refers normalize first three tasseled cap components. TC1, TC2, TC3 Normalized such that:-
min max min 1 1 1 1 TC TC H TC TC − =
− (2)
min max min 2 2 2 2 TC TC V TC TC − =
− (3)
min max min 2 2 2 2 TC TC L TC TC − =
− (4)
Other Indices i.e. NDVI and MNDWI were derived as per Equation (5) and (6). NIR RED NDVI NIR RED − =
+ (5)
GREEN SWIR
MNDWI
GREEN SWIR
− =
+ (6)
where NIR is TM, ETM band 4, OLI band 5; RED is TM, ETM, band 3, and OLI band 4;
GREEN is TM, ETM, band 2, and OLI band 3;
SWIR is TM, ETM, band 5, and OLI band 6.
2.4. Training Sample
Training samples were selected from each image. BCI images were used to
ex-2006 2008 2010 2012 2014 2016 2018
100 150 200 250 300 350
Y
ear
s
Day of years
DOI: 10.4236/ars.2017.63013 180 Advances in Remote Sensing tract consistent training samples, because they can effectively differentiate vari-ous land cover compositions, particularly between impervivari-ous surfaces and ve-getation [13]. Further, higher resolution historical images from Google Earth were also used to collect training samples through visual interpretation on Landsat images [11]. For each class, we selected 5 to 10 classes in different brightness levels as training samples from each image. This was due to the fact that the number of land cover especially Built up areas depends on the image quality. Our three selected classes were: (1) Built-up areas consisting of com-mercial, residential, roads and other impervious features, industrial, and other associated land uses including: airports, parking lots, dumpsites, construction site, sport and leisure facilities etc. (2) Non-built up area includes cropland (agriculture) land, parks, grassland, forest, woodland shrubs, mangrove, green space, bare soil, and others. (3) Water body consists of artificial ponds, oceans and others. With the support of Google Earth, training data were collected with higher confidence.
To avoid biases results for our classifier, training classes had an equal number of training pixels per class. We used stratified sampling method [31] for sam-pling random points inside all polygons (training sample) of the same class.
2.5. Texture Analysis
Texture based on the Grey Level Co-Occurrence Matrix (GLCM) proposed by Haralick was applied on BCI, NDVI and MNDWI for each image [32]. Window sizes are important components of a texture analysis because of the multi-scale phenomenon. Using small window sizes could result in poorly sampled co-occurring probabilities and an inconsistent estimate of individual texture measures; while focusing on only larger window sizes could result in the eroding of class boundaries [18] [33]. Therefore it is necessary to use a range of small, medium and large window sizes and find optimal size.
After trial and error for different window sizes (i.e. 3 × 3, 5 × 5, 7 × 7, 15 × 15, 31 × 31), 5 × 5 window size was chosen. Mean spatial measures results were stacked together with original images.
2.6. Data Visualization
DOI: 10.4236/ars.2017.63013 181 Advances in Remote Sensing (LULC) classes training dataset.
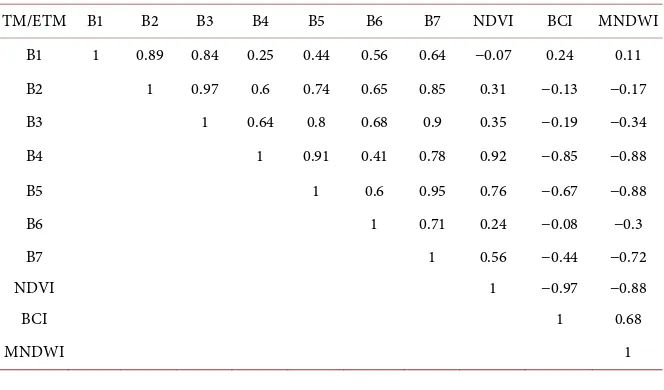
A commonly used value for high correlation to indentify the functional rela-tionship between predictors and response variable is 0.7 [31][35]. Table 1 shows absolute correlation coefficients above 0.7 observed among variables (bands). The result pointed out that, TM, ETM band 1, 2, 3 and 7 are highly correlated while band 4 NDVI, and BCI were not. The same test was conducted to OLI im-age bands also.
To reduce training time of classification model, the most significant predictive features have to be selected by using the importance measures [18]. Due to that, Internal fitted model, using condition interface decision ctree [36] available in R-party::ctree Package was performed on the same training dataset to examine the best combination of variables that may be helpful in predicting our land class. In the ctree model it was observed that, first split our training data set classes were mean texture (NDVI and BCI), followed by a band split based NIR band (TM, ETM band 4, OLI band 5), and the final split was on the blue band while other bands contribution was low. Basically MNDWI, NIR band, and NDVI band used to split water and vegetation from other classes, while BCI, Band 5 split soil class and urban areas from other classes. The decision tree helped us to see a combination of variables which were useful in predicting our land classes. Based on this internal decision by ctree algorithm, mean texture (NDVI, MNDWI and BCI), was chosen as an important attribute and stacked together with band 5, 4, 1 from landsat 5, 7 and band 6, 5, 2 from Landsat 8 OLI of the original image for our classifier.
2.7. Classification Using Random Forest (RF)
[image:7.595.207.539.538.733.2]RF is ensemble learning [37] method that grows multiple trees during the train-ing process. In each node is split ustrain-ing the best among a subset of predictors randomly chosen at that node. This somewhat counterintuitive strategy turns out to perform very well compared to many other classifiers, including discri-
Table 1. Landsat band correlation coefficient.
TM/ETM B1 B2 B3 B4 B5 B6 B7 NDVI BCI MNDWI
B1 1 0.89 0.84 0.25 0.44 0.56 0.64 −0.07 0.24 0.11
B2 1 0.97 0.6 0.74 0.65 0.85 0.31 −0.13 −0.17
B3 1 0.64 0.8 0.68 0.9 0.35 −0.19 −0.34
B4 1 0.91 0.41 0.78 0.92 −0.85 −0.88
B5 1 0.6 0.95 0.76 −0.67 −0.88
B6 1 0.71 0.24 −0.08 −0.3
B7 1 0.56 −0.44 −0.72
NDVI 1 −0.97 −0.88
BCI 1 0.68
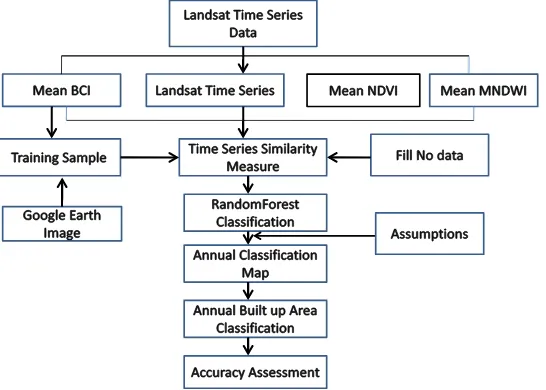
DOI: 10.4236/ars.2017.63013 182 Advances in Remote Sensing minant analysis, support vector machines and neural networks, and is robust against over fitting [34]. In addition, it is very user-friendly in the sense that it has only two parameters (the number of variables in the random subset at each node and the number of trees in the forest), and is usually not very sensitive to their values. Several studies have proved that RF performing well compared to other machine learning algorithm [11][13][18][21]. RF was applied as our ba-sic classifier considering its relatively robust performance, the capability of in-cluding a bigger number of variables, and quantitative measurement of variable contributions as proposed with above scholars. One advantage of RF is that, it generates an internal unbiased estimate of the generalization error as the forest building progresses using out-of-bag (OOB) error estimate. Figure 3 shows the methodology applied in this study.
2.8. Software
This study utilized open source, both QGIS 2.14.2 and R 3.3.1. RF classification model, was implemented using random Forest package provides an R interface to the Fortran programs by Breiman and Cutler (available at
http://www.stat.berkeley.edu/users/breiman).
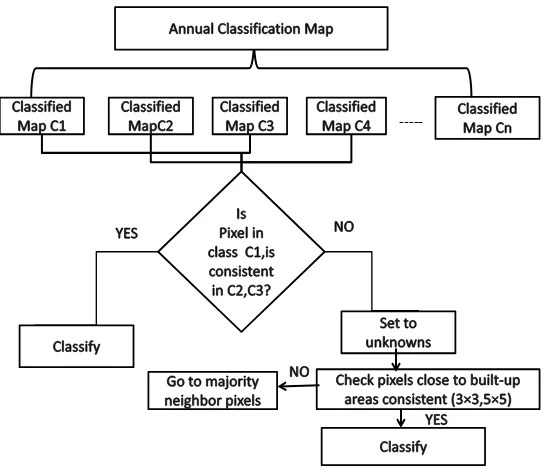
2.9. Annual Classification Map
Following assumption was taken into account in classifying annual map (see Figure 4).
1. The impervious surface Irreversible. Therefore, the impervious samples from the earlier years could be used in the later years
2. Urban land cover within a 30 m by 30 m pixel can take a varying length of time (e.g. 1 - 3 years) to change. So no big change can be expected within a year.
[image:8.595.239.512.508.703.2]We selected classified map of 2007 as the starting image for its high classifica-tion accuracy due to the fact that, weakness of this approach lied in its depen-
DOI: 10.4236/ars.2017.63013 183 Advances in Remote Sensing Figure 4. Annual classification map flow.
dence on the first image [5]. We used images with cloud cover less than 20%, and annual classification maps was initialized as {C1, C2, C3}, C1, C2, C3 are corresponding to classification image in year 1, 2, and 3. If a pixel was classified as non built-up in C1 and C2 respectively and in C3 classified to another class e.g. built-up, this pixel was set to unknowns. If the pixel was classified to the built-up area in C1, C2 non built-up area or water and in C3 that pixel becomes built-up area, that pixel was set to the built-up area. If the pixel was also classi-fied as another class (e.g. non built-up area) in C2 and C3 while in C1 it was a built-up area, that pixel will be corrected as non built-up area, instead of built-up area and vise verse. Based on the irreversibility assumption above, persistent of built-up area samples should remain in all images while other classes may sub-ject to changes.
2.10. Accuracy Assessment
The land class map was created from the rule-based on supervised classifica-tions. An accuracy assessment was performed for all images from 2007. Google earth historical data helped in the collection of ground-truth. For each sample on land class, 100 stratified random samples were generated and resulted to two subsets. One was for training classifier, another one for accuracy assessment. Error matrix (also called confusion matrix) was used to evaluate the accuracy. The sensitivity, user’s accuracy and overall accuracy were derived as per equa-tion (7), (8) and (9).
Sensitivity CN
CN OR
=
+ (7)
---DOI: 10.4236/ars.2017.63013 184 Advances in Remote Sensing OE Number of wrong classified pixels within that class (omission errors).
User Accuracy CN
CN CE
=
+ (8)
whereby CE Number of wrong classified pixels within the class (commission er-rors)
1
1 Ovarall Acurracy
m
ii i
Q N =
=
∑
(9)whereby Qii is number pixels in class i which were classified correctly as class i,
N: Total number of Validation data m the number of classes.
3. Results and Discussion
3.1. Results
3.1.1. Estimation of Urban Growth
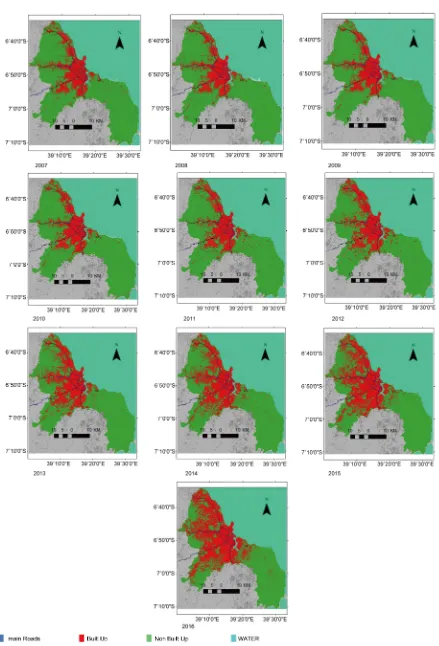
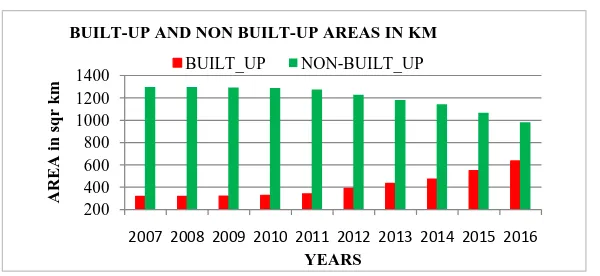
Figure 5 Shows the three land classification results distributions from 2007 to 2016, indicating that the urban areas have increased by almost 100% from 2007 up 2016. The urban area has grown from 318 km2, 388.6 km2 and 634.7 km2 in 2007, 2012 and 2016 respectively (see Figure 6). The highest amount of growth was observed between 2012 and 2016, when the urban area almost doubled in size. With 8% growth rate of built up areas, this means Dar es Salaam is among the fastest growing cities in Africa.
The vegetation class has experienced a sharp decrease in the many areas, while protected areas remain unaffected. In 2007, the main land cover types were ve-getation and arable land, accounting for more than 80% of the total area. After 10 years, this land cover has changed significantly with a rapid urbanization at the cost of losing this arable land and now it remained less than 60%. The long term impact of increasing built-up areas at expenses of vegetation and other land class will be led to modification climate condition in the city and cause Urban Heat Island.
The expansion of built-up areas was highly concentrated along major 4 high-ways, radiating outward the city (i.e. Morogoro, Bagamoyo-, Kilwa, Nelson Mandela and Nyerere road) while south east part (Kigamboni district) largely remain unaffected .
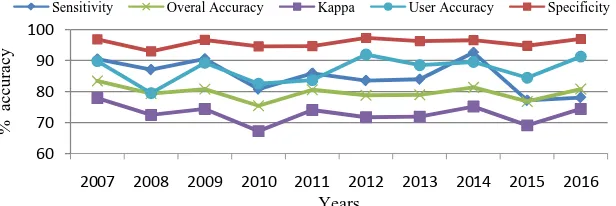
3.1.2. Accuracy of Changed Year Layer
Accuracy for each classified map was different; some were not well classified due to clouds pixels on the image. The base year map (2007 image) was well classi-fied with Kappa coefficient was 0.82 which means that 82.9% of the classification was good. This is considered good because of a Kappa statistics above 0.8, indi-cating a strong agreement or accuracy between the classification map and the ground reference information [38].
DOI: 10.4236/ars.2017.63013 186 Advances in Remote Sensing Figure 6. 10 years built-up area growth in square km.
sensitivity of the annual classes varied from 77.16% to 92.57%, the user’s accu-racy varied from 79.50% to 91.95%, and overall accuaccu-racy varied from 75.4% to 84% (see Figure 7). The years that had the lowest accuracy (e.g. 2010 and 2015) were due to remaining cloud cover on images.
3.2. Discussion
3.2.1. Annual Based Classification Map
In this study, texture and spectral bands of Landsat time series data used to quantify the spatiotemporal patterns of built-up areas in Dar es Salaam from 2007 to 2016. Mean texture BCI, NDVI, MDWI and three spectral bands used to extract built up areas from non built areas.
The use of high resolution images from Google earth historical data can over-come the cost of collecting ground truth, especially when dealing with annual land cover changes in a period where these historical images are available.
However, there were some issues deserving to be discussed. One of the issues in this approach was missing data problem which influenced the accuracy of classification [11]. All images that had a little bit clouds cover in some part reg-istered low accuracy. The annual map 2008, 2010 and 2015 regreg-istered low accu-racy compared to other due to that reason. Several methods have been suggest-ing to tackle the problem [39], but they need continuous data to minimize error. This is a challenge for some areas, due to fact that acquisition of continuous (16days) Landsat image scenes with cloud cover less than 30% is very difficult. The assumption set to classify our annual map worked very well especially in unmixed urban areas, but higher mixed urban (low density) areas, the separation of built-up and non built-up area produced some errors which contributed highly to unknown’s pixels of land classification
Also, it was found that there is confusion between ocean sand and built-up areas, due to similar spectral signatures. The most probable explanation for this is that sand areas appear spectrally and texturally similar to low density residen-tial areas. However, our annual classification map approach showed more promising in discriminating these paired classes. This indicated that the com-bined spectral and texture variables (NDVI BCI, MNDWI) and annual classifi-cation map approach were sufficient to map the urban area. Water bodies were
200 400 600 800 1000 1200 1400
2007 2008 2009 2010 2011 2012 2013 2014 2015 2016
ARE
A i
n
s
q
r
k
m
YEARS
BUILT-UP AND NON BUILT-UP AREAS IN KM
DOI: 10.4236/ars.2017.63013 187 Advances in Remote Sensing Figure 7. Overall accuracy, sensitivity, kappa, user accuracy.
identified more accurately than the rest of the classes.
3.2.2. Study Limitation
The accurate classification in the quantification of urban growth is very impor-tant for city planners and other authorities. We have used Landsat image with a coarse spatial resolution of 30 m which is likely to miss some detailed informa-tion especially in highly mixed urban areas. Although we used texture analysis and annual classification map approach to improve the classification accuracy, for better quantification of urban growth, the availability of very high spatial resolution images, such as Sentinel-2, Quick Bird, Rapideye, and Worldview image data, will help in detection small-scale changes in those areas and quantify accurately the total urban growth.
4. Conclusions
This study utilizes RF algorithm, texture variables, and spectral bands to quanti-fy the Dar es Salaam 10 years’ urban growth. We applied the annual classifica-tion map approach to detect the spatiotemporal patterns of urban area from 2007 to 2016 .The result pointed out that, the total built-up areas have grown from 318 km2, 388.6 km2 and 634.7 km2 in 2007, 2012 and 2016 respectively. The built up areas growth rate is almost 8%, which makes Dar es Salaam be among the fastest growing cities in Africa. The expansion of built-up areas was highly concentrated along major 4 highways, radiating outward the city, which agrees with other studies that cultural drivers such as; economic growth, population growth and transportation infrastructures have a higher impact on urban LULC change.
However, challenges presented in the discrimination of some classes between ocean sand and built-up areas especially in higher mixed urban (low density areas) require further improvements in future. With the additional temporal coverage by Sentinel-2 satellites (much higher resolution 10 m) in near future, further improvements in the classification and mapping of more detailed urban land use/cover on a large scale are expected.
Results from this study will enhance our understanding of the LULC changes in urban areas and its associated impacts. By quantifying urban growth and shows its direction, policy makers can analyze the effects of establishing new
60 70 80 90 100
2007 2008 2009 2010 2011 2012 2013 2014 2015 2016
%
accu
racy
Years
DOI: 10.4236/ars.2017.63013 188 Advances in Remote Sensing housing and road infrastructure in undeveloped areas rather than in existing set-tlements. This study provides a useful guide to the growth of Dar es Salaam, as well as identifies and illustrates areas in which expansion is taking place. This study may also serve as a tool for city planners. While only tested in an urban area (Dar es Salaam), this approach can be applied in other studies of LULC areas as well.
Acknowledgements
This work supported by the African Business Education Initiative Scholarship (ABE), under Japan International Cooperation Agency (JICA). All satellite data used in this study were downloaded from USGS/Earth explorer. Moreover, the authors acknowledge the contribution anonymous reviewers for their useful comments
Author Contributions
Kamara Emanuel Gombe designed the research, performed analyses, and wrote the manuscript. Ichio Asanuma supervised the research and revised the manu-script, and Jong-Geol Park wrote a computer program. All authors contributed and approved final manuscript before submission.
Conflicts of Interest
The authors declare no conflict of interest.
References
[1] United Nations, Department of Economic and Social Affairs, Population Division (2015) World Urbanization Prospects: The 2014 Revision (ST/ESA/SER.A/366). [2] African Development Bank Group (2012) Urbanization in Africa, AfDB:
Cham-pioning Inclusive Growth across Africa. A Blog by the Former Chief Economist and Vice-President.
https://www.afdb.org/en/blogs/afdb-championing-inclusive-growth-across-africa/p
ost/urbanization-in-africa-10143/
[3] Deng, C. and Wu, C. (2013) Examining the Impacts of Urban Biophysical Compo-sitions on Surface Urban Heat Island: A Spectral Unmixing and Thermal Mixing Approach. Remote Sensing of Environment, 131, 262-274.
https://doi.org/10.1016/j.rse.2012.12.020
[4] Seto, K.C. (2011) A Next-Generation Approach to the Characterization of a Non-Model Plant Transcriptome. Current Science, 101, 1435-1439.
[5] Zhang, L. and Weng, Q. (2016) Annual Dynamics of Impervious Surface in the Pearl River Delta, China, from 1988 to 2013, Using Time Series Landsat Imagery. ISPRS Journal of Photogrammetry and Remote Sensing, 113, 86-96.
https://doi.org/10.1016/j.isprsjprs.2016.01.003
DOI: 10.4236/ars.2017.63013 189 Advances in Remote Sensing
https://doi.org/10.1016/j.rse.2012.10.025
[7] RIDD, M.K. (1995) Exploring a V-I-S Model for Urban Ecosystem Analysis through Remote Sensing: Comparative Anatomy for Cities. International Journal of Remote Sensing, 16, 2165-2185. https://doi.org/10.1080/01431169508954549
[8] Xu, H. (2007) Extraction of Urban Built-Up Land Features from Landsat Imagery Using a Thematicoriented Index Combination Technique. Photogrammetric Engi-neering & Remote Sensing, 73, 1381-1391.
[9] Xu, H. (2010) Analysis of Impervious Surface and its Impact on Urban Heat Envi-ronment Using the Normalized Difference Impervious Surface Index (NDISI). Photogrammetric Engineering & Remote Sensing, 76, 557-565.
https://doi.org/10.14358/PERS.76.5.557
[10] Deng, C. and Wu, C. (2012) BCI: A Biophysical Composition Index for Remote Sensing of Urban Environments. Remote Sensing of Environment, 127, 247-259.
https://doi.org/10.1016/j.rse.2012.09.009
[11] Li, X., Gong, P. and Liang, L. (2015) A 30-Year (1984-2013) Record of Annual Ur-ban Dynamics of Beijing City Derived from Landsat Data. Remote Sensing of Envi-ronment,166, 78-90. https://doi.org/10.1016/j.rse.2015.06.007
[12] Song, X.P., Sexton, J.O., Huang, C., Channan, S. and Townshend, J.R. (2016) Cha-racterizing the Magnitude, Timing and Duration of Urban Growth from Time Se-ries of Landsat-Based Estimates of Impervious Cover. Remote Sensing of Environ-ment, 175, 1-13. https://doi.org/10.1016/j.rse.2015.12.027
[13] Shao, Z., Zhang, Y., Zhang, L., Song, Y. and Peng, M. (2016) Combining Spectral and Texture Features Using Random Forest Algorithm: Extracting Impervious Sur-face Area in Wuhan.International Archives of the Photogrammetry, Remote Sens-ing and Spatial Information Sciences,41, 351-358.
https://doi.org/10.5194/isprsarchives-XLI-B7-351-2016
[14] Zhang, H., Zhang, Y. and Lin, H. (2012) A Comparison Study of Impervious Sur-faces Estimation Using Optical and SAR Remote Sensing Images. International Journal of Applied Earth Observation and Geoinformation, 18, 148-156.
https://doi.org/10.1016/j.jag.2011.12.015
[15] Yang, L.M., Jiang, L.M., Lin, H. and Liao, M.S. (2009) Quantifying Sub-Pixel Urban Impervious Surface through Fusion of Optical and InSAR Imagery. GIScience & Remote Sensing, 46, 161-171. https://doi.org/10.2747/1548-1603.46.2.161
[16] Jiang, L., Liao, M., Lin, H. and Yang, L. (2009) Synergistic Use of Optical and InSAR Data for Urban Impervious Surface Mapping: A Case Study in Hong Kong. Interna-tional Journal of Remote Sensing, 30, 2781-2796.
https://doi.org/10.1080/01431160802555838
[17] Shao, Z., Fu, H., Fu, P. and Yin, L. (2016) Mapping Urban Impervious Surface by Fusing Optical and SAR Data at the Decision Level. Remote Sensing, 8, 945.
https://doi.org/10.3390/rs8110945
[18] Rodriguez-Galiano, V.F., Chica-Olmo, M., Abarca-Hernandez, F., Atkinson, P.M. and Jeganathan, C. (2012) Random Forest Classification of Mediterranean Land Cover Using Multi-Seasonal Imagery and Multi-Seasonal Texture. Remote Sensing of Environment, 121, 93-107. https://doi.org/10.1016/j.rse.2011.12.003
[19] Grinand, C., Rakotomalala, F., Gond, V., Vaudry, R., Bernoux, M. and Vieilledent, G. (2013) Estimating Deforestation in Tropical Humid and Dry Forests in Mada-gascar from 2000 to 2010 Using Multi-Date Landsat Satellite Images and the Ran-dom Forests Classifier. Remote Sensing of Environment, 139, 68-80.
DOI: 10.4236/ars.2017.63013 190 Advances in Remote Sensing [20] Shafizadeh-Moghadam, H., Asghari, A., Tayyebi, A. and Taleai, M. (2017) Coupling Machine Learning, Tree-Based and Statistical Models with Cellular Automata to Simulate Urban Growth. Computers, Environment and Urban Systems, 64, 297-308.
https://doi.org/10.1016/j.compenvurbsys.2017.04.002
[21] Cracknell, M.J. (2014) Machine Learning for Geological Mapping: Algorithms and applications. Ph.D. Dissertation, University of Tasmania, Tasmania.
[22] Tanzania Nation Bureau of Statistics (2017) Population Projection for The Year 2016 Based on 2012 Population and Housing Census, 2017.
http://www.nbs.go.tz/nbstz/index.php/english/statistics-by-subject/population-and-housing-census/844-tanzania-total-population-by-district-regions-2016
[23] PAN-AFRICA (2011) Urban Poverty & Climate Change in Dar es Salaam, Tanza-nia: A Case Study. PAN-AFRICA, 129.
[24] Mkalawa, C. and Mkalawa, C.C. (2016) Analyzing Dar es Salaam Urban Change and its Spatial Pattern Analyzing Dar es Salaam Urban Change and Its Spatial Pattern. [25] Congedo, L. and Munafò, M. (2014) Urban Sprawl as a Factor of Vulnerability to
Climate Change: Monitoring Land Cover Change in Dar es Salaam. In: Macchi, S. and Tiepolo, M., Eds., Climate Change Vulnerability in Southern African Cities, Springer International Publishing, Berlin, 73-88.
https://doi.org/10.1007/978-3-319-00672-7_5
[26] NBS. RCO (2014) Dar es Salaam Region Socio-Economic Profile, 1-196.
[27] Kauth, R.J. and Thomas, G.S. (1976) The Tasselled Cap—A Graphic Description of the Spectral-Temporal Development of Agricultural Crops as Seen by Landsat. LARS Symposia Paper 159. http://docs.lib.purdue.edu/lars_symp/159/
[28] Crist, E.P. and Cicone, R.C. (1984) A Physically-Based Transformation of Thematic Mapper Data, The TM Tasseled Cap. IEEE Transactions on Geoscience and Remote Sensing, GE-22, 256-263. https://doi.org/10.1109/TGRS.1984.350619
[29] Huang, C., Wylie, B., Homer, C., Yang, L. and Zylstra, G. (2002) Derivation of a Tasseled Cap Transformation Based on Landsat 7 At-Satellite Reflectance. Interna-tional Journal of Remote Sensing, 23, 1741-1748.
https://doi.org/10.1080/01431160110106113
[30] Baig, M.H.A., Zhang, L., Shuai, T. and Tong, Q. (2014) Derivation of a Tasselled Cap Transformation Based on Landsat 8 At-Satellite Reflectance. Remote Sensing Letters, 5, 423-431. https://doi.org/10.1080/2150704X.2014.915434
[31] Wegmann, M., Leutner, B. and Dech, S. (2016) Remote Sensing and GIS for Ecolo-gists Using Open Source Software. PELAGIC, UK.
[32] Haralick, R.M. and Shanmugam, K. (1973) Textural Features for Image Classifica-tion. IEEE Transactions on Systems Man and Cybernetics,SMC-3, 610-621.
https://doi.org/10.1109/TSMC.1973.4309314
[33] Dye, M., Mutanga, O. and Ismail, R. (2012) Combining Spectral and Textural Re-mote Sensing Variables Using Random Forests: Predicting the Age of Pinus Patula Forests in KwaZulu-Natal, South Africa. Journal of Spatial Science, 57, 193-211.
https://doi.org/10.1080/14498596.2012.733620
[34] Breiman, L. (2001) Random Forest. Machine Learning, 45, 5-32.
https://doi.org/10.1023/A:1010933404324
[35] Dormann, C.F., et al. (2013) Collinearity: A Review of Methods to Deal with It and a Simulation Study Evaluating Their Performance. Ecography (Cop.), 36, 027-046.
https://doi.org/10.1111/j.1600-0587.2012.07348.x
DOI: 10.4236/ars.2017.63013 191 Advances in Remote Sensing Conditional Inference Framework. Journal of Computational and Graphical Statis-tics, 15, 651-674. https://doi.org/10.1111/j.1600-0587.2012.07348.x
[37] Breiman, L. and Cutler, A. (2012) Breiman and Cutler’s Random Forests for Classi-fication and Regression. Documentation for Package ‘randomForest’ Version 4.6-2. [38] Manandhar, R., Odeh, I.O.A. and Ancev, T. (2009) Improving the Accuracy of Land
Use and Land Cover Classification of Landsat Data Using Post-Classification En-hancement. Remote Sensing, 1, 330-344.
https://doi.org/10.1111/j.1600-0587.2012.07348.x
[39] Skakun, S.V. and Basarab, R.M. (2014) Reconstruction of Missing Data in Time-Series of Optical Satellite Images Using Self-Organizing Kohonen Maps. Journal of Auto-mation and InforAuto-mation Sciences, 46, 19-26.
https://doi.org/10.1615/JAutomatInfScien.v46.i12.30
Submit or recommend next manuscript to SCIRP and we will provide best service for you:
Accepting pre-submission inquiries through Email, Facebook, LinkedIn, Twitter, etc. A wide selection of journals (inclusive of 9 subjects, more than 200 journals)
Providing 24-hour high-quality service User-friendly online submission system Fair and swift peer-review system
Efficient typesetting and proofreading procedure
Display of the result of downloads and visits, as well as the number of cited articles Maximum dissemination of your research work