interface of water
T. Somasundaram, M. in het Panhuis, R. M. Lynden-Bell, and C. H. Patterson
Citation: The Journal of Chemical Physics 111, 2190 (1999); doi: 10.1063/1.479491
View online: http://dx.doi.org/10.1063/1.479491
View Table of Contents: http://scitation.aip.org/content/aip/journal/jcp/111/5?ver=pdfcov
Published by the AIP Publishing
Articles you may be interested in
Effect of Cu 3 Sn coatings on electromigration lifetime improvement of Cu dual-damascene interconnects Appl. Phys. Lett. 87, 211103 (2005); 10.1063/1.2132536
Diffusion and electromigration of copper in SiO 2 -passivated single-crystal aluminum interconnects Appl. Phys. Lett. 74, 37 (1999); 10.1063/1.123125
A spectroscopic study of the fullerene/metal interface in C 60 -Al multilayers AIP Conf. Proc. 442, 265 (1998); 10.1063/1.56526
Laser microscopy of CoSi 2 formation reaction at the CoSi/Si interface AIP Conf. Proc. 418, 457 (1998); 10.1063/1.54667
Growth of TiSi 2 from codeposited TiSi x layers and interfacial layers Appl. Phys. Lett. 70, 2386 (1997); 10.1063/1.118880
A simulation study of the kinetics of passage of CO
2and N
2through the liquid/vapor interface of water
T. Somasundaram
Atomistic Simulation Group and Irish Centre for Colloid Science, School of Mathematics and Physics, The Queen’s University, Belfast BT7 1NN, United Kingdom
M. in het Panhuisa)
Department of Physics, Trinity College, Dublin 2, Republic of Ireland
R. M. Lynden-Bell
Atomistic Simulation Group and Irish Centre for Colloid Science, School of Mathematics and Physics, The Queen’s University, Belfast BT7 1NN, United Kingdom
C. H. Patterson
Department of Physics, Trinity College, Dublin 2, Republic of Ireland
共Received 9 March 1999; accepted 6 May 1999兲
The rate of passage of molecules of carbon dioxide and nitrogen through the vapor–liquid interface of water at 300 K is studied by simulation. Previous work has established the form of the free energy profile which has a minimum when the solute molecule is on the surface and a barrier between this state and solution in the bulk liquid. In one set of simulations, trajectories were initiated in the gas phase. From these, the average lifetime of molecules in the surface is determined to be considerably longer than the inverse of the energy relaxation rate, so that the sticking coefficient is one and exiting molecules have no memory of their original velocities. However, most molecules do return to the gas phase rather than entering the bulk solution. The rate of passage of molecules over the free energy barrier is studied using the reactive flux method with trajectories initiated near the top of the barrier. The results for nitrogen, in particular, give a good plateau in the time-dependent transmission coefficient and hence a reliable rate constant. The results from these two sets of simulations are combined to give an effective interface width which is used to determine the permeability of thin water films. These results are compared to experimental permeabilities of thin Newton black soap films. The rate-determining step for solution in bulk water is not passage through the few A˚ ngstroms width of the interface we study, but rather the transport from the vicinity of the interface into the bulk over the larger distance scale ofm. © 1999 American Institute of Physics. 关S0021-9606共99兲71029-9兴
I. INTRODUCTION
The process of solution of molecules such as CO2 and
N2in water is important in many contexts, ranging from the
production of bubbles when a champagne bottle is opened to the extent to which the oceans can act as a sink for CO2.
Recent experiments1–3have addressed the problem of mea-suring the rate of solution of small molecules in liquids both macroscopically and with molecular beams.
In this paper we describe the results of simulation stud-ies of this process. Atomistic simulation is appropriate for the investigation of the passage of molecules across the in-terface, as the width of the interface region is the order of magnitude of a few intermolecular spacings, which is acces-sible to simulation.
The thermodynamics of solution is determined by the free energy, energy, and entropy profiles of the system as a solute molecule crosses the interface. While the kinetics is not completely determined by the thermodynamics, these
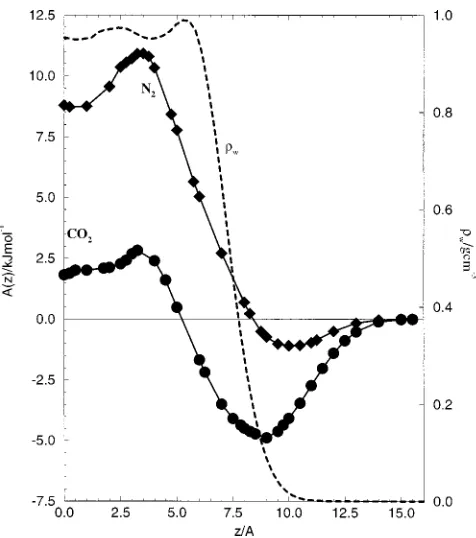
profiles have a profound effect on them. In Fig. 1 we repro-duce graphs showing the density of water across its liquid– vapor interface, and free energy profiles at 300 K for CO2
and N2 traversing the interface which were determined in
previous simulations of solute molecules and thin films of water.4The dashed line in the figure shows the water density for one-half of the film共the position z⫽0 corresponds to the center of the simulated film兲. The water density is slightly enhanced just below the interface and then drops to a negli-gible value as the interface is traversed from liquid to vapor. The width of the interface is about 4–5 Å. The free energy curves共in which the common zero corresponds to the solute in the gas phase兲show that the influence of the interface on the solvation process extends over a wider region共10–14 Å兲. The equilibrium solute concentration ceq(z) also varies over this wider region, as at any point z it is determined by
A共z兲⫽⫺RT ln关ceq共z兲/cgaseg兴, 共1.1兲
where the concentrations are measured in moles per unit vol-ume and cgaseq is the concentration of the solute in the gas phase. It follows that the value of the Ostwald solubility L is given by
a兲Present address: Department of Chemistry, UMIST, Manchester
M60 1QD, United Kingdom.
JOURNAL OF CHEMICAL PHYSICS VOLUME 111, NUMBER 5 1 AUGUST 1999
2190
0021-9606/99/111(5)/2190/10/$15.00 © 1999 American Institute of Physics
L⫽cbulkeq /cgaseq⫽exp关⫺Abulk/RT兴, 共1.2兲
where Abulkis the limiting value of the free energy A(z) on
the liquid side of the interface and cbulkeq is the equilibrium concentration of the solute in the liquid. For both solutes considered here, the free energy has a minimum on the vapor side of the water surface and a small barrier between the bulk liquid and the surface. These minima correspond to regions in which the equilibrium solute concentration is enhanced. We deduce that both gases, but particularly CO2, form a
surface-adsorbed layer in which solute molecules lie on the water surface, and have a significant surface excess concen-tration.
These free energy profiles suggest that the process of solution of these gases should be considered as a two-step process in which the molecules first move from the gas phase to the surface to form an adsorbed layer and then move from the adsorbed layer into the bulk. The passage of a gas mol-ecule through a film consists of five steps, gas–surface, surface–bulk, diffusion through the bulk, bulk–surface, and finally surface–gas on the far side of the film. The two steps at the interface are very different in character from each other. In the first step 共gas–surface兲, the solvent density is low and the solute motion is gaslike with a mean free path much greater than the distances considered here. In the sec-ond step 共surface–bulk兲, the density of water rapidly in-creases to that of the bulk, and molecular motion becomes increasingly interrupted by solvent–solute interactions.
In this paper we present the results from a number of complementary simulation methods to determine the kinetics involved in the different steps outlined above. The gas– surface process was studied by following trajectories of the
solute molecule moving from the gas phase toward the sur-face of a film of water at 300 K. This work and its results are described in Sec. III. The main conclusions are that incoming molecules are trapped on the surface in the free energy well where they are rapidly thermalized, and that the sticking co-efficient is equal to unity.
The process of passing over the barrier from the surface into the bulk has been studied in two ways. First, by follow-ing the fate of the molecules trapped in the adsorption site 共see Sec. III兲, and second, by following trajectories of mol-ecules which were initially placed at the barrier and applying the reactive flux method. This is described in Sec. IV.
Passage through the region of a film which has bulk liquid properties is described by the diffusion equation as the molecules lose memory of their velocities before they move a significant distance. The diffusion of CO2and N2 in bulk
water was investigated by us in earlier work5,6 using the same potential models, and good agreement with experimen-tal values was found. We have also investigated the exten-sion of this macroscopic approach to part of the interface region using the free energy A(z) as an external potential. This is described in Sec. V.
Finally, the results from the different simulation methods are brought together so that the permeation of CO2through films共Sec. V兲and the rates of solution of CO2in water共Sec. VI兲can be described and discussed. These methods give con-sistent results for the liquid–surface kinetics, although the uncertainties are large.
II. MODELS AND METHODS
All the simulations were performed using the method of molecular dynamics. The DL–POLY program7 was adapted for the particular simulations. The simulation cell was the same as used in earlier work.4 It contained a slab of liquid water about 15 Å thick with gas above and below. This cell was periodically repeated in space.
The water was modeled by the SPC/E model,8in which the geometry is fixed and there are partial charges on each atom site. In addition, every pair of oxygen atoms interacts with a Lennard-Jones potential. The water–CO2and water–
N2 interactions were modeled using a similar philosophy
with partial charges on each atomic site 共and an additional site at the center of the N2molecule兲, together with
[image:3.612.53.291.47.316.2]Lennard-Jones potentials between each atomic site and each water– oxygen. Table I gives values for the potential parameters. These were the same as in our earlier work4–6 and were found to give good agreement with bulk thermodynamics FIG. 1. Free energy profiles for CO2and N2traversing the interface. The
dashed line shows the density of the water through the interface. Distances are measured from the center of the simulated film.
TABLE I. Potential parameters.
Molecule Site ⑀iO/kJ mol⫺1
iO/Å q/e
CO2 C 0.5137 3.2618 0.6630
O 0.8106 3.0145 ⫺0.3315
N2 N 0.5050 3.282 ⫺0.4731
center 0.0 0.0 0.9462
H2O H ¯ ¯ 0.4238
O 0.6502 3.166 ⫺0.8476
[image:3.612.315.560.64.150.2]and diffusion constants. The long-range Coulomb terms were treated using Ewald summation with the parameters used previously.4A time step of 2 fs was used.
Simulations were initiated with the center of mass of the solute at a particular point and trajectories followed until the solute reached a predetermined point or a specified time in-terval had passed. In the gas–liquid trajectories, which were run at constant energy, the initial position of the center of mass of the solute was at 15 Å from the center of the film, which is about 7.5 Å from the midpoint of the interface共see Fig. 1兲. In order to conserve momentum and increase the efficiency of the calculations, trajectories were initiated with a pair of molecules on opposite sides of the film approaching the surfaces with equal and opposite velocities. Their trajec-tories were followed for 25 ps 共sometimes longer兲 or until both molecules had left the interface region共defined for this purpose as being between 3.5 and 13.25 Å兲. Occasional tra-jectories had to be stopped when one solute molecule moved through the boundaries to reach the image of the other side of the film. Information from these trajectories was included in the analysis to prevent bias. In all, 285 trajectories for CO2
and 173 for N2 were run. Typical trajectories lasted for
10–40 ps.
The liquid–surface trajectory calculations were per-formed with a Nose´–Hoover thermostat with time constant of 0.4 ps. Trajectories were initiated with the center of mass of the solute at a point near the tops of the respective barriers 共4 for CO2and 3 Å for N2兲. Our earlier work4showed
peri-ods of about 300 ps were sometimes necessary to sample a full range of configurations consistent with a particular con-strained center of mass position. In order to obtain a thermal distribution of independent starting configurations, these were taken at intervals during a 7.5 ns run with a fixed solute center of mass at 300 K. About 800 trajectories were run for each solute. Typically each trajectory was followed for 4 ps.
III. FROM GAS TO SURFACE
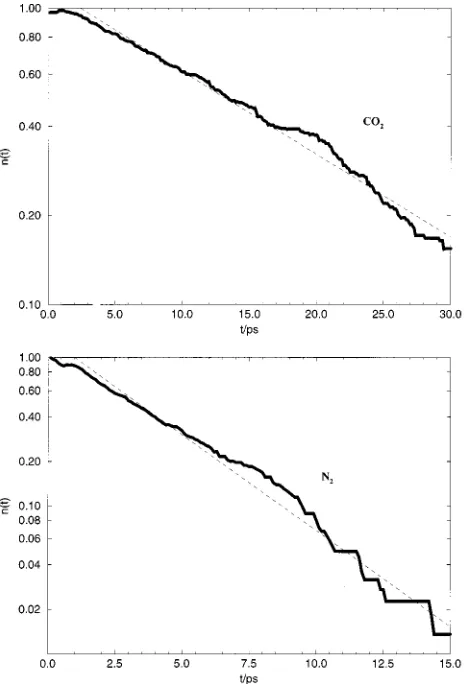
In this section we describe the results of trajectory cal-culations initiated in the gas phase. Figure 2 shows the decay of the number of trajectories in which solute molecules re-main in the surface region as a function of time. The curves for both N2and CO2decay exponentially after the first few
ps. The reason that the first 3–4 ps of these curves do not fall on the exponential decay is because the time origin is when the CO2is above the surface共at z⫽15 Å兲, and before it can
escape it must reach the surface, interact, and move out again beyond the boundary of the surface region. At 300 K the average forward velocity is about 2 Å/ps共200 m/s兲for CO2.
The decay times obtained from the exponential fits are given in Table II for both CO2 and N2. The lifetime of a CO2 molecule adsorbed on the surface is about 15 ps, while that of N2is much shorter, about 3 ps.
A very important parameter in the discussion of kinetics of solution is the value of the sticking coefficient, that is the number of molecules which stay on the surface rather than immediately bouncing off it. Our conclusion is that the stick-ing coefficient is one, although most of the molecules which stick eventually escape back to the gas phase. This conclu-sion is based on the facts that first, at short times the number
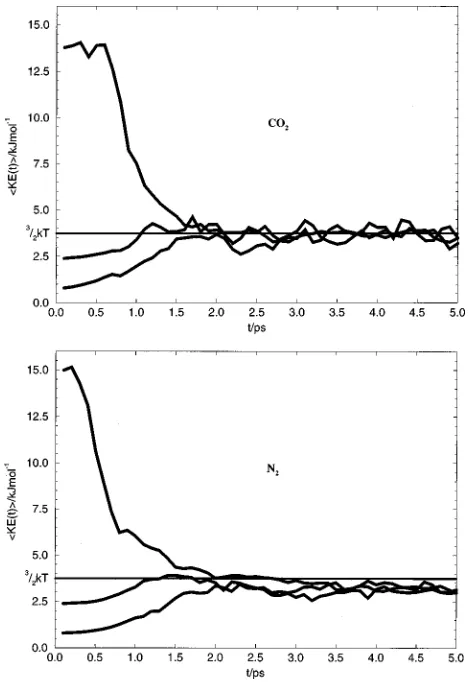
of molecules leaving the surface is not higher than the fitted exponential decay 共see Fig. 2兲, and second, that the rate of thermalization occurs on a faster time scale than the lifetime of the adsorbed molecules. This point is illustrated in Fig. 3, which shows the change in average translational kinetic en-ergy for three series of trajectories in which the initial veloc-ity of the CO2 molecule approaching the film is different
from that which would be expected from a thermal distribu-tion at 300 K. After only 2 ps from the start of the trajecto-ries, the average translational kinetic energy has reached the value for thermal equilibrium 共3.74 kJ mol⫺1 at 300 K兲, while only 2% of the molecules have escaped from the sur-face. The rate constants for thermalization of the incoming molecules can be found by fitting the decay after an initial delay for the molecules to reach the surface to an exponen-tial. The resulting time constant is 0.3 ps, which is much shorter than the residence time on the surface.
The second important parameter needed for the descrip-tion of the kinetics of crossing the interface is the fracdescrip-tion f of molecules leaving the surface which end in the bulk, as opposed to those which return to the gas phase. This number cannot be obtained from thermodynamic arguments and must be measured in kinetic experiments such as these. The value of f could be determined reasonably accurately for CO2, but
[image:4.612.321.553.50.392.2]too few molecules of N2reached the interior to give anything
FIG. 2. Decay of number of solute molecules in the surface layer as a function of time共a兲CO2;共b兲N2.
2192 J. Chem. Phys., Vol. 111, No. 5, 1 August 1999 Somasundaramet al.
but a very uncertain estimate of f for N2. The results from
this section are summarized in Table II.
Figure 4 gives some more detailed information about the dynamics of the solute in the interface region. It shows his-tograms of the number of solute velocity reversals as a func-tion of solute posifunc-tion. Velocity reversals are defined as points at which the z component of the solute velocity changes sign. The dashed line shows the total number of reversals at different positions, while the two full curves show the numbers toward and away from the bulk liquid. This figure illustrates the contrast between motion in a po-tential well and in a free energy well. In the former, all velocity reversals to the right of the minimum would be to-ward the left, while those to the left of the minimum would be toward the right. In a free energy well such as in this system, interactions are more random and velocity reversals in either direction occur on both sides of the minimum, but relative numbers change as one goes through the minimum. Note that the curves cross near the free energy minimum, whose position is shown by the line S.
The overall picture is then that the incoming molecules strike the surface and stick in the adsorbed layer where they quickly lose memory of their original velocity and kinetic energy. After several picoseconds, the thermalized molecules escape either into the bulk with probability f or back into the gas phase with probability (1⫺f ).
IV. PASSAGE OVER THE BARRIER
The use of molecular dynamics to study rates of crossing activated barriers in chemical reactions is well established. In the reactive flux method,9trajectories are initiated at the bar-rier and the probability of finding the system on the product side at later times monitored. This method can be used for the current problem to investigate the rate constants for pas-sage over the barriers which lie between the liquid and the surface. These barriers are comparatively low compared with most chemical reactions and it is not clear a priori that a rate constant exists, particularly for the CO2where the barrier is
0.5 kT. In fact we do find rate constants for both solutes. Using the ideas of transition state theory we can calcu-late the flux JLSfrom liquid to surface per unit area across a
plane parallel to the surface and passing through the barrier. At thermal equilibrium the flux is the product of the number density of molecules at the barrier, their mean forward ve-locity
具
兩vz兩典
/2, and a transmission function . As theequi-librium concentration of molecules at the barrier, cBeqis re-lated to that in the bulk fluid cLeqby
cBeq⫽cLeqexp关⫺共A共zB兲⫺Aliq兲/kT兴, 共4.1兲
the flux across the barrier at equilibrium from liquid to sur-face is
JLS⫽kLS
⬘
cL⫽exp关⫺共A共zB兲⫺Aliq兲/kT兴具
兩vz兩/2典
cL, 共4.2兲where the rate constant kLS
⬘
has units of a velocity. We adopt the convention that rate constants without primes have mensions of inverse time while those with primes have di-mensions of velocity. In this expression all the variables ex-FIG. 3. Change of average translational kinetic energy of incoming solute [image:5.612.318.557.48.224.2]molecules as a function of time.共a兲CO2; 共b兲N2.
TABLE II. Results from gas to surface trajectories.
Solute Lifetime in surface/ps KE relaxation time/ps Fraction f to bulk
CO2 15.5⫾0.3 0.3⫾0.05 0.10⫾0.02
[image:5.612.57.292.49.390.2]N2 3.3⫾0.2 0.4⫾0.05 0.009⫾0.008
FIG. 4. Histograms of velocity reversals of a CO2molecule as a function of
position. The dashed line shows the total number, while the two full lines with symbols具and典show reversals from right to left and from left to right, respectively. The water density and equilibrium solute concentrations are shown above for reference. Note that more reversals from left to right occur when the solute is outside the free energy minimum共S兲and vice versa.
[image:5.612.52.298.712.757.2]cept can be determined from equilibrium statistical mechanics. In the transition state approximationis equal to one. This assumes that no trajectories recross the barrier; in general, is less than one to correct for recrossings. The determination of from trajectory calculations has been de-scribed by Chandler.9In our case the reaction coordinate is the z position of the center of mass of the solute molecule. The flux of molecules crossing a plane perpendicular to the z axis at a point z0 on the reaction path is given by
J⫽c共z0兲
具
v共t⫽0兲H共z共t兲⫺z0兲典
, 共4.3兲where the average is taken over trajectories whose initial positions at t⫽0 are z⫽z0. H(z) is the Heaviside function whose value is 0 for a negative argument and 1 for a positive argument. Comparing this expression for the flux with Eq. 共4.2兲, we obtain
共z0,t兲⫽
具
v共t⫽0兲H关z共t兲⫺z0兴典
具
兩vz兩/2典
. 共4.4兲
If reaches a plateau value after a short time, the process can be described by first-order kinetics, and a rate constant exists. Thus from Eq. 共4.2兲we obtain
kLS
⬘
⫽共z0兲exp关⫺共A共z0兲⫺Abulk兲/kT兴具
兩vz兩/2典
, 共4.5兲where is determined from reactive flux calculations, A(z0)⫺Abulkfrom our earlier free energy measurements, and
具
兩vz兩/2典
⫽(kT/2m)1/2. It should be noted that Eq. 共4.3兲 is
valid at all values of z0, changes in c(z0) being compensated
by changes in (z0). However, as z0 moves away from the
top of the barrier, the concentration increases rapidly and the values of become close to zero. Consequently, accurate values are difficult to obtain unless trajectories are started near the top of the barrier.
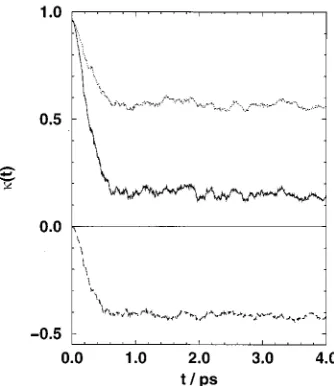
Figure 5 shows(t) for N2starting at z⫽3 Å, near the
top of the barrier. It is clear that a plateau is reached after about 0.6 ps and the plateau value of is 0.15⫾0.02. This
substantial reduction from unity shows that barrier recross-ings are common. As a result, both forward and backward trajectories contribute to the value. These two terms are shown separately in the figure and contribute about equally to the decay of from unity. This is further evidence for multiple barrier crossing.
The results for CO2were more noisy and are shown in
Fig. 6 for trajectories starting from z⫽4 Å. This is a point on the surface side of the barrier. The plateau value at about 2 ps gives⫽0.15⫾0.04.
Using these values ofand the values of the free energy at the corresponding starting points, we obtain values for the rate constants from liquid to surface of
kLS
⬘
⫽0.08⫾0.02 Å ps⫺1N 2,kLS
⬘
⫽0.10⫾0.08 Å ps⫺1CO2.V. RATES OF PERMEATION OF FILMS
We have seen that the passage of a molecule through a film is made up of several steps, namely reaching the surface, passing through the interface, moving through the central part of the film which has bulk properties, passing through the far interface, and leaving the surface. We have already discussed the surface and interface processes. The movement of CO2and N2through the central portion of the film can be described by the diffusion equation, provided that the thick-ness of the film is considerably greater than the amplitude of motion of a molecule in its cage. For a thick film, it is this process that limits the permeation so that the rate is inversely proportional to the film width. We shall show in this section that the effects of the interfaces can be described in terms of an effective interface width共which may be negative兲which should be added to the true film width to determine the ef-fective width. We compute values of this correction for CO2
and N2.
[image:6.612.351.518.48.243.2]Fick’s law states that FIG. 5. Time dependence of the transmission function共continuous line兲for
N2for trajectories initiated at z⫽3 Å. The dotted and dashed lines show the
[image:6.612.90.257.55.248.2]contributions of trajectories which start with forward velocities 共dotted, above兲 and backward velocities 共dashed, below兲. Note that a plateau is reached after 0.5 ps.
FIG. 6. Time dependence of the transmission function共continuous line兲for CO2for trajectories initiated at z⫽4 Å. The dotted and dashed lines show
the contributions of trajectories which start with forward velocities共dotted, above兲and backward velocities共dashed, below兲. Compared to nitrogen the plateau is less well defined.
2194 J. Chem. Phys., Vol. 111, No. 5, 1 August 1999 Somasundaramet al.
J⫽⫺Ddc
dz, 共5.1兲
so that the concentration is a linear function of z under steady-state conditions where J(z,t) is constant, giving
c共z1兲⫺c共z2兲⫽ J
D共z1⫺z2兲. 共5.2兲
The crudest model for permeation through a film is one where the interfaces at ⫾h/2 are sharp and the concentra-tions just inside the interfaces are in equilibrium with the neighboring gas. Assuming that the gas-phase pressure on each side 共and hence the concentrations兲 are kept constant, we have
J⫽DL
h 关cgas共1兲⫺cgas共2兲兴, 共5.3兲
where L is the Ostwald solubility of the gas defined in Eq. 共1.2兲. This can be rewritten共assuming the gases are ideal兲,
J⫽ DL
hkT关pgas共1兲⫺pgas共2兲兴. 共5.4兲
The effects of the processes at the interfaces modify these equations so that the width of the film h is replaced by an effective width heff⫽h⫹2⌬. The interface correction,⌬, is the same for films of all widths, but will only be significant when the interface correction is a similar order of magnitude as the film width. This correction may be positive or negative depending on the properties of the solute and the interface. Once its value has been determined for a particular solute/ solvent combination, we can estimate the permeation of films of any thickness.
Our next task is to combine the information from the simulations described in earlier parts of this paper and pre-vious papers4–6in order to estimate⌬for CO2and N2
[image:7.612.347.536.53.324.2]cross-ing the water gas–liquid interface at 300 K.
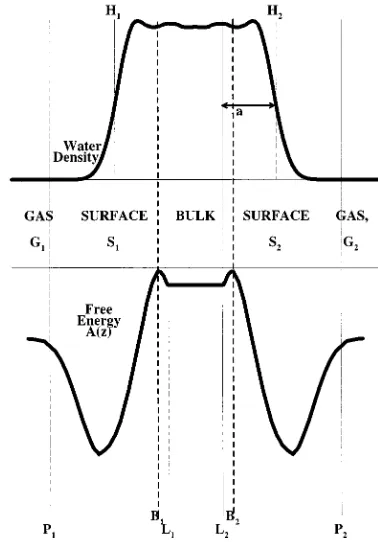
Figure 7 shows the water density in the film共above兲and the free energy A(z) 共below兲 schematically. We define the true film width h as being the distance between the points H1
and H2 in the interface where the density is half the liquid
density in the interior of the film. The positions of the barri-ers, B1 and B2, and the limits of bulk behavior, L1 and L2,
lie within the film. a is the distance between the limit of bulk behavior and the edge of the film. We assume that solute is flowing from left to right in a steady state so that the flux J is constant throughout the film. Thus the values of J across different planes P1, B1, B2, and P2 perpendicular to z can
be equated to obtain expressions for the overall permeation rate. The flux across the plane P1 between the gas phase (G1) and the surface adsorbed layer (S1) is
J⫽
具
兩vz兩/2典
cG1⫺kSGcS1⬘
, 共5.5兲where we have used the observation that the sticking coeffi-cient is equal to one. In this expression cS1
⬘
is the surface concentration in the adsorbed layer S1 and cG1 the volumeconcentration in the gas phase G1.
The flux across barrier B1 is
J⫽kSLcS1
⬘
⫺kLS⬘
cL1, 共5.6兲where cL1 is the concentration just inside the barrier and the
rate constants between liquid and surface (kLS
⬘
) and surface and liquid (kSL) have dimensions of velocity and inversetime, respectively. Combining Eqs. 共5.5兲and共5.6兲, the cor-responding equations for the fluxes across planes B2and P2,
and the solution of the diffusion equation for the flux in the interior of the film, we obtain
J⫽D共cL1⫺cL2兲/关z共L1兲⫺z共L2兲兴. 共5.7兲
The steady-state concentrations in the surfaces and the inte-rior can be eliminated to give
J⫽DL共cG1⫺cG2兲/heff. 共5.8兲
This equation has the expected form 关cf. Eq.共5.3兲兴. By ma-nipulation we obtain two independent expressions for the effective film width of the form
heff⫽z共L1兲⫺z共L2兲⫹2␦, 共5.9兲
namely
␦⫽f
具
兩DL vz兩/2典
‘‘surface equation’’, 共5.10兲
␦⫽ D
kLS
⬘
共1⫺f兲 ‘‘barrier equation’’, 共5.11兲where f is the fraction of trajectories starting from the surface adsorbed phase which enter the bulk and (1⫺f ) is the frac-tion that escape to the gas phase. The other quantities have been defined before. We note that the first of these equations 共the ‘‘surface’’ equation兲 depends primarily on information from the trajectories initiated in the gas phase, while the FIG. 7. Schematic diagram of the film and its associated free energy profile showing different planes and regions of the film.
second共the ‘‘barrier’’ equation兲depends primarily on infor-mation from the trajectories initiated on the barrier.
The other information we require is the offset a共see Fig. 7兲of the points L1 and L2 just inside the barrier from the edge of the interface defined by the point at which the water density is 50% of its value in the center of the film. The points L1 and L2 are not precisely determined, but from the free energy curves共Fig. 1兲we estimate
z共L1兲⫺z共L2兲⫽h⫺共10⫾1兲Å CO2, 共5.12兲
z共L1兲⫺z共L2兲⫽h⫺共12⫾1兲Å N2. 共5.13兲
Thus the offsets are a⫽5⫾0.5 Å for CO2 and a⫽6⫾0.5 Å for N2. These quantities are the least accurately determined contributions to the interface correction, as the precise point at which the properties of the solution are the same as those of the bulk is not well determined.
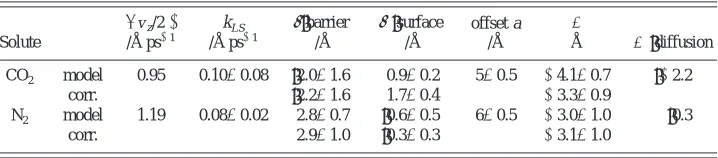
The remaining quantities needed to determine ⌬ from our previous work4–6and experiment are collected in Table III. Table IV shows the results of calculating␦from the two routes关Eqs.共5.10兲and共5.11兲兴, together with our estimates of the total interface correction ⌬⫽␦⫺a for the gases passing through the gas–liquid interface of water. Values have been calculated with all parameters taken from the model with experimental values of D and L共rows labeled ‘‘model’’ and ‘‘corr,’’ respectively兲. Although the values of ␦ for CO2
agree within their estimated errors, the difference between the values of ␦ is significant owing to the low value of the solubility of the model CO2 compared to the experimental
value. It should be noted that this difference in solubility corresponds to a difference of 1.5 kJ mol⫺1, which is not large. The ‘‘surface’’ equation gives a more precise value for CO2, while for N2, where the value of f is too small to be
determined accurately from the gas to surface trajectories, the ‘‘barrier’’ equation is more accurate. The less accurate values are bracketed in the table.
We note that the total interface correction⌬is negative, showing that it is easier to pass through the interface than through an equivalent distance of bulk water. Why is this? Although the existence of a barrier impedes the passage of the gas, this is more than compensated for by the attraction of the free energy minimum at the surface. This balance is illustrated by another expression for ⌬ which is obtained from solving the diffusion equation in the presence of the mean force on the molecule due to the free energy 关⫺dA(z)/dz兴,
⌬diff⫽
冕
zS
bulk1⫺exp关⫺共A共z兲⫺A
bulk兲/kT兴
D共z兲/D dz. 共5.14兲
The integral runs from the surface zS into the bulk liquid.
Regions where the free energy is lower than in the bulk give negative contributions, while the barrier region where A(z)
⬎Abulk gives a positive contribution to the value of⌬. The
main problems with applying this approach in a quantitative manner is that the diffusion constant D(z) is expected to drop rapidly through the interface and it is doubtful whether the conditions for validity of the diffusion equation are met in this region. Nevertheless we include values estimated from this equation in the last column of Table IV.
VI. RATES OF SOLUTION IN LIQUIDS
There have been various types of experimental studies of the rate of solution of CO2in water. In the more traditional
[image:8.612.127.486.66.144.2]methods, the rate of solution into bulk liquid has been stud-ied with various arrangements including flowing and stirred liquids,2,3,10while Davidovits et al.11have developed an in-genious method of studying the absorption of highly soluble gases in small droplets of the order of 0.1 mm in diameter. TABLE III. Data for model and experiment.
Solute
Diffusion const. D/Å2ps⫺1
Solubility L
Film edge H/Å
Barrier B/Å
A(z0)⫺Abulk
/kJ mol⫺1
CO2 model
a,b 0.18⫾0.02 0.45⫾0.04 7.4 3.3⫾0.1 0.8⫾0.2
expt.c,d,e 0.20 0.80 N2 model
a,f
0.20⫾0.04 0.030⫾0.003 7.4 3.4⫾0.1 2.1⫾0.2 expt.c,d,g 0.23 0.016
aReference 4. eReference 26. bReference 5. fReference 6. cReference 23. gReference 25. dReference 24.
TABLE IV. Calculation of⌬ 共see text兲.
Solute
具兩vz/2兩典 /Å ps⫺1
kLS⬘
/Å ps⫺1 ␦共
barrier兲 /Å
␦共surface兲 /Å
offset a /Å
⌬
Å ⌬ 共diffusion兲
CO2 model 0.95 0.10⫾0.08 共2.0⫾1.6兲 0.9⫾0.2 5⫾0.5 ⫺4.1⫾0.7 共⫺2.2兲
corr. 共2.2⫾1.6兲 1.7⫾0.4 ⫺3.3⫾0.9
N2 model 1.19 0.08⫾0.02 2.8⫾0.7 共0.6⫾0.5兲 6⫾0.5 ⫺3.0⫾1.0 共0.3兲
corr. 2.9⫾1.0 共0.3⫾0.3兲 ⫺3.1⫾1.0
2196 J. Chem. Phys., Vol. 111, No. 5, 1 August 1999 Somasundaramet al.
[image:8.612.127.486.679.758.2]The study of scattering and absorption of molecular beams from liquid surfaces provides a complementary view of the problem.1,12
Experimentally, the solution of gases in liquids has been found to be a first-order process in which the net flux of material from the gas phase into liquid is described by the equation
J⫽kexp
⬘
共ceqbulk⫺cbulk兲, 共6.1兲where kexp
⬘
is a rate constant with dimensions of a velocityand cbulkis the actual concentration of the gas in the liquid. Although the value of the rate constant depends on the rate of stirring of the solution, Noyes et al.2found that it reached a plateau value at moderate stirring rates; further increases were attributed to vortexing. They evaluated the accommo-dation coefficient, ␥ 共defined as the probability that a mol-ecule hitting the surface reaches the bulk兲, using the plateau value of the rate constant. They found that the accommoda-tion coefficient for CO2entering pure water was found to be ␥⫽(5.4⫾0.4)⫻10⫺8 at 25 °C, that is only two molecules in a thousand million which hit the surface reach the bulk liq-uid. This number is orders of magnitude smaller than the values either of the sticking coefficient 共⫽1兲 or the fraction of molecules passing through the interface ( f⬇0.1) mea-sured in these simulations. This shows that the rate-determining step for solution in bulk liquid is neither the initial collision with the surface nor the passage through the interface. It has been generally recognized that the transport of the molecules from the interface into the bulk is impor-tant. There have been a number of models proposed for this process. The simplest of these is the stagnant layer model,13 in which the rate-determining process is the diffusion through a stagnant layer which is not affected by stirring. Using our results and the experimental value of␥ it is pos-sible to estimate the thickness of such a layer.
From an analogous treatment to that used to obtain the rate of permeation for films in Sec. V, we obtain an expres-sion for the steady-state flux through the interface and stag-nant layer
J⫽ D
hstag⫹␦共cbulk eq ⫺
cbulk兲, 共6.2兲
where hstag is the width of the stagnant layer and ␦ is the quantity associated with the interface defined in Eqs.共5.10兲 and共5.11兲. As the flux onto the surface is given by
Jon⫽
具
兩vz兩/2典
cgas, 共6.3兲 ␥ is given by␥⫽J/Jon⫽
DL
具
兩vz兩/2典
共hstag⫹␦兲. 共6.4兲
Thus
hstag⫹␦⫽
LD
具
兩vz兩/2典
␥, 共6.5兲
which for CO2using the experimental values of L, D, and␥,
gives
hstag⫹␦⫽0.3 mm, 共6.6兲
showing that the interface term,␦, is negligible.
In the renewal theory of the rate of gas absorption,10,14it is supposed that the layer of liquid just below the interface is mixed with the bulk from time to time. We can make no comment on this theory from our simulations.
VII. DISCUSSION AND CONCLUSIONS
In this paper we have presented results from simulations of carbon dioxide and nitrogen in and near thin films of water which give quantitative information about the pro-cesses involved in dissolving these gases in liquid water. Although the liquid–gas interface of water is about 5 Å wide as defined by density variations, it is much wider共10–15 Å兲 from the point of view of a solute molecule, which begins to interact with the liquid at some distance away in the gas phase and does not reach its bulk properties until it is far enough inside the liquid to form at least one complete solva-tion shell. The process of solusolva-tion can be divided into two parts which we have studied separately. The initial encounter of the solute with the surface results in it sticking on the surface in a free energy minimum. For both the solutes con-sidered here the molecule is less likely to penetrate into the bulk solution than to escape back into the gas phase, so the rate-determining step in the passage through the interface is the surface–liquid step. On the other hand, the subsequent diffusion of the molecule in the bulk liquid is more important in macroscopic problems.
The simulations all involved one or two solute molecules only, and have been carried out at 300 K. Thus effects of concentration and temperature have not been investigated. However, at 1 atmosphere pressure, only 2.5 10⫺5 carbon dioxide molecules hit each square A˚ ngstrom of surface every picosecond. Using the numbers in the table this gives an equilibrium concentration of 3.2 10⫺4 molecules per square A˚ ngstrom in the adsorbed layer. The average separation of these surface-adsorbed molecules共⬇50 Å兲is greater than the width of our simulation cell共14.7 Å兲and is large enough that interactions between molecules is unlikely to be important.
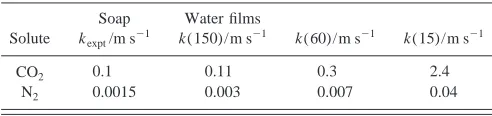
The most direct application of these results would be to permeation of thin films of pure water under steady-state conditions. Such films are unstable and have not been inves-tigated experimentally. The stability of thin water films is greatly enhanced by the presence of surfactant monolayers. The permeation rates of thin soap films have been thoroughly investigated; see, for example, the review by Exerowa et al.15 It was established that the permeability is dependent on temperature, the type of electrolyte, type of surfactant, and their concentrations.16–21The thinnest soap films, known as Newton black films, consist of two surfactant monolayers absorbed onto each other. Somewhat thicker thin soap films, for which the monolayers are separated by a water layer, are known as common black films. It has been found that the permeability of a typical Newton black film is usually larger than the permeability of a typical common black film.
Table V shows a comparison between the permeation rates of thin water films and a typical thin soap film. All the results are obtained under steady-state conditions at T
from the figures in the table that a water film is a factor of 2–4 times more permeable than the soap film of the same thickness. The water film thickness has to be increased to over 150 Å to give the same permeability. This is probably due to a lower solubility of the CO2in the alkyl chain region.
We have shown the feasibility of our approach for cal-culating permeation rates of films of any thickness under steady-state conditions. The rates of solution of gases in liq-uids is a more complex problem. Unlike most chemical re-actions where passage goes from reactant to product, the passage of the gas through the interface is not the end of the story. Our simulations support the idea that it is the move-ment of the solute away from the surface that is usually rate-determining. This is affected by local conditions such as stirring 共both in experiments and by ocean waves兲and cur-rents caused by convection and other processes. In the ex-perimental method developed by Davidovits et al.,1 the rate of gas uptake into small droplets of about 100 m is mea-sured. They have only published results on much more soluble gases than CO2, but the values of ␥ they find are
nearer the order of magnitude that we calculated for f共e.g.,
␥⫽0.1 for dimethylsulfoxide in water at 273 K兲. This may be coincidental, as one expects larger values of f for more soluble gases, but it should be noted that the droplet size is comparable to the deduced thickness of the stagnant layer for water and processes of stirring and convection must be very different in micro-droplets and bulk liquids.
A more microscopic experimental investigation of the process of adsorption on and passage through the interface has been performed by Nathanson and colleagues 共for a re-view see Ref. 22兲. They have used incident beams of mol-ecules of known energy共ranging from kT to 60 kT兲 scatter-ing off a freshly made surface of a liquid and determined the velocity distribution of scattered molecules using time-of-flight measurements. In general, the results show two over-lapping velocity distributions which are interpreted as repre-senting direct scattering from hard-sphere-like collisions and trapping followed by thermalization and desorption, respec-tively. Their results show that there is a high probability of trapping when the incident molecules are already near ther-mal velocity. At higher incident velocities a prominent direct peak appears, which is attributed to hard-sphere-like colli-sions. Our results for incident molecules at thermal energies have a sticking coefficient of unity with all the molecules becoming thermalized before leaving. Even at incident ener-gies up to 5 kT we saw no sign of directly scattered mol-ecules. However, there are important differences between their experiments and our simulations. In the experiments the liquid must have a very low vapor pressure so as not to interfere with the incoming molecular beam. They note that
the fraction of molecules thermalized is lower if the gas mol-ecules are light compared to the liquid molmol-ecules and if the incident beam has high energies and near glancing incidence. Our incident molecules are a factor of 2–3 more massive than the liquid molecules共water兲and the impact direction in the gas–liquid trajectories is either perpendicular to the sur-face or at 54°. It is possible that the sticking coefficient will be reduced at much higher energies.
In this work we have used simulation methods to esti-mate free energies of CO2and N2molecules penetrating the
surface of liquid water, the sticking probability of molecules incident from the gas phase 共⬃1兲, the barrier transmission coefficient共⬃0.15兲, the lifetime of molecules adsorbed in the surface layer共⬃15 ps for CO2兲, and the fraction of adsorbed molecules which enter the bulk 共⬃0.1 for CO2兲. We have used two different methods to estimate a correction to the permeability of a thin layer of water to CO2 and N2
mol-ecules caused by a nonuniform layer at the liquid surface. Both methods agree as to the thickness of this layer. In each case the correction is negative, which means that a thin layer of water with this nonuniform surface layer is slightly more permeable than a sharply truncated bulk. However, the change in permeability caused by this layer, for all but the thinnest liquid layers, is relatively small.
Simulation results for the process of adsorption are simi-lar to those found by molecusimi-lar beam scattering experiments at liquid surfaces where molecules are observed to stick with a high probability and then mostly desorb again after ther-malization is complete. Estimates of the permeation rate of thin films of water from the simulation results are similar to the experimental values found for permeation rates in thin soap films. Experimental measurements of the accommoda-tion coefficient indicate that only a very small fracaccommoda-tion of molecules incident on a water surface actually reach the true bulk. There are therefore other important processes which are rate-limiting in dissolution of small molecules in liquids.
ACKNOWLEDGMENTS
We acknowledge the generous support of the Hitachi Dublin Laboratory, who provided computer time. M.i.h.P. acknowledges support from the EU Human Capital and Mo-bility Program under Contract No. ERBCHBGCT 940520 and Forbairt, and T.S. acknowledges support from Queen’s University and the ESF. We thank the EPSRC 共Grant Nos. GR/K20651 and GR/L08427兲and the IFI共Grant to the Irish Center for Colloids and Biomaterials兲for their financial sup-port for this work.
1G. M. Nathanson, P. Davidovits, D. R. Worsnop, and C. E. Kolb, J. Phys.
Chem. 100, 13007共1996兲.
2R. M. Noyes, M. B. Rubin, and P. G. Bowers, J. Phys. Chem. 100, 4167 共1995兲.
3R. M. Noyes, M. B. Rubin, and P. G. Bowers, J. Phys. Chem. 96, 1000 共1992兲.
4
T. Somasundaram, R. M. Lynden-Bell, and C. H. Patterson, Phys. Chem. Chem. Phys. 1, 143共1999兲.
5M. in het Panhuis, C. H. Patterson, and R. M. Lynden-Bell, Mol. Phys. 94,
963共1998兲.
6
M. in het Panhuis, Ph.D thesis, Trinity College, Dublin, 1998.
7T. R. Forester and W. Smith, The DL-POLY-2.0 Reference Manual,
[image:10.612.51.297.74.132.2]ver-sion 2.0共CCLRC, Daresbury Laboratory, Warrington, England, 1995兲. TABLE V. Experimental permeation rates for a thin Newton black soap
film, and calculated rates for water films of width 150, 60, and 15 Å.
Solute
Soap kexpt/m s⫺1
Water films
k(150)/m s⫺1 k(60)/m s⫺1 k(15)/m s⫺1
CO2 0.1 0.11 0.3 2.4
N2 0.0015 0.003 0.007 0.04
2198 J. Chem. Phys., Vol. 111, No. 5, 1 August 1999 Somasundaramet al.
8H. J. C. Berendsen, J. R. Grigera, and T. P. Straatsma, J. Phys. Chem. 91,
6269共1987兲.
9D. Chandler, Introduction to Modern Statistical Mechanics共Oxford
Uni-versity Press, Oxford, 1987兲.
10D. B. Moog and G. H. Jirka, J. Hydr. Eng. 125, 3共1999兲.
11J. T. Jayne, P. Davidovits, D. R. Worsnop, M. S. Zahniser, and C. E. Kolb,
J. Phys. Chem. 95, 6329共1991兲.
12M. E. Saecker, S. T. Govoni, D. V. Kowalski, M. E. King, and G. M.
Nathanson, Science 252, 1421共1991兲.
13W. S. Broecker and T. H. Peng, Tellus 26, 21共1974兲. 14P. V. Danckwerts, Ind. Eng. Chem. 43, 1460共1951兲.
15D. Exerowa, D. Kashchiev, and D. Platikanov, Adv. Colloid Interface Sci.
40, 201共1992兲.
16R. Krustev, D. Platikanov, and M. Nedyalkov, Colloids Surf., A 123–
124,
383共1997兲.
17R. Krustev, D. Platikanov, and M. Nedyalkov, Colloids Surf., A 79, 129 共1993兲.
18R. Krustev, D. Platikanov, and M. Nedyalkov, Langmuir 12, 1688共1996兲. 19R. Krustev, D. Platikanov, A. Stankova, and M. Nedyalkov, J. Disp. Sci.
Tech. 18, 789共1997兲.
20
M. Nedyalkov, R. Krustev, D. Kashiev, D. Exerowa, and D. Platikanov, Colloid Polym. Sci. 266, 291共1988兲.
21M. Nedyalkov, R. Krustev, A. Stankova, and D. Platikanov, Langmuir 8,
3142共1992兲.
22P. Davidovits, J. T. Jayne, S. X. Xuan, D. R. Worsnop, M. S. Zahniser,
and C. E. Kolb, J. Phys. Chem. 95, 6337共1991兲.
23
H. M. Princen and S. G. Mason, J. Colloid Sci. 20, 353共1965兲.
24
H. M. Princen, J. Th. G. Overbeek, and S. G. Mason, J. Colloid Interface Sci. 24, 125共1966兲.
25IUPAC, Solubility Data Series, edited by R. Battino共Pergamon, Oxford,
1982兲, Vol. 10.
26IUPAC, Solubility Data Series共Oxford University Press, Oxford, 1996兲,
Vol. 62.