Munich Personal RePEc Archive
The Impact of Working Capital
Management on Firm Profitability and
Fixed Investment in Pakistan
Ali, Madiha and Ali, Syed Babar
June 2014
Online at
https://mpra.ub.uni-muenchen.de/64520/
1 | P a g e
The Impact of Working Capital Management on Firm
Profitability and Fixed Investment in Pakistan
Abstract
The research is done with a purpose of increasing knowledge about the importance of working
capital management.
The research investigates impact of working capital management on the profitability of the firms
along with the impact of the same on the fixed capital investment of the firm. The research also
finds out the interrelationship of fixed capital investment and the profitability because the
ultimate goal of the firms is to achieve maximum profitability at the lowest level of risk. The
research has thoroughly examined impact of variables involved through ratio analysis and tools
like regression and correlation.
The data was gathered from Karachi Stock Exchange. The data gathering was archival and panel
data was used as a method to extract the needed information. The 20 companies are selected
from KSE-30 index because they were considered the best performing stocks in the market. The
remaining 10 companies fall in the Banking sector which has a totally different perspective of
debt and equity situation, thus, commercial banks are eliminated from the KSE-30 companies in
this research.
The results of the study shows that the working capital management does not affect the
profitability of the firms in isolation, but there is a slight impact of managing the current assets
and current liabilities. These should be accompanied by other variables as well to ensure
profitability. The fixed capital investment has an extremely low, in fact negligible impact on
2 | P a g e
INTRODUCTION
1. Introduction
A running business is a composition of many important factors like fixed investment, current
assets, current liabilities, long term debt, equity and many more. Working capital is one of the
financial matric that represents the liquidity position of the company at the given time. Liquidity
is the ability of the firm to run its day to day operations without financial constraints. Working
capital is as important as the fixed assets like plant and equipment because both of these are a
part of the operating capital. The operating capital is important for the company because it is the
capital necessary for the operations of a firm. These assets are available for use in the production
of further assets. Other types of capital are used for financial transactions and long-term
improvements of the company and its growth.
As the fixed assets are important for the production of further assets and sales, working capital is
also important to keep the business in a running condition. Working capital is as important as the
life blood in human body (Reddy and Patkar, 2004).
The ultimate objective of any firm is to maximize the profit, but, preserving liquidity of the firm
is also an important objective. The problem is that increasing profits at the cost of liquidity can
invite serious problems to the firm. Therefore, there must be a tradeoff between these two
objectives of the firms. Firms may have an optimal level of working capital that maximizes their
3 | P a g e
1.1Background
Working capital management is a very important component of the corporate finance because it
has a direct effect on the profitability and liquidity of the organization (Rehman & Nasr, 2007).
Researchers have been trying to find the key to survival and success of the organizations since a
long time. There have been different debates as to what should be the perfect blend of
components on the balance sheet to ensure maximum returns and minimum risk. The debate
usually revolves around the capital structure that is the proportion of equity and debt, however,
the operating capital is also sometimes carefully looked by the stakeholders.
The working capital has an inverse relation with the fixed investment (Fazzari & Petersen, 1993).
The coefficient of endogenous working capital investment is negative in a fixed-investment
regression, as expected if working capital competes with fixed investment for a limited pool of
finance. The role of Working capital is extremely important, but is often neglected, as both a use
and a source of funds. Working capital can place finance constraints on investment affecting the
growth of the company.
The recent economic and financial turmoil has brought renewed focus on working capital
policies (Enqvist, 2013). With growing concerns after the financial crisis of 2008-09, the
companies have started to focus more on proper management of the funds available and try to
distribute them in a way that leads to a tradeoff between minimum risk of bankruptcy,
4 | P a g e
1.2Problem Statement
The problem statement that is to be analyzed with the help of this study is “Does Working
Capital Management has an effect on the Profitability of firms?”
Firms are trying hard and are applying many tactics so that they can remain competitive in the
industry and ensure their survival within the industry. In the financial chaos of 2008-09, many
big firms like Lehman Brothers that were deemed to be long lived, and were known as “too big
to fail” had to file for bankruptcy because of large amounts of current liabilities and inefficient
working capital management.
The markets have become more alert and educated about the allocation of the funds. Thus, to
remain an attractive investment, the operating companies must make sure that they comply with
all the variables that might affect the profitability of the firm. Along with that, the companies
have to find an optimal level between working capital and fixed investment so that they can
maximize the shareholders’ wealth through capitalizing on the growth opportunities without
losing its ability to meet short term obligations.
1.3Research Objective
The objective of this research is to discover if the working capital management has an impact on
the profitability of the firm and its growth. The main objective is to find out the important
variables that might affect the profitability and risk situation of the firm so that they can be
included in the firms’ financial planning. Certain variables in the field of financial management
5 | P a g e
firms’ profitability and growth. Considering the limitations of the study, only the effects of
working capital are observed which affects the profitability to a high level theoretically. It will
lead to further gaps for future researches.
To find the impact of Working capital management on the profitability of the firms
To find out the differences among industries with respect to the impact of Working
capital efficiency on the profitability on the firms
To find the impact of Working capital management on the Fixed Investment/growth of
the firms
1.4Research Questions
The specific research questions, as derived from the objectives, for this study are:
Is there an impact of Working capital management on the profitability of the firms?
Are there any differences among industries with respect to the impact of Working capital
efficiency on the profitability on the firms
Is there an impact of Working capital management on the Fixed Investment/growth of the
firms?
6 | P a g e
[image:7.612.77.518.109.528.2]ROIC 1.5Analysis Model
Figure 1.1: Analysis Model
1.6Variables
Linkage between ‘Working capital management’ and ‘the profitability of the firms’
In this context linkage between ‘Working capital management’ and ‘the profitability of the
firms.’ is tested.
– Working capital management (independent variable)
– Profitability of the firms (dependent variable)
Working Capital
Management
CATAR
CLTAR
Current Ratio
Accounts Rec. Turnover
Profitability
ROA
ROE
ROCE
EPS
Fixed Capital
Investment /
Growth
7 | P a g e
Linkage between ‘Working capital efficiency’ and ‘the profitability on the firms’ among different industries
In this context linkage between ‘Working capital efficiency’ and ‘the profitability on the firms.’
among different industries is tested.
– Working capital efficiency in different industries(independent variable)
– Profitability on the firms in different industries (dependent variable )
Linkage between ‘Working capital management’ and ‘the Fixed Investment/growth of the
firms’
– Working capital management (independent variable)
– Fixed Investment/growth of the firms (dependent variable)
Linkage between ‘Fixed Investment/growth of the firms’ and ‘the profitability on the
firms’
– Fixed Investment/growth of the firms (independent variable)
– Profitability of the firms (dependent variable)
Fixed Investment/growth of the firms is used as a dependent and independent variable for
investigating different linkages. Initially, the impact of Working capital management on Fixed
Investment/growth of the firms is investigated. Thus, Fixed Investment/growth of the firms is
8 | P a g e
Profitability of the firms is dependent variable and Fixed Investment/growth of the firms is
independent variable. The relation is clearly visible in the Analysis Model of Research.
1.7Hypothesis
Since, all the variables and the relationship among them for the study have been identified and
the theoretical framework has been developed, the research has following several testable
statements or hypothesis.
Hypothesis No. 1
Ho There is no causal relationship between working capital management and the profitability
of the firms
Ha There is a causal relationship between working capital management and the profitability
of the firms
Hypothesis No. 2
Ho Significant differences do not exist among industries with respect to a causal relationship
between working capital efficiency and the profitability on the firms
Ha Significant differences exist among industries with respect to a causal relationship
9 | P a g e
Hypothesis No. 3
Ho There is no causal relationship between working capital management and the Fixed
Investment/growth of the firms
Ha There is a causal relationship between working capital management and the Fixed
Investment/growth of the firms
Hypothesis No. 4
Ho There is no causal relationship between fixed Investment/growth of the firms and their
Profitability
Ha There is a causal relationship between fixed Investment/growth of the firms and their
Profitability
1.8Rationale
The study is meant to provide useful data about the fundamentals that are necessary for a running
business. Working capital is a fundamental part that represents liquidity of the company. The
ability to pay back the long and short term loans are decided on this particular factor by the
lenders. A proper working capital management might lead to a better profitability situation for
the company.
Keeping too much liquid assets might mean less investment in fixed assets. Thus, the working
capital management should be closely linked with the fixed capital investment which leads a firm
to its growth and other potential prospects. Managing the working capital ensures that the firm is
10 | P a g e
There might be other factors that are contributing to the profitability, for example economy,
management and others but these two factors identified under study affect the risk and return
situation of the company, as well. Thus, they are theoretically important. The idea is to check the
theoretical learning in the practical life.
If the results are positive, then the companies should add up this factor while their financial
planning and other stakeholders like lenders or customers can check the past trend data of the
company to judge its reliability.
On the whole the focus of working capital management and fixed capital investment is on
reducing the risk level of the organizations and save it from heavy losses due to improper
management of important variables.
1.9Scope
The scope of this research is to provide a model that will help in assessing the importance of
working capital management is different time periods and its effects on profitability and fixed
capital investment. The requirement as decided by the central banks is different in economic
downturns and economic booms. But the companies must also assess the required level of
financial variables that affect the company’s survival in these times.
1.10 Target Group
The target group is the public companies that are listed on the Karachi Stock Exchange. The
11 | P a g e
are the best performing companies of the market. The remaining 10 companies fall in the
Banking sector which has a totally different perspective of debt and equity situation, thus,
commercial banks are eliminated from the KSE-30 companies in this research. This will help us
to decide whether working capital management led these companies to a profitable situation or
12 | P a g e
CHAPTER 2: LITERATURE REVIEW
2. Literature Review
The field of corporate finance deals relates to different types of decisions like capital budgeting
decisions, capital structure decisions and working capital management decisions. The fact that
working capital management affects the profitability and liquidity position of the company
makes it a factor of important consideration in the ask of financial planning (Addae & Nyarko,
2013).
2.1Importance of financial planning
According to Kallberg, White & Ziemba (1982), there are different reasons that make proper
financial planning vital for the companies. A proper financial planning includes the incorporation
of proper variables that are important to a firm. This financial planning will in turn help the
companies to decide their short and long-term financial goals so that a plan can be created to
meet those obligations in the near future. The companies can attain their financial goal of highest
profitability if the appropriate financial planning is observed.
2.1.1 Income: It's conceivable to adequately manage the net income with the help of
this financial planning. This will help the companies to keep a check and balance for
the amount of cash that it will require for taxes, other month to month uses, retain and
investment funds.
2.1.2 Cash Flow: The companies can increase money streams via precisely checking its
uses and sources. The cautious planning of the upcoming expenditures will help the
company to maintain a cash reserve so that end time arrangements are not necessary
13 | P a g e
2.1.3 Capital: An expansion in money streams can prompt an increment in capital. It
will permit the companies to consider ventures to enhance growth of the company.
2.1.4 Security: Having the best possible coverage and arrangements set up can give
genuine feelings of serenity to the company’s management and shareholders along
with all other stakeholders.
2.1.5 Investment: The financial planning will allow the companies to gauge their risk
absorbing capability and thus the investments shall not breach the level of risk
identified through legitimate budgetary arrangement. It helps the company to pick the
right sorts of ventures that fit the company’s needs, identity, and objectives.
2.1.6 Avoid Bankruptcy Risk: The savings funds made from great arranging can prove
beneficial in troublesome times. For example, the company can pay dividends from
the retained earnings in case of loss reported in that period. This will help the
company’s rating and its stock price from falling down.
2.1.7 Financial Understanding: Better monetary comprehension could be attained when
measurable budgetary objectives are situated, the impacts of those choices are
understood, and results are inspected periodically. It provides an entirely new
approach to have an enhanced control over the financial position of the company.
2.1.8 Assets: Companies desire a pleasant 'cushion' in the form of assets. At the same
time numerous liabilities are also to be managed by the company. In this way, it gets
imperative to focus the real value of an asset. The financial planning helps the
companies to manage a balance position between the assets and the liabilities. The
14 | P a g e
2.2The importance of crisis theory
According to the Marx’s analysis of capitalism, which is very relevant here, the world of
wild stock market booms and slumps are more prevalent nowadays than ever before. The
economic downturn was no exception to this type of crisis. The financial crisis has the power
to destroy the healthy economies as well. The companies that were better managed
financially and elsewise managed to survive, whereas other ceased to exist as a result of this
financial crisis (Easterling, 2003).
2.3Working Capital Management
Working Capital management refers to the optimal level of current assets and current liabilities
because the working capital tends to meet the short-term financial requirements of a business
enterprise. It is an exchanging capital, not held in the business in a specific structure for more
than a year. The cash put into the business changes its structure throughout the ordinary course
of business operations (Rafuse, 1996).
The requirement for keeping up a satisfactory working capital can barely be questioned. In the
same way that course of blood is exceptionally essential in the human body to keep up the life,
the stream of funds is extremely important in keeping up the business. If by chance it gets weak,
the business can barely flourish and continue. Working capital shortage is considered as a real
cause if not the significant reason for the failure of business in many emerging countries (Rafuse,
15 | P a g e
2.4Investment in fixed and working capital
Recent capital-market research reveals that real investment is dependent on various financial
factors. If there is an availability of any external finance it will be more costly to the firm rather
than internal financing methods because of agency problems, transactions costs, or asymmetric
information.
Investment smoothing is the act of leveling the investment in the projects over the period of slow
economy and economic boom times. Investment smoothing is necessary to avoid the marginal
adjustment costs of acquiring and installing capital. It is because the cost increases with the rate
of investment. The businesses try to reduce the long-run costs because of rising marginal
adjustment cost by maintaining stable investment over the long run. The firms cannot delay the
investment projects for a very long time because of the increasing cost that it has to pay against
the time, thus increasing the need for investment smoothening. Along with that, if the
innovations are not tapped on time in this fast moving industry, then new investment
opportunities might be lost.
These lost opportunities will reduce the overall value of the firm because of the shorter product
life Cycles in these types of industries. Thus, the data might significantly tell different figures for
different industries. The companies get the first mover advantage by stepping in the market at
the earliest by investing their money in these projects. This is even more disastrous for the
situations where the projects are perishable and the value gets decreased as more and more
16 | P a g e
2.5The choice between Working capital management and Fixed Capital Investments
According to the previous studies, the firms that are depending on the cash flow fluctuations for
making the decisions regarding investment spending would lose significant amount of marginal
benefits with each project sacrifice. It is theoretically assumed that more risk would result in
more returns so the marginal returns for the projects in the periods of high cash flow would not
have high returns as the flow of capital in the market would generally be high in that time.
Thus, as a result, the use of smooth investment it is highly appreciated relative to cash-flow
variations. Lastly, while unrushed investment spending may take place constantly, some
investment projects are often distinct and take a lot of time to finish. It may be inflated for a firm
to diminish or abolish spending on a project in progress because of the transitory shortfalls in
cash flow.
2.6Fixed investment smoothing with working capital:
It is well realized that a firm confronting a coupling finance obligation will most likely be unable
to compare the marked down peripheral rates of profit for holdings crosswise over time.
Moreover, a reserved firm cannot compare marginal returns on investment to the business’ cost
of capital. Consider the effects because of the shock to cash flow, other things held constant. If
the shock is negative, the shadow value of finance will rise for financially constrained firms, and
they will respond by reducing their rate of asset accumulation (Fazzari & Petersen, 1993).
The returns for the firms come from both the working capital and the investing capital. So,
technically, in the times of distress, reducing the proportionate amount of fixed and working
capital is not adequate because of the benefits through liquid nature of the working capital. If the
17 | P a g e
expenses and losses are decreased as compared to the costs associated with the reduction of fixed
investments. Working capital serves as a source of fund as well, so it can be assumed as the
method of overcoming the firms’ short-run financing constraints (Fazzari & Petersen, 1993).
2.7Profitability of the Firms
The profitability of the firms is the reason why the businesses keep operating. Thus it is
important for the firms to find the ways that will help it to maximize the profitability and reap the
full potential. the profitability is the return that the company is getting from investing in
particular assets and the profitability of the shareholders or equity holders is the returns that they
are getting on their invested dollar. So, all of the stakeholders are really concerned with the
profitability of the firm (Geroski, Machin & Van Reenen, 1993).
There are different factors that affect the profitability of the firms. These factors might include
the choice between the available alternatives for investment, efficient working capital
management, the capability of the management to run the firm in a well demonstrating manner
etc. (Geroski, Machin & Van Reenen, 1993).
2.8Gaps in the Literature
There have been many debates in the past literature as to the importance of working capital for
ensuring the profitability of the firms. While most of the researches accept the theoretical model
that encourages the use of proper working capital management for maximizing the profitability
18 | P a g e
working capital management rather than the attractiveness and importance of the project at a
given time to avoid the financial constraints.
Along with that, there have been researches on the Pakistani firms for gauging the effects of
working capital on the profitability but none of them considered the fact across different
industries considering the different nature if those industries. Those researches were focused on a
particular segment only, thus limiting the scope of the study.
An additional gap filled by this research study is the effect of fixed capital investment on the
profitability and there will be comparability as to whether working capital or fixed capital is
19 | P a g e
CHAPTER 3: METHODOLOGY
3.1
Research Design
This is a quantitative research study. Conclusion is passed on the archival and panel data as the
information is publically available and is categorized as time series data of five years. The data is
extracted from the annual reports of the company and then ratios are calculated in order to gain
comparability among the companies. The data is distributed industry wise so that the bias due to
the difference in the nature of industries can be eliminated and more concrete results can be
identified. The study is conducted in order to draw a conclusion of relationship between the
identified dependent and independent variables.
Data on working capital, fixed investments and profitability is acquired from income statement
and balance sheet analysis of companies listed on Karachi Stock Exchange (KSE) for a period of
five years i.e. 2009-2013. The reason for constraining the time period is the availability
limitations of the latest and updated data and the ease of analysis.
3.2
Population
Population of the listed companies on Karachi stock Exchange is 582 companies. The target
population of this research will be the listed companies that are considered profitable by the
market indices. According to the KSE stock website, there are 33 sectors in the market that have
582 listed companies in all.
20 | P a g e
3.3
Sample Size
The sample size for this research is 20comapnies that are listed as top companies by the market
in the KSE-30 index except the commercial banks and other financial institutions.
3.4
Sampling Method
The sample is selected through the selection of industries that fall in the KSE-30. The particular
market index is selected because of its profitability as they are the best performing stocks
available in the market.
Information was collected for the six sectors that are a part of the KSE-30 index
Oil and Gas
Construction and Materials (Cement)
Chemicals
Personal Goods (Textile)
Food Producer
Electricity
3.5
Research Instrument
Research instrument used for the research are the annual reports. The annual reports have all the
21 | P a g e
3.6
Plan of Analysis
Following analyses is conducted:
Descriptive Analysis
Pearson’s coefficient Correlational Analysis
Regression Analysis
ANOVA
T-test
3.7
Software Used
The software used in this research is Microsoft Excel and SPSS. These are the basic software
22 | P a g e
CHAPTER 4: FINDINGS
Data Extraction:
The data was extracted from the annual reports of the companies chosen to be the part of the
research. The calculations of ratios include book values of the balance sheet items since there is a
discrepancy in using market value or fair value. Along with that, the market values are subject to
availability which could have led to missing figures. Along with that, this affects the legitimacy
of the values because of the time frame when the market values were re-estimated. The
profitability figures were taken from the net income and related statements, if any.
4.1 Descriptive Analysis of Sample
The descriptive statistics are combined through descriptive analysis technique. It helps in
bifurcation of the data according to the needs of the study and provides a transparent result for
analysis.
Sector Name Number of Companies
Oil and Gas 6
Construction and Materials (Cement) 5
Chemicals 4
Personal Goods (Textile) 2
Food Producer 1
Electricity 2
[image:23.612.71.451.470.709.2]TOTAL 20
23 | P a g e
Figure4.1: Descriptive Analysis of Sample
The companies under study belong to six major sectors of the markets. The majority of the
companies, i.e. a total of 6 companies that makes 30% of the companies under review, lie in the
Oil and Gas sector. It is because the nature of the oil and gas industry is very attractive since
there is a onetime cost of exploration and development. The cash flow streams become constant
and the cost of extraction is very low. Thus, the companies can give away as much as 100% in
the dividend. However, companies do retain some amount for further growth.
The second heavily populated sector is the Construction and Materials (Cement) having 25%
share in the sample that is 5 companies. It is followed by Chemicals sector by 4 companies that
is 20% of the population size. The cement industry is also very attractive but the inefficient
management practices in the cement industries of Pakistan leads it to a lower position. Personal
Goods (Textile) and Electricity, both have 2 companies that is 10% of the sample. The last sector
is Food Producer which has only 5% share with one company only.
30%
25% 20%
10% 5%
10%
No. of Comp in Each Sector
Oil and Gas
Construction and Materials (Cement)
Chemicals
Personal Goods (Textile)
Food Producer
24 | P a g e
4.2 Descriptive Statics of Variables
The descriptive analysis involves the means and standard deviation of the pooled variables of
interest in the study. It also presents the maximum and minimum values of the variables which
help in getting a picture about the maximum and minimum values that a firm can achieve in that
particular variable. Table 4.2 presents descriptive statistics for 20 listed Pakistani firms from
2009 to 2013.
Descriptive Statistics
N Minimum Maximum Mean Std. Deviation
CATAR 20 3 91 37.04 22.959
CLTAR 20 6 70 33.19 18.973
Current Ratio 20 .0316 5.3092 1.506167E0 1.1647728
Accounts Receivable
turnover
20 .77 4778.04 2.9418E2 1059.35131
EPS 20 -1.33 58.72 13.2011 14.73831
ROA 20 -.02 .31 .0966 .08327
ROE 20 -.10 .80 .2231 .18777
ROCE 20 .06 1.08 .3147 .24021
Fixed investment to Capital
Ratio
20 .01 4.25 1.5583 1.11764
ROIC 20 -1.66 .37 -.0582 .44445
Valid N (listwise) 20
25 | P a g e
The mean value of Current assets to total assets ratio is 37.04%, and standard deviation is
22.96%. It means that value of CATAR can deviate from mean to both sides by 22.96%. The
maximum value for the CATAR is 91% for a company in a particular year while the minimum is
3%. Similarly, Current Assets to Total Assets ratio is used to check how much portion of assets
does the firm holds in its financial statements as related to its total assets.
In a total of 20 companies under review, the mean was found to be 33.19% with the standard
variation of 18.973%, which means that most of the companies hold the remaining proportion of
67% in the intangibles and fixed assets portion. The maximum amount is as much as 70%,
leaving 30% for the fixed assets; whereas the minimum amount is 6% which seems too low for
the distressing times.
The current ratio is the first thing that comes to mind when checking the liquidity position of the
company. Here, the mean of current ratio for these 20 companies is found to be 1.50 with a
standard deviation of 1.16. Normally, the current asset depends on the industry average however,
any number above 1 is generally considered good because it shows that the current assets are
more than the current liabilities so the company can pay off its obligations without having to
liquidate the fixed assets portion. The maximum value observed is 5.3 which is too high,
representing the risk averse nature of the company or its inability to finance the current assets by
the current liabilities. The company hasn’t leveraged it assets properly in this case. The minimum
amount of current ratio is .0316.
The Accounts receivable turnover is used as a proxy to check the efficiency in managing
26 | P a g e
minimum value is 0.77 days. It shows that there are some forms that have extremely loosened
credit policy whereas others do not work on credit sales at all.
The average EPS as observed by these companies is Rs.13.20, with a standard deviation of
Rs.14.73. The maximum EPS demonstrated by a company in these years is 58.72 whereas the
lowest EPS figure is -1.33 representing a loss.
ROA investigates the return on total assets employed by the company. The overall effect of
current and fixed asset distribution can be analyzed by this ratio. The mean result for this
variable is calculated to be 9.6% with a standard deviation of 8.3%. The minimum is -2% which
indicates a loss, and the maximum value is 31% which is quite appealing for the investors.
However, investors are more concerned about how much return they are having on their invested
capital. For this purpose, they use ROE. The mean of this ratio is as much as 22.31, with the
standard deviation of 18.77%, indicating the reason of inclusion of these in the top thirty
companies. The investors can see a return on their investment of up to 80%, whereas the
minimum value is -10%.
Last, but not least, profitability is measured by a comprehensive ratio of ROCE. The ratio
analyzes the return before any interest or tax is subtracted against the long term debt and the
equity. Thus, it tells the efficiency of the company to generate revenues on the capital employed.
The more efficiency firm is able to manage it current liabilities (non-interest bearing) the more
will be the results, indicating more efficient use of capital. The mean ROCE for these companies
is 31.47% with Std. Deviation of 24%. The minimum value is 6% whereas the maximum is as
much as 108%. Hence there is vast variability among the companies.
The Fixed Asset-To-Equity Capital Ratio tells how performing their fixed assets are. This helps
27 | P a g e
investments or assets in the worst situation if the revenues get dried up completely. Mean is
found to be 155.83% with standard deviation of 1.11764. Minimum value is 1%, whereas the
maximum is 425%. This signifies that the assets have 4 times more worth than their equity
invested.
ROIC is a profitability measure used by most of the companies and stakeholders because it helps
to assess the company's efficiency at allocating the capital to profitable investments. If the
company is allocating the available money properly to generate returns, then this ratio would be
higher. It tells about how much effect the fixed investment is placing on the profitability. It
calculates the "return on capital". The mean value is –5.8% which means that actually the company
had a loss if the dividends were subtracted from the net income and divided by the total capital
invested. The minimum value for ROIC was -1.66, whereas the maximum value was 0.37. The mean
28 | P a g e
4.3 Correlation Analysis
Since the nature of this study is to find the cause and effect relationship between the variable.
The cause and effect relation is generally identified by the regression analysis. However,
according to the statisticians, the regression will be strong if the correlation is strong it is because
correlation identifies the interdependences between the variables. So, in case the correlation
between the variables is found to be strong, then the regression analysis will not be interpreted
for those variables under study as the cause and effect relation will be identified by the
correlation in both directions.
The significant values at 0.01 and 0.05 are found for the variables ROA and ROE, CLTAR and
current ratio, ROA and current ratio, ROIC and EPS, ROCE and ROE, ROCE and ROA & Fixed
investment to Capital Ratio and EPS
The correlation between ROA and ROE is positive, strong and significant. But the relationship of
these variables is not intended by this research study. So it does not affect any of the regression
variables. Similar is the case for CLTAR and current ratio except the fact that there is a weak
relationship as well between the variables.
The correlation value for ROA and current ratio is significant but not strong. There is a positive
relationship between them; however the relationship must be strong enough to prove the
interdependency.
ROIC and EPS slightly affects the fourth hypothesis of this study because there is a strong
positive significant relationship between them. However, the profitability is not dependent on
29 | P a g e
ROCE and ROE, ROCE and ROA & Fixed investment to Capital Ratio and EPS are a part of the
profitability which consists of multiple variables. Thus, the effect of strong correlation will be
30 | P a g e
4.4 Regression Analysis
The regression analysis tends to identify the cause and effect relationship between the variables
involved in the study.
Working Capital and Profitability
Referring to the regression analysis, it can be seen that the value of R-square is found to be
40.2%. The regressing of ROA on Accounts Receivable, Current Ratio, CATAR and CLTAR
produced an R-square of 0.402, which indicates that 40.2 percent of the variation in ROA can be
explained by variability in a firm’s Accounts Receivable, Current Ratio, CATAR and CLTAR
that is the working capital management. Thus, as much as 40.2% of the variation in the value of
the dependent variable is explained by this regression model.
In the Analysis of Variance (ANOVA), if the value of F is at a level of 0.05 or less, it is
considered statistically significant. This suggests a linear relationship among the variables.
Statistical significance at a .05 level means there is a 95 percent chance that the relationship
among the variables is not due to chance. This has become the accepted significance level in
most research fields. The value of F for relation between working capital management and ROA
is 0.085 which is not significant. ROA is most affected by the current ratio as suggested by the
t-test analysis because all other factors are insignificant.
For the second variable of profitability, the regression analysis can be seen to have the value of
R-square of 23%. The regressing of ROE on Accounts Receivable, Current Ratio, CATAR and
CLTAR produced an R-square of 0.230, which indicates that 23% percent of the variation in
31 | P a g e
and CLTAR that is the working capital management. Thus, as much as 23% of the variation in
the value of the dependent variable is explained by this regression model.
In ANOVA, the value of F is at a level of more than 0.05, so it is considered statistically
insignificant. This suggests a non-linear relationship among the variables, if any. ROE is also
most affected by the current ratio as suggested by the t-test analysis because all other factors are
insignificant.
The third variable for profitability is ROCE, which captures the effect of both equity and long
term debt. The regressing of this variable against the working capital variables produced an
R-square of 0.256, which indicates that 25.6% percent of the variation in ROCE can be explained
by variability in a firm’s Accounts Receivable, Current Ratio, CATAR and CLTAR that is the
working capital management. ANOVA is insignificant whereas it is also most affected by the
current ratio as suggested by the t-test analysis because all other factors are insignificant.
The last variable for profitability is EPS which takes into account the net income as against the
shareholders equity to generate comparability between the companies. For this variable of
profitability, the regression analysis has a value of R-square of 27.3%. The regressing of EPS on
Accounts Receivable, Current Ratio, CATAR and CLTAR produced an R-square of 0.273,
which indicates that 27.3% percent of the variation in ROE can be explained by variability in a
firm’s Accounts Receivable, Current Ratio, CATAR and CLTAR that is the working capital
management. Thus, as only 27.3% of the variation in the value of the dependent variable is
32 | P a g e
The ANOVA has an insignificant F value. This suggests a non-linear relationship among the
variables, if any. Like every other factor, EPS is also most affected by the current ratio as
suggested by the t-test analysis.
Working Capital and Profitability among Industries
Since it is assumed that the effect of working capital management might be different for different
industries, the regression model is used separately on each industry. ROCE is a more intensive
financial variable, thus it is the only factor used to judge the impact of working capital efficiency
on the profitability of the sectors under study.
Oil and Gas:
Regressing the profitability variable on the working capital variable, an R-square of 0.661 is
found, referring to the fact that working capital management has laid a significant impact of
66.1% on the profitability of this sector.
The F value is high in ANOVA, increasing the probability of occurrence by chance. None of the
variable is identified by t-test that affects the profitability the most.
Construction and Materials (Cement)
The R-square of 1.00 is found by regressing the profitability variable on the working capital
variable for this sector. Thus, there is an impact of working capital management on the
profitability of the firms in this sector. Current ratio is found to have the most powerful affect in
33 | P a g e Chemicals
The R-square of 1.00 is found by regressing the profitability variable on the working capital
variable for this sector as well referring a 100% cause and effect relation. Thus, there is an
impact of working capital management on the profitability of the firms in this sector. In this
sector as well, the current ratio is found to have the most powerful affect.
Personal Goods (Textile)
For this sector as well, an R-square of 1.00 is found by regressing the profitability variable on the
working capital variable referring a 100% cause and effect relation. Thus, there is an impact of
working capital management on the profitability of the firms in this sector. In this sector,
CATAR, CLTAR, and Current Ratio are excluded because of a high correlation among the
variables. In this sector, the accounts receivable turnover has most powerful effect on
profitability.
Food Producer
There is only one company in this sector, so regression is not possible for this sector.
Electricity
The R-square of 1.00 is found by regressing ROCE on the working capital variable for this sector
as well referring a 100% cause and effect relation. Thus, there is an impact of working capital
34 | P a g e
CLTAR, and Current Ratio are excluded because of a high correlation among the variables. So,
once again, the accounts receivable turnover has most powerful effect on profitability.
Working Capital and Fixed Capital Investment
There is weak negative correlation among these variables as theoretically proved. However,
these values are not found significant for any of the variable involved. To the astonishment, an
R-square value of .450 is found when regressed. Oppositely, the F value for ANOVA is not
significant referring the probability of occurrence by chance. It is mostly and negatively affect by
the current ratio. It is hence found that the more the current ratio, the less the fixed capital
investment.
Fixed Capital Investment and Profitability
The correlation is weak among these variables, so regression can be applied to judge the
hypothesis. Referring to the regression analysis, it can be seen that the value of R-square is mere
11.6%. The regressing of fixed capital Investment on Profitability produced an R-square of
0.116, which indicates that only 11.6 percent of the variation in profitability can be explained by
variability in a firm’s fixed capital investment.
The F value in Analysis of Variance (ANOVA) is considered statistically insignificant and it is
35 | P a g e
4.5 Hypothesis Testing
Hypothesis No. 1
Ho There is no causal relationship between working capital management and the profitability
of the firms
Ha There is a causal relationship between working capital management and the profitability
of the firms
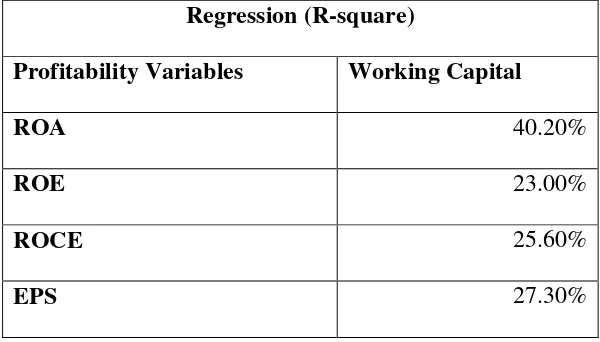
The table extracted from the Regression analysis explains the fact that the relationship between
working capital management and profitability is not very high. The only ratio that is affecting the
profitability is the current ratio. Thus a balance between the current assets and current liabilities
can deliver the desirable results to the firm. In all, there is a more inclination towards the
acceptance of the null hypothesis referring to the fact that there is no or a very little causal
relationship between working capital management and the profitability of the firms.
Regression (R-square)
Profitability Variables Working Capital
ROA 40.20%
ROE 23.00%
ROCE 25.60%
[image:36.612.70.370.431.602.2]EPS 27.30%
36 | P a g e Hypothesis No. 2
Ho Significant differences do not exist among industries with respect to a causal relationship
between working capital efficiency and the profitability on the firms
Ha Significant differences exist among industries with respect to a causal relationship
between working capital efficiency and the profitability on the firms
The table extracted from the Regression analysis explains the fact that the relationship between
working capital management and profitability is very high if seen for individual industries.
However, these results are a consequence of high correlation found among the factors. Thus it
cannot be explicitly said that working capital affects the profitability because of the two way
relation identified by correlation. In all, on the basis of regression only, the alternative hypothesis
would have been selected but due to correlation, there is a more inclination towards the
acceptance of the null hypothesis referring to the fact that there is no or a very little causal
relationship between working capital management and the profitability of the firms among
different industries.
Regression (R-square)
Profitability Variable Working Capital
Oil and Gas 66.10%
Construction and Materials (Cement) 100%
Chemicals 100%
Personal Goods (Textile) 100%
Food Producer N/A
[image:37.612.71.416.459.685.2]Electricity 100%
37 | P a g e Hypothesis No. 3
Ho There is no causal relationship between working capital management and the Fixed
Investment/growth of the firms
Ha There is a causal relationship between working capital management and the Fixed
Investment/growth of the firms
The data found through regression is more inclined towards the acceptance of null hypothesis
however, the relationship among these factors is medium thus referring to the fact that efficient
management of working capital, if current ratio is kept at the lowest possible level prevailing
among the industry players, will lead to a higher profitability.
Hypothesis No. 4
Ho There is no causal relationship between fixed Investment/growth of the firms and their
Profitability
Ha There is a causal relationship between fixed Investment/growth of the firms and their
Profitability
There is neither any interdependency between fixed Investment/growth of the firms and their
Profitability nor there exist any causal relationship between fixed Investment/growth of the firms
38 | P a g e
CHAPTER 5: DISCUSSION & CONCLUSION
5.1 Discussion
The overall impact between these variables suggests that the working capital management is
important for the profitability of the company but to a very small level. It cannot be explicitly
said that the effective working capital management is leading the company in the profitability
situation. In particular industries, there is interdependency between these variables suggesting
that the profitability also helps the companies to maintain a good working capital.
The relationship among working capital management and fixed capital investment is medium
thus referring to the fact that efficient management of working capital, if current ratio is kept at
the lowest possible level prevailing among the industry players, can lead the company to a higher
profitability level.
There is neither any interdependency between fixed Investment/growth of the firms and their
Profitability nor there exist any causal relationship between fixed Investment/growth of the firms
and their Profitability.
5.2 Conclusion
The importance of working capital management cannot be neglected completely; however, the
working capital management is not leading the firms to the profitability in isolation. So the
effective management should be accompanied by other relevant factors that result in better
39 | P a g e
5.3 Recommendations
The firms should carefully look on the current ratio as a measure to maintain their profitability
level constant and growing. Along with that, this particular factor will allow the companies to
make decisions about fixed capital investments in a better manner.
5.4 Limitations of the Study
Because of the different nature of financial industry in terms asset and equity distribution, this
particular sector was excluded from this study to eliminate the bias that it could have brought to
the data and results.
Other than that, there are different thing, identified in the literature that affect profitability of the
firm other than working capital and fixed investments, in theory. Since it was not possible to take
all of those factors into account, the external factors were kept constant for this study.
5.5 Future line of Research
Further research should investigate the effect of working capital of profitability of the financial
institutions especially banks. This will help in understanding the fact that why the amount of
reserves, as imposed by the central banks, are necessary for the banks. The research on financial
sector for the same topic must be done in isolation that is excluding all other sectors to generate
better results for that industry.
Further research should compare the sectors to give a generalized view about the profitability
situations of the firms. Other researchers can take into account other factors like the role of
40 | P a g e
References
Addae, A. A., & Nyarko-Baasi, M. (2013). Working Capital Management and Profitability: An
empirical Investigation in an Emerging Market. Research Journal of Finance and
Accounting, 4(15), 143-152.
Easterling, S., (2003), Marx's theory of economic crisis. International Socialist Review Issue 32.
Retrieved From: http://www.isreview.org/issues/32/crisis_theory.shtml
Enqvist, J., (2013). The Impact of Working Capital Management on Firm Profitability in
Different Business Cycles: Evidence from Finland.
Fazzari, S. M., & Petersen, B. C. (1993). Working capital and fixed investment: new evidence on
financing constraints. The RAND Journal of Economics, 328-342.
Geroski, P., Machin, S., & Van Reenen, J. (1993). The profitability of innovating firms. The
RAND Journal of Economics, 198-211.
Greg Filbeck, Thomas M. Krueger, (2005) "An Analysis of Working Capital Management
Results Across Industries", American Journal of Business, Vol. 20 Iss: 2, pp.11 – 20
http://www.ksestocks.com/ListedCompanies/SortByName
Juan.P.G. And Martinez. P.S. (2007). ‘Effects of working capital management on SME
profitability’, International journal of Managerial Finance, Vol 3 No 2, pp. 164-177
Kallberg, J. G., White, R. W., & Ziemba, W. T. (1982). Short term financial planning under
41 | P a g e
KSE stock (2014), List of Companies listed at Karachi Stock Exchange (KSE). Available at:
Rafuse, M. E. 1996. “Working Capital Management: An Urgent Need to Refocus”, Journal of
Management Decision, Vol. 34 No 2, pp. 59-63
Reddy Y.V and Patkar S.B., (2004), ‘Working Capital and Liquidity Management in Factoring:
A Comparative Study of SBI and Can Bank Factors’. The Management Accountant May,
Vol-39, No.-5, pp. 373-378.
Rehman and Nasr. (2007). ‘Working capital management and profitability – case of Pakistani
firms, International review of business research papers’, Vol. 01 No.1 pp.279-300
Panel Data Taken From Annual Reports of the companies
I | P a g e
Appendix
For Hypothesis 1: Correlation
CATAR Accounts_Rec ROE CLTAR ROA Current Ratio EPS ROIC ROCE
CATAR Pearson Correlation
Sig. (2-tailed)
N
Accounts_Rec Pearson Correlation .232
Sig. (2-tailed) .324
N 20
ROE Pearson Correlation .384 -.004
Sig. (2-tailed) .095 .985
N 20 20
CLTAR Pearson Correlation .435 .290 .189
Sig. (2-tailed) .055 .216 .424
N 20 20 20
ROA Pearson Correlation .349 -.125 .868** -.070
Sig. (2-tailed) .131 .600 .000 .769
N 20 20 20 20
Current_Ratio Pearson Correlation .221 -.102 .243 -.551* .544*
Sig. (2-tailed) .349 .667 .302 .012 .013
II | P a g e
EPS Pearson Correlation .301 -.149 .361 .065 .441 .359
Sig. (2-tailed) .198 .531 .118 .787 .052 .120
N 20 20 20 20 20 20
ROIC Pearson Correlation -.439 .061 -.076 -.209 -.159 -.026 -.786**
Sig. (2-tailed) .053 .800 .752 .376 .504 .914 .000
N 20 20 20 20 20 20 20
ROCE Pearson Correlation .401 -.101 .919** .220 .784** .194 .272
Sig. (2-tailed) .080 .672 .000 .351 .000 .412 .247
N 20 20 20 20 20 20 20
Fixed_investment_to_ Capital_Ratio
Pearson Correlation -.290 .062 -.357 -.259 -.429 -.329 -.618** .340 -.250
Sig. (2-tailed) .215 .795 .122 .271 .059 .156 .004 .142 .287
N 20 20 20 20 20 20 20 20 20
**. Correlation is significant at the 0.01 level (2-tailed).
III | P a g e Regression
Correlations
ROA CATAR CLTAR Current_Ratio Accounts_Rec
Pearson Correlation ROA 1.000 .349 -.070 .544 -.125
CATAR .349 1.000 .435 .221 .232
CLTAR -.070 .435 1.000 -.551 .290
Current_Ratio .544 .221 -.551 1.000 -.102
Accounts_Rec -.125 .232 .290 -.102 1.000
Sig. (1-tailed) ROA . .066 .384 .007 .300
CATAR .066 . .028 .174 .162
CLTAR .384 .028 . .006 .108
Current_Ratio .007 .174 .006 . .334
Accounts_Rec .300 .162 .108 .334 .
N ROA 20 20 20 20 20
CATAR 20 20 20 20 20
CLTAR 20 20 20 20 20
Current_Ratio 20 20 20 20 20
IV | P a g e
Variables Entered/Removedb
Model Variables Entered
Variable s Remove
d Method
1 Accounts_Rec,
Current_Ratio, CATAR, CLTARa
. Enter
a. All requested variables entered. b. Dependent Variable: ROA
Model Summary
Model R R Square
Adjusted R Square
Std. Error of the Estimate
Change Statistics
R Square
Change F Change df1 df2 Sig. F Change
1 .634a .402 .242 .07250 .402 2.516 4 15 .085
a. Predictors: (Constant), Accounts_Rec, Current_Ratio, CATAR, CLTAR
ANOVAb
Model Sum of Squares df Mean Square F Sig.
1 Regression .053 4 .013 2.516 .085a
Residual .079 15 .005
Total .132 19
a. Predictors: (Constant), Accounts_Rec, Current_Ratio, CATAR, CLTAR
V | P a g e
Coefficientsa
Model
Unstandardized Coefficients
Standardized Coefficients
t Sig. B Std. Error Beta
1 (Constant) -.029 .058 -.505 .621
CATAR .000 .001 .112 .397 .697
CLTAR .001 .001 .297 .894 .385
Current_Ratio .048 .022 .666 2.196 .044
Accounts_Rec -1.325E-5 .000 -.169 -.802 .435
VI | P a g e Regression
Correlations
ROE CATAR CLTAR Current_Ratio Accounts_Rec
Pearson Correlation ROE 1.000 .384 .189 .243 -.004
CATAR .384 1.000 .435 .221 .232
CLTAR .189 .435 1.000 -.551 .290
Current_Ratio .243 .221 -.551 1.000 -.102
Accounts_Rec -.004 .232 .290 -.102 1.000
Sig. (1-tailed) ROE . .047 .212 .151 .493
CATAR .047 . .028 .174 .162
CLTAR .212 .028 . .006 .108
Current_Ratio .151 .174 .006 . .334
Accounts_Rec .493 .162 .108 .334 .
N ROE 20 20 20 20 20
CATAR 20 20 20 20 20
CLTAR 20 20 20 20 20
Current_Ratio 20 20 20 20 20
VII | P a g e
Variables Entered/Removedb
Model Variables Entered
Variable s Remove
d Method
1 Accounts_Rec,
Current_Ratio, CATAR, CLTARa
. Enter
a. All requested variables entered. b. Dependent Variable: ROE
Model Summary
Model R R Square
Adjusted R Square
Std. Error of the Estimate
Change Statistics
R Square
Change F Change df1 df2 Sig. F Change
1 .479a .230 .024 .18546 .230 1.119 4 15 .384
a. Predictors: (Constant), Accounts_Rec, Current_Ratio, CATAR, CLTAR
ANOVAb
Model Sum of Squares df Mean Square F Sig.
1 Regression .154 4 .038 1.119 .384a
Residual .516 15 .034
Total .670 19
a. Predictors: (Constant), Accounts_Rec, Current_Ratio, CATAR, CLTAR
VIII | P a g e
Coefficientsa
Model
Unstandardized Coefficients
Standardized Coefficients
t Sig. B Std. Error Beta
1 (Constant) -.040 .149 -.270 .791
CATAR .001 .003 .156 .487 .633
CLTAR .004 .004 .376 .998 .334
Current_Ratio .065 .055 .405 1.176 .258
Accounts_Rec -1.916E-5 .000 -.108 -.453 .657
IX | P a g e Regression
Correlations
ROCE CATAR CLTAR Current_Ratio Accounts_Rec
Pearson Correlation ROCE 1.000 .401 .220 .194 -.101
CATAR .401 1.000 .435 .221 .232
CLTAR .220 .435 1.000 -.551 .290
Current_Ratio .194 .221 -.551 1.000 -.102
Accounts_Rec -.101 .232 .290 -.102 1.000
Sig. (1-tailed) ROCE . .040 .175 .206 .336
CATAR .040 . .028 .174 .162
CLTAR .175 .028 . .006 .108
Current_Ratio .206 .174 .006 . .334
Accounts_Rec .336 .162 .108 .334 .
N ROCE 20 20 20 20 20
CATAR 20 20 20 20 20
CLTAR 20 20 20 20 20
Current_Ratio 20 20 20 20 20
X | P a g e
Variables Entered/Removedb
Model Variables Entered
Variable s Remove
d Method
1 Accounts_Rec,
Current_Ratio, CATAR, CLTARa
. Enter
a. All requested variables entered. b. Dependent Variable: ROCE
Model Summary
Model R R Square
Adjusted R Square
Std. Error of the Estimate
Change Statistics
R Square
Change F Change df1 df2 Sig. F Change
1 .506a .256 .057 .23321 .256 1.289 4 15 .318
a. Predictors: (Constant), Accounts_Rec, Current_Ratio, CATAR, CLTAR
ANOVAb
Model Sum of Squares df Mean Square F Sig.
1 Regression .280 4 .070 1.289 .318a
Residual .816 15 .054
Total 1.096 19
a. Predictors: (Constant), Accounts_Rec, Current_Ratio, CATAR, CLTAR
XI | P a g e
Coefficientsa
Model
Unstandardized Coefficients
Standardized Coefficients
t Sig. B Std. Error Beta
1 (Constant) -.012 .187 -.063 .950
CATAR .002 .003 .221 .703 .493
CLTAR .005 .005 .369 .996 .335
Current_Ratio .067 .070 .325 .962 .351
Accounts_Rec -5.118E-5 .000 -.226 -.963 .351
XII | P a g e Regression
Correlations
EPS CATAR CLTAR Current_Ratio Accounts_Rec
Pearson Correlation EPS 1.000 .301 .065 .359 -.149
CATAR .301 1.000 .435 .221 .232
CLTAR .065 .435 1.000 -.551 .290
Current_Ratio .359 .221 -.551 1.000 -.102
Accounts_Rec -.149 .232 .290 -.102 1.000
Sig. (1-tailed) EPS . .099 .393 .060 .265
CATAR .099 . .028 .174 .162
CLTAR .393 .028 . .006 .108
Current_Ratio .060 .174 .006 . .334
Accounts_Rec .265 .162 .108 .334 .
N EPS 20 20 20 20 20
CATAR 20 20 20 20 20
CLTAR 20 20 20 20 20
Current_Ratio 20 20 20 20 20
XIII | P a g e
Variables Entered/Removedb
Model
Variables Entered
Variables
Removed Method
1 Accounts_Rec, Current_Ratio, CATAR, CLTARa
. Enter
a. All requested variables entered. b. Dependent Variable: EPS
Model Summary
Model R R Square
Adjusted R Square
Std. Error of the Estimate
Change Statistics
R Square
Change F Change df1 df2 Sig. F Change
1 .522a .273 .079 14.14466 .273 1.407 4 15 .279
a. Predictors: (Constant), Accounts_Rec, Current_Ratio, CATAR, CLTAR
ANOVAb
Model Sum of Squares df Mean Square F Sig.
1 Regression 1126.066 4 281.516 1.407 .279a
Residual 3001.070 15 200.071
Total 4127.136 19
a. Predictors: (Constant), Accounts_Rec, Current_Ratio, CATAR, CLTAR
XIV | P a g e
Coefficientsa
Model
Unstandardized Coefficients
Standardized Coefficients
t Sig. B Std. Error Beta
1 (Constant) -8.166 11.363 -.719 .483
CATAR .034 .200 .053 .171 .867
CLTAR .318 .284 .409 1.118 .281
Current_Ratio 6.954 4.228 .550 1.645 .121
Accounts_Rec -.003 .003 -.223 -.964 .350
XV | P a g e
For Hypothesis 2
Oil and Gas
Regression
Model Summary
Model R R Square
Adjusted R Square
Std. Error of the Estimate
Change Statistics
R Square
Change F Change df1 df2 Sig. F Change
1 .813a .661 -.693 .19844 .661 .488 4 1 .774
a. Predictors: (Constant), Accounts_Rec, Current_Ratio, CATAR, CLTAR
ANOVAb
Model Sum of Squares df Mean Square F Sig.
1 Regression .077 4 .019 .488 .774a
Residual .039 1 .039
Total .116 5
a. Predictors: (Constant), Accounts_Rec, Current_Ratio, CATAR, CLTAR
XVI | P a g e
Coefficientsa
Model
Unstandardized Coefficients
Standardized Coefficients
t Sig. B Std. Error Beta
1 (Constant) .201 .487 .412 .751
CATAR 3.484E-5 .004 .007 .008 .995
CLTAR -.002 .007 -.406 -.311 .808
Current_Ratio .042 .116 .515 .365 .777
Accounts_Rec .021 .039 .490 .535 .687