http://www.scirp.org/journal/jep ISSN Online: 2152-2219
ISSN Print: 2152-2197
DOI: 10.4236/jep.2017.89063 Aug. 24, 2017 1002 Journal of Environmental Protection
Ambient Levels of TSP, PM10, PM2.5 and
Particle Number Concentration in
Al Samha, UAE
Fadi A. Al-Jallad
1,2*, Clarence C. Rodrigues
1, Hamda A. Al-Thani
21Health, Safety and Environment Department, The Petroleum Institute, Abu Dhabi, UAE
2National Energy and Water Research Center, Abu Dhabi Water and Electricity Authority, Abu Dhabi, UAE
Abstract
The Arabian Peninsula experiences elevated levels of airborne particulate origi-nated from both natural and anthropogenic sources. This study is mainly aimed to determine the ambient levels of TSP, PM10 and PM2.5) at one of the monitor-ing locations “Al Samha” that is located in the northeast quadrant of UAE. Mass concentrations, particle count, as well as meteorological parameters were si-multaneously measured using a spectrometer, PM10 beta attenuation monitor and weather sensors for the period from April 10 to December 31, 2011. The hourly mean concentrations of TSP, PM10, PM2.5-10 and PM2.5 were 245, 110, 64 and 46 µg/m3, respectively. About 34%, 15% and 56% of the monitored days had daily concentrations above the allowable limits for TSP, PM10 and PM2.5, respectively. Diurnal peak occurred at 14:00 for TSP, at 10:00 for PM10, and at 04:00 for PM2.5 reaching values of up to 410, 122, and 54 µg/m3, respectively. The highest concentrations were observed on Saturdays for TSP and PM10, but on Sundays for PM2.5. July had the greatest monthly level of PM compared to other months of this study. The average ratios of PM10/TSP, PM2.5/TSP and PM2.5/PM10 were 0.61, 0.31 and 0.47, respectively. Weak relationships were found between the particle number and mass concentrations, while very strong to moderate correlations were observed among all PM size fractions as well as between TSP and wind speed. The measurement results of the light scattering spectrometer were strongly correlated with the beta attenuation monitor, but the mean value of the spectrometer was higher by 18%.
Keywords
Particulate Matters, Meteorological Parameters, Correlation How to cite this paper: Al-Jallad, F.A.,
Rodrigues, C.C. and Al-Thani, H.A. (2017) Ambient Levels of TSP, PM10, PM2.5 and Particle Number Concentration in Al Sam-ha, UAE. Journal of Environmental Protec-tion, 8, 1002-1017.
https://doi.org/10.4236/jep.2017.89063 Received: June 6, 2017
Accepted: August 21, 2017 Published: August 24, 2017
Copyright © 2017 by authors and Scientific Research Publishing Inc. This work is licensed under the Creative Commons Attribution International License (CC BY 4.0).
http://creativecommons.org/licenses/by/4.0/
DOI: 10.4236/jep.2017.89063 1003 Journal of Environmental Protection
1. Introduction
Air pollution kills about 7 million people, 12.5% of the global deaths, every year across the world [1], and it is expected to become the top environmental cause of global mortality by 2050 [2]. Predominantly, airborne particulates contribute greatly to poor air quality and are considered to be one of the biggest threats to human health in urban environments [3] [4] [5] [6] [7].
Airborne particulate can be classified in various ways based on their proper-ties such as; size, shape, formation mechanism, and composition. However, the most common classification is according to their characteristic size [8]. Total Sus-pended Particles (TSP) refers to all particles up to 50 micrometers (μm) in diame-ter that can remain suspended in the atmosphere for significant periods of time [9]. More precisely, Particulate Matter (PM) is usually labeled by a number indi-cating its aerodynamic diameter. For instance, PM10 (respirable) and PM2.5 (fine) refer to particles with a nominal mean aerodynamic diameter of less than or equal to 10 µm and 2.5 μm, respectively [10]. The notation PM2.5-10 is used to represent the coarse particles with an aerodynamic diameter between 2.5 μm and 10 μm [11].
The sources of PM are divided into three major categories; natural, anthropo-genic and secondary. Windblown dust, sea sprays, volcanoes, fires and pollen are examples of natural sources. On the other hand, anthropogenic sources are further classified into stationary and mobile subcategories; stationary sources are fixed-site producers such as power plants, factories, mines, farms, and waste-disposal sites. Whereas, mobile sources are mainly the transportation means such as cars, trucks, planes and ships that emit pollutants while moving [12]. Finally, second-ary fine particles are formed in the atmosphere through chemical reactions among the gaseous pollutants involving; sulfur dioxide (SO2), nitrogen oxides (NOx), volatile organic compounds (VOCs) and ammonia (NH3) [13].
Elevated levels of ambient PM might lead to considerable adverse effects on public health and the environment. On one hand, it contributes to visibility de-gradation, acid deposition, and influences the climate either directly by scatter-ing and absorbscatter-ing sunlight radiation or indirectly through providscatter-ing condensa-tion nuclei for cloud droplets [14]. On the other hand, both short and long-term exposures to PM cause respiratory and cardiovascular diseases and are also linked to overall increased mortality [15]. However, the size of the particle plays an important role in its potential hazard. As such, smaller particles have a larger surface area available for physical and chemical interactions, travel farther dis-tances, remain suspended for longer times, and penetrate deeper into the human respiratory system [16].
Therefore, strategic plans have been developed and implemented by many countries across the world to control PM levels and eventually minimize its ad-verse impacts [17]. In order to achieve the desired objectives, these control plans should be established based on reliable monitoring information, which high-lights the importance of assessment and evaluation programs [18].
DOI: 10.4236/jep.2017.89063 1004 Journal of Environmental Protection sources [19] [20] [21]. Thus, comprehensive studies are very essential to under-stand the temporal and the spatial behavior of the suspended particulates, and to accordingly apply effective measures to achieve and maintain acceptable levels.
In this study, continuous measurements were carried out at Al Samha area for TSP, PM10 & PM2.5 mass concentrations, particle count as well as meteorological parameters during the period from April 10 to December 31, 2011. The obtained results were comprehensively analyzed to examine different measurement tech-niques, verify the compliance with relevant standards, determine temporal varia-tion patterns, and investigate inter-correlavaria-tions between the measured parame-ters. The findings of this study might be of great relevance to scientists and deci-sion-makers, providing them with a fundamental basis to establish further re-search studies and develop effective policies for pollution reduction.
2. Material and Methods
2.1. Site Description
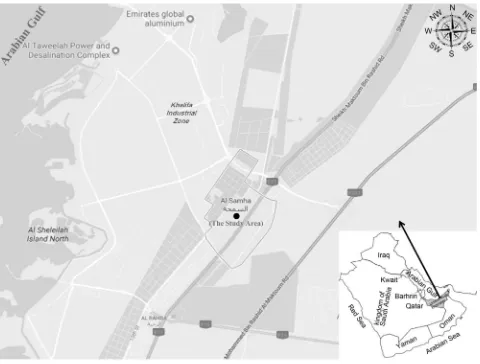
[image:3.595.59.539.338.702.2]The measurements were conducted in Al Samha area (Figure 1), which is lo-cated approximately 40 km northeast of Abu Dhabi City at about the midway to
DOI: 10.4236/jep.2017.89063 1005 Journal of Environmental Protection Dubai. The area is surrounded by various contributors of particulate matters, from sources such as desert sand, power plants, an aluminium smelter, and construction activities, in addition to road and sea traffic. Furthermore, sandstorms are a com-mon occurrence across the entire region, especially during the summer com-months.
The UAE generally has a subtropical and arid climate, being hot, humid and very dry during summer (April to September), and becoming cooler with occa-sional rainfall during the winter season (October to March) [22].
2.2. Instrumentation
In this study, TSP, PM10, PM2.5 mass concentrations and Particle Number (PN) were simultaneously measured using a Grimm aerosol spectrometer (Grimm Aerosol Technik GmbH, Germany, model EMD 365), which is also equipped with weather sensors (LufftGmbH, Germany, model WS600) to jointly monitor meteorological parameters such as wind speed, wind direction, relative humidity and temperature. The mass concentrations of the coarse particles (PM2.5-10) were calculated as the difference between PM10 and PM2.5 concentrations. Concur-rently, PM10 mass concentrations were measured continuously using a beta at-tenuation monitor (Environment S.A., France, model MP101M). For compari-son and verification purposes, TSP and PM2.5 daily levels were also gravimetri-cally determined by collecting of some random samples.
The spectrometer (EDM 365) is designed on the principle of orthogonal light scattering, where air containing multiple particle sizes passes through a flat laser beam. The scattered signal is collected at approximately 90˚ to the beam by a mirror and is detected by a high speed photodiode. Each signal is then counted and classified into different size channels by an integrated pulse height analyzer. Eventually, these counts are converted to a mass distribution using the density factor established for urban environments. The EDM 365 utilizes a diffusion dryer to avoid condensation during measurement, which is activated when the relative humidity exceeds 70%. In the beta attenuation monitor, the sampling stream is slightly heated to avoid water condensation, and the air sample is sucked at a constant flow rate (16.7 L/min) from PM10 size-selective inlet and pulled through a filter to deposit particles. At the end of a predefined hourly sampling cycle, the loaded filter is positioned between a carbon 14 beta source and a Geiger-Mueller detector to determine attenuation of the beta ray signal which is directly proportional to the mass of dust accumulated on the filter.
Finally, a particulate sampler (Environment S.A., France, model MP162) was used to collect daily random samples of TSP and PM2.5, where an air sample is drawn for 24 hours at a constant flow rate of 16.7 L/min through a size-selective inlet (TSP or PM2.5) and then collected on a 47 mm filter membrane. The filters were conditioned and weighted prior and after sampling to determine net weight gain due to the collection of sample and eventually estimate the concentration.
2.3. Regulations and Guidelines
DOI: 10.4236/jep.2017.89063 1006 Journal of Environmental Protection in order to protect public health and the environment (Table 1). These standards identify the maximum acceptable concentrations in ambient air, which should not be exceeded during a specified time interval. In this study, the UAE standards were used to assess the daily concentrations of TSP and PM10, while the PM2.5 daily limit of 35 µg/m3 was also consulted since it is widely applied in many countries such as the Kingdom of Saudi Arabia (KSA), United States (USA) and others.
Table 1. Ambient air quality standards for airborne particles (µg/m3).
Max Allowable Limit UAE Arabia Saudi WHO US-EPA European Union
TSP
Daily 230 - - - 150
Annual 90 - - - -
PM10
Daily 150 340* 50 150 50
Annual - 80 20 - 40
PM2.5
Daily - 35* 25 35* -
Annual - 15 10 15 25
*Based on a percentile value.
2.4. Statistical Analysis
All statistical analyses were performed using Microsoft Excel and SPSS Statistics. Pearson’s correlation analysis was used to determine the linear correlations be-tween the measured parameters, where the existence and strength of the rela-tionship is assessed based on the correlation coefficient (r) as follows: negligible if r < 0.19, weak if r is between 0.2 and 0.39, moderate if r is between 0.4 and 0.59, strong if between 0.6 and 0.79, and very strong if r > 0.8 [23].
3. Results and Discussion
3.1. Mass Concentrations and Particle Number
Descriptive statistics of the hourly concentrations obtained throughout the study period are summarized in Table 2. Based on mean value, TSP was approximate-ly 2.2, 3.8 and 5.3 times greater than PM10, PM2.5-10 and PM2.5, respectively; while PM10 was higher than PM2.5-10 by a factor of 1.7 and PM2.5 by a factor of 2.4. Hourly concentrations of the particulate number varied widely from 34,035 cm−3 to 2,085,556 cm−3 with a median of 247,431 cm−3.
Table 2. Statistical analysis results for measurements of hourly concentration conducted
during the study period.
Datum TSP PM10 PM2.5-10 PM2.5 PN
(µg·m−3) (cm−3)
Min 20 12 2 6 34,035
[image:5.595.208.538.661.719.2]DOI: 10.4236/jep.2017.89063 1007 Journal of Environmental Protection
Continued
Median 147 83 43 38 247,431
Mean 245 110 64 46 302,985
Stand. Deviation 317 94 66 34 212,882
98th Percentile 1164 399 278 140 924,524
As shown in Figure 2, elevated daily concentrations were observed during the study period for TSP, PM10 and PM2.5 reaching values of up to 1160 µg/m3, 657 µg/m3 and 252 µg/m3, respectively. Furthermore, about 34%, 15% and 56% of the monitored days had 24-hour average concentrations above the maximum al-lowable limits of TSP, PM10 and PM2.5, respectively. These elevated levels might be attributed to various factors including; increased human activities (e.g. indus-tries and traffic), frequent natural events (e.g. dust storms) and the significant influence of climate conditions (e.g. enhanced formation conditions of second-ary particles with high temperatures and intense sunlight in addition to re-suspension of surface dusts in dry conditions).
(a)
(b) 0
200 400 600 800 1000 1200
T
S
P
(µ
g
/m
3)
Date
TSP Daily Concentration UAE-Maximum Allowable Limit
0 100 200 300 400 500 600
P
M10
(
µ
g
/m
3)
Date
PM10 Daily Concentration
DOI: 10.4236/jep.2017.89063 1008 Journal of Environmental Protection (c)
Figure 2. Daily mass concentrations of airborne particulates (a) TSP, (b) PM10 and (c) PM2.5.
3.2. Temporal Variation of PM
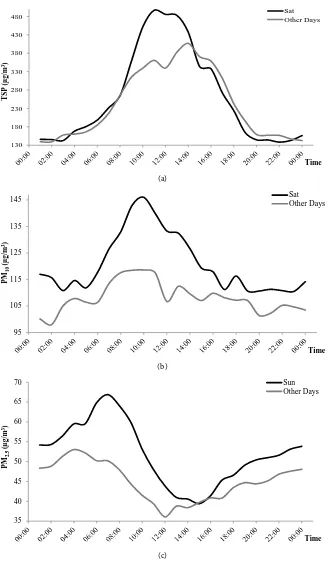
As it is obvious in Figure 3, the diurnal variation of PM with different size frac-tions did not follow a similar pattern because of their divergence characteristics as well as the variance of their behaviors in the atmosphere. The lowest levels of TSP and PM10 were observed during the early morning hours between 01:00 - 02:00 am, where the human activities are minimal and the climate is relatively cool, damp, with an eastern low-speed wind. After sunrise, the concentrations remarkably started to rise in conjunction with increased temperature and wind speed and reduced humidity, reaching primary and secondary peaks at 10:00 am and at 13:00 pm for PM10 and one hour later for TSP, and then began to decline. The rise in TSP and PM10 levels might be justified by a longer lifetime of par-ticles at low humidity conditions, re-suspension of surface dusts by higher wind speed, and formation of secondary aerosols at high temperatures. The observed time lag between PM10 and TSP can be explained by the longer time required to transport larger and heavier particles by the wind, in addition to the contribu-tion of the small particles that are agglomerated and coalesced to form greater ones over time. On the other hand, the least level of PM2.5 occurred at 12:00 noon associated with high temperature, low humidity, and moderate-speed western wind, and then PM2.5 level increased gradually to reach its peak at 04:00 am. The humid conditions are associated with high levels of PM2.5 which might be attributed to the role of moisture in forming secondary fine aerosol such as am-monium nitrate through the gas-to-particle conversion. Changes in prevailing wind directions have no noticeable effect on the average diurnal concentrations.
As illustrated in Table 3, the highest mean concentrations were observed on Saturdays for TSP and PM10 and on Sundays for PM2.5. On the other hand, the lowest levels were recorded on Thursdays for TSP and on Wednesdays for PM10 and PM2.5. The elevated PM levels during Saturday and Sunday might be attri-buted to the increased human and industrial activities during the free-time
0 50 100 150 200 250
P
M2.5
(
µ
g
/m
3)
Date PM2.5 Daily Concentration
DOI: 10.4236/jep.2017.89063 1009 Journal of Environmental Protection (a)
[image:8.595.210.534.69.471.2](b)
Figure 3. Diurnal variation patterns of the meteorological parameters and airborne
par-ticulates during the study period.
Table 3. Levels of airborne particulates (µg/m3) during the weekdays and weekends of the
study period.
Day TSP PM10 PM2.5
Min Max Mean ± S.D. Min Max Mean ± S.D. Min Max Mean ± S.D.
Sun 27 2875 255 ± 329 23 714 119 ± 92 11 286 52 ± 34
Mon 35 2591 248 ± 248 27 736 120 ± 94 11 347 51 ± 36
Tue 21 3530 243 ± 321 20 709 106 ± 73 6 158 43 ± 21
Wed 28 3831 246 ± 335 14 712 98 ± 71 8 245 40 ± 23
Thu 20 2029 230 ± 255 19 473 99 ± 67 8 173 41 ± 24
Fri 27 4496 230 ± 330 12 967 107 ± 112 7 409 45 ± 42
Sat 27 3347 260 ± 381 16 927 121 ± 131 10 348 51 ± 44
weekend (Saturday) and the first working day of the week (Sunday). As shown E E E SE SE
SE SE
SE S S SW
W W W NW NW NW NW NW NW NW N N NE
[image:8.595.209.539.548.690.2]DOI: 10.4236/jep.2017.89063 1010 Journal of Environmental Protection in Figure 4, relatively elevated concentrations were observed over extended time for the days of maximum records (Saturday for TSP and PM10 and Sunday for PM2.5) as compared with other days.
(a)
(b)
[image:9.595.210.538.125.687.2](c)
Figure 4. Diurnal variation patterns during the days when the maximum concentrations
were observed as compared with other days for (a) TSP, (b) PM10 and (c) PM2.5.
130 180 230 280 330 380 430 480
T
S
P
(µ
g
/m
3)
Time Sat Other Days
95 105 115 125 135 145
P
M
10
(
µ
g
/m
3)
Time
Sat Other Days
35 40 45 50 55 60 65 70
P
M
2.5
(
µ
g
/m
3)
Time
DOI: 10.4236/jep.2017.89063 1011 Journal of Environmental Protection Monthly variations of PM mass concentrations are given in Table 4. The highest mass mean concentrations were observed for all size fractions in July primarily due to the frequent occurrence of dust storms during this period of time. The pattern of TSP during April to July is consonant with the wind speed pattern, which indicates that there is a notable influence of wind speed on large particulate levels. As expected, the lowest PM levels were recorded during the cool winter season as a result of the humid and occasionally rainy conditions. As presented in Figure 5, non-identical pattern of higher diurnal concentrations of particulate matters was observed during the summer months (April-August) as compared to the winter months (September, November and December).
Table 4. Monthly levels of airborne particulates (µg/m3) during the study period.
Day TSP PM10 PM2.5
Min Max Mean ± S.D. Min Max Mean ±S.D. Min Max Mean ± S.D.
Apr 38 4496 345 ± 449 27 709 130 ± 91 12 159 49 ± 28
May 41 2875 331 ± 358 32 736 129 ± 90 8 269 46 ± 27
Jun 21 3347 307 ± 348 20 714 151 ± 104 18 286 61 ± 37
Jul 64 3831 415 ± 422 48 967 175 ± 147 19 409 70 ± 55
Aug 39 3248 256 ± 269 24 525 122 ± 74 12 185 52 ± 24
Sep 36 1291 124 ± 137 28 252 58 ± 23 14 72 28 ± 8
Oct* - - - -
Nov 20 710 95 ± 62 12 137 51 ± 20 6 85 26 ± 13
Dec 24 3530 115 ± 157 14 693 68 ± 51 8 347 38 ± 27
*Data is not available from September 26, 20:00 to October 24, 14:00 due to power supply failure.
(a)
50 100 150 200 250 300 350 400 450 500 550 600
T
S
P
(µ
g
/m
3)
DOI: 10.4236/jep.2017.89063 1012 Journal of Environmental Protection (b)
[image:11.595.209.537.68.450.2](c)
Figure 5. Diurnal variation patterns during summer and winter months for (a) TSP, (b)
PM10 and (c) PM2.5.
3.3. PM Mass Ratios
Based on the mean ratio values shown in Table 5, TSP contains nearly 39% of particles with an aerodynamic diameter greater than 10 µm (PM>10), and the rest (61%) is PM10, which consists of 47% PM2.5 and 53% PM2.5-10. These results are inconsistent with the results of Engelbrecht et al. [24] for daily samples collected in the UAE, where the reported ratios of PM10/TSP and PM2.5/PM10 were 0.71 and 0.37, respectively. The deviations between the obtained results and the above mentioned reported results by Engelbrecht et al. are mainly due to the influence of temporal and spatial variation in PM ambient levels. However, our results are closer to the typical PM2.5/PM10 ratio of 0.5 that have been documented for ur-ban areas in developing countries [25], and reported for urban sites in Iran [26].
Table 5. Mass ratios between airborne particulate of different size fractions at the study area.
Datum PM10/TSP PM2.5-10/TSP PM2.5/TSP PM2.5-10/PM10 PM2.5/PM10
Min 0.09 0.05 0.02 0.06 0.18
45 60 75 90 105 120 135 150 165
P
M
10
(
µ
g
/m
3)
Time
Summer Months
20 25 30 35 40 45 50 55 60 65
P
M
2.5
(
µ
g
/m
3)
Time
[image:11.595.204.541.694.733.2]DOI: 10.4236/jep.2017.89063 1013 Journal of Environmental Protection
Continued
Max 1.00 0.65 0.94 0.82 0.94
Mean ± S.D. 0.61 ± 0.26 0.30 ± 0.13 0.31 ± 0.20 0.53 ± 0.15 0.47 ± 0.15
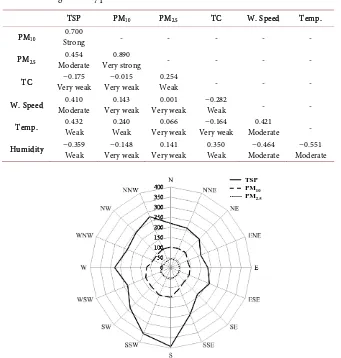
[image:12.595.205.540.86.116.2]As shown in Table 6, very strong to moderate inter-correlations are found between PM of different size fractions. The weak correlations between total par-ticle number and mass concentrations of particulate matter with different sizes indicate that the number of particles is an inadequate indicator of the mass levels and vice versa. The moderate correlation between TSP and wind speed is noti-ceable by the influence of wind on the diurnal variations of TSP. Figure 6 indi-cates that the highest average concentrations of airborne particulate are asso-ciated with wind coming from the south and south-southwest directions, where heavy highway traffic flow exists (re-suspension of surface dusts).
Table 6. Pearson correlation coefficient for airborne particulates and meteorological
pa-rameters during the study period.
TSP PM10 PM2.5 TC W. Speed Temp.
PM10 Strong 0.700 - - - - -
PM2.5 Moderate 0.454 Very strong 0.890 - - - -
TC Very weak −0.175 Very weak −0.015 Weak 0.254 - - -
W. Speed Moderate 0.410 Very weak 0.143 Very weak 0.001 −0.282 Weak - -
Temp. Weak 0.432 Weak 0.240 Very weak 0.066 Very weak −0.164 Moderate 0.421 -
Humidity −0.359 Weak Very weak −0.148 Very weak 0.141 Weak 0.350 Moderate −0.464 Moderate −0.551
Figure 6. TSP, PM10 & PM2.5 pollution rose at Al Samha during the study period.
3.4. Measurement Techniques Comparison
Measurement results of PM10 mass concentrations obtained by the light scattering
TSP
PM10
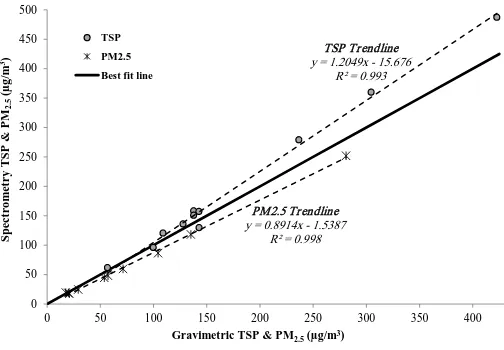
[image:12.595.204.545.297.655.2]DOI: 10.4236/jep.2017.89063 1014 Journal of Environmental Protection spectrometer were compared with the concentrations measured by the beta at-tenuation monitor, as shown in Figure 7. Consequently, a correlation coefficient of r = 0.73 (coefficient of determination r2 = 0.539) indicates a strong linear rela-tionship between the two measurement techniques. However, the PM10 mean value of the spectrometer results was 18% higher than its counterpart obtained by the beta attenuation monitor with the presence a statistically significant difference between the two data sets. This difference can be explained by the fact that both techniques may misestimate the actual concentrations [27] [28], and therefore their results need to be corrected by applying site specific and seasonal correction factors developed in line with the standard reference methods [29] which is beyond the scope of this study. However, TSP and PM2.5 results meas-ured by the spectrometer are perfectly correlated (r > 0.995) with its counter-parts obtained by gravimetric analysis of randomly collected samples as shown in Figure 8, noting that the spectrometer overestimated the TSP and underesti-mated the PM2.5 concentrations of the collected sample, especially at the high levels.
Figure 7. Comparison between PM10 concentrations measured by
spectrometry and beta attenuation techniques.
Figure 8. Comparison between TSP & PM2.5 concentrations
meas-ured by gravimetric and spectrometry techniques.
TSP Tr endline y = 1.2049x - 15.676
R² = 0.993
PM2.5 Tr endline y = 0.8914x - 1.5387
R² = 0.998
0 50 100 150 200 250 300 350 400 450 500
0 50 100 150 200 250 300 350 400
S
p
ect
ro
m
et
ry
T
S
P
&
P
M
2.5
(
µ
g
/m
3)
Gravimetric TSP & PM2.5 (µg/m3) TSP
[image:13.595.247.499.521.696.2]DOI: 10.4236/jep.2017.89063 1015 Journal of Environmental Protection
4. Conclusions and Recommendations
Based on the results of our study, the following major conclusions can be made: - The study area experienced elevated levels of particulate matters, where the
relevant maximum allowable limits were repeatedly violated. Therefore, long and short-term strategies should be implemented to reduce the levels of am-bient particulate thereby improving the environment which in turn would enhance quality of human life.
- Diurnal peak occurred at 14:00 for TSP, at 10:00 for PM10, and at 04:00 for PM2.5. The diurnal variation of TSP had nearly a similar trend of PM10, but quite the opposite of the PM2.5 pattern. These trends might be justified by the varying effects of the atmospheric conditions on the levels of different-size particles, fluctuations of human activities, and the dynamic interaction with other pollutants.
- The most polluted days were Saturdays for the large particles (TSP & PM10) and Sundays for fine particles (PM2.5), while Thursdays and Wednesdays were relatively the cleanest days. That can be attributed to the traffic density alteration through the weekdays and its effect on the levels of ambient parti-culate matter.
- The highest levels for all PM size fractions were observed in July and the lowest levels were noted in November. This might be linked to several factors such as the roles of meteorological parameters in air quality, differences be-tween daytime and night time with associated changes in human activities, varying climatic conditions, and the frequency of sandstorm occurrences. - On average, the mass of suspended dust in the study area contained nearly
39% of large particles (PM>10), 30% of coarse particles (PM2.5-10), and 31% of fine particles (PM2.5). On the other hand, PM10 consisted of 53% PM2.5-10 and 47% PM2.5.
- PM10 concentrations strongly correlated with TSP and PM2.5, but on the other hand TSP levels were moderately linked with PM2.5 and wind speed. In addi-tion, the particle number concentration was found to be a poor indicator of the ambient levels of airborne particulates.
- The measurement results of the light scattering spectrometer strongly corre-lated with the values of the beta attenuation monitor, but the mean value of the spectrometer was higher by 18%. Therefore, specific and seasonal correc-tion factors should be developed and applied to the results of both investi-gated techniques based the standard reference methods.
DOI: 10.4236/jep.2017.89063 1016 Journal of Environmental Protection
References
[1] World Health Organization (WHO) (2014) 7 Million Premature Deaths Annually
Linked to Air Pollution. Press Release, 25 March 2014.
[2] Organization for Economic Co-operation and Development (OECD) (2012) OECD
Environmental Outlook to 2050: The Consequences of Inaction. OECD Publishing, Paris.
[3] European Science Foundation (ESF) (1998) Environment and Health Research for
Europe: Scientists Recommendations. ESF Publishing, Strasbourg Cedex.
[4] El-Raey, M. (Ed.) (2006) Air Quality and Atmospheric Pollution in the Arab Re-gion. ESCWA/League of Arab States, United Nations Environment Programme and Regional Office for West Asia.
[5] McKenzie, J.F., Pinger, R.R. and Kotecki, J.E. (2008) An Introduction to Communi-ty Health. 6th Edition, Jones and Bartlett Learning, Inc., Boston, MA, p. 464. [6] Graff, D.W., Cascio, W.E., Rappold, A., Zhou, H., Huang, Y.T. and Devlin, R.B.
(2009) Exposure to Concentrated Coarse Air Pollution Particles Causes Mild
Car-diopulmonary Effects in Healthy Young Adults. Environmental Health
Perspec-tives, 117, 1089-1094.https://doi.org/10.1289/ehp.0900558
[7] Tang, D., Wang, C., Nie, J., Chen, R., Niu, Q., Kan, H., Chen, B., Perera, F. and Taiyuan, C.D.C. (2014) Health Benefits of Improving Air Quality in Taiyuan, Chi-na. Environment International, 73, 235-242.
https://doi.org/10.1016/j.envint.2014.07.016
[8] Cao, G. and Orrù, R. (Eds.) (2014) Current Environmental Issues and Challenges, Springer, Dordrecht, p. 19.
[9] Vallero, D. (2014) Fundamentals of Air Pollution. 5th Edition, Academic Press, London, p. 252.
[10] Schleicher, N.J. (2012) Chemical, Physical and Mineralogical Properties of Atmos-pheric Particulate Matter in the Megacity Beijing. KIT Scientific Publishing, Karlsruhe, p. 5.
[11] Gurjar, B., Molina, L.T. and Ojha, C.S.P. (2010) Air Pollution: Health and Envi-ronmental Impacts. CRC Press, Taylor & Francis Group, Boca Raton, 250.
[12] Phalen, R.F. (2002) The Particulate Air Pollution Controversy: A Case Study and Lessons Learned. Kluwer Academic Publishers, Boston, 40.
[13] Cheremisinoff, N.P. and Rosenfeld, P.E. (2009) Handbook of Pollution Prevention and Cleaner Production Vol. 2: Best Practices in the Wood and Paper Industries. Elsevier, William Andrew, Burlington, 200.
[14] Buseck, P.R. and Schwartz, S.E. (2003) Tropospheric Aerosols. In: Turekian, K.K. and Holland, H.D., Eds., Treatise on Geochemistry, Vol. 4, Elsevier Science Ltd., 91-142.
[15] World Health Organization (WHO) (2013) Health Effects of Particulate Matter. Regional Office for Europe, Copenhagen.
[16] Schleicher, N.J. (2012) Chemical, Physical and Mineralogical Properties of Atmos-pheric Particulate Matter in the Megacity Beijing. KIT Scientific Publishing, Karlsruhe, 1.
DOI: 10.4236/jep.2017.89063 1017 Journal of Environmental Protection
[18] Hester, R.E. and Harrison, R.M. (1997) Air Quality Management. The Royal Society of Chemistry, Cambridge, 42.
[19] Yeatts, K., El-Sadig, M., Leith, D., Kalsbeek, W., Al-Maskari, F., Couper, D., Funk, W., Zoubeidi, T., Chan, R., Trent, C., Davidson, C., Boundy, M., Kassab, M., Hasan, M., Rusyn, I., Gibson, J. and Olshan, A. (2012) Indoor Air Pollutants and Health in the United Arab Emirates. Environmental Health Perspectives, 120, 687-694. https://doi.org/10.1289/ehp.1104090
[20] Al-Jallad, F., Al-Katheeri, E. and Al-Omar, M. (2013) Concentrations of Particulate Matter and Their Relationships with Meteorological Variables. Journal of Sustaina-ble Environment Research, 23, 191-198.
[21] Nasser, Z., Salameh, P., Nasser, W., Abbas, L.A., Elias, E. and Leveque, A. (2015) Outdoor Particulate Matter (PM) and Associated Cardiovascular Diseases in the Middle East. International Journal of Occupational Medicine and Environmental Health, 28, 641-661.https://doi.org/10.13075/ijomeh.1896.00186
[22] Ministry of Energy (MoE) (2006) Initial National Communication to the United Nations Framework Convention on Climate Change. Ministry of Energy, United Arab Emirates.
[23] Campbell, M.J. and Swinscow, T.D.V. (2011) Statistics at Square One. 11th Edition, BMJ Books, Wiley-Blackwell Publishing, Oxford, 123.
[24] Engelbrecht, J.P., McDonald, E.V., Gillies, J.A., Jayanty, R.K.M., Casuccio, G. and Gertler, A.W. (2009) Characterizing Mineral Dusts and Other Aerosols from the Middle East-Part 1. Ambient Sampling, Inhalation Toxicology, 21, 297-326. https://doi.org/10.1080/08958370802464273
[25] World Health Organization (WHO) (2006) Air Quality Guidelines—Global Update. Particulate Matter, Ozone, Nitrogen Dioxide and Sulfur Dioxide. World Health Organization Regional Office for Europe, Copenhagen.
[26] Gholampour, A., Nabizadeh, R., Naseri, S., Yunesian, M., Taghipour, H., Rastkari, N., Nazmara, S., Faridi, S. and Mahvi, A.H. (2014) Exposure and Health Impacts of Outdoor Particulate Matter in Two Urban and Industrialized Area of Tabriz, Iran, Journal of Environmental Health Science and Engineering, 12, 1.
https://doi.org/10.1186/2052-336X-12-27
[27] De Jonge, D. (2008) Field Experiment on 11 Automated PM Monitors. Technical
Report, Department of Air Quality Research, Municipal Health Service, Amster-dam.
[28] Waldén, J., Hillamo, R., Aurela, M., Mäkelä, T., Laurila, S. and Institutet, M. (2010) Demonstration of the Equivalence of PM2.5 and PM10 Measurement Methods in
Helsinki 2007-2008. Finnish Meteorological Institute.
[29] United States Environmental Protection Agency (US-EPA). Code of Federal Regu-lations, Title 40, Part 50, 40 CFR Part 50. Appendix B, Reference Method for the Determination of Suspended Particulate Matter in the Atmosphere (High Volume Method), Appendix J, Reference Method for the Determination of Particulate Mat-ter as PM10 in the Atmosphere, and Appendix L, Reference Method for the
Deter-mination of Fine Particulate Matter as PM2.5 in the Atmosphere, USEPA,
Submit or recommend next manuscript to SCIRP and we will provide best service for you:
Accepting pre-submission inquiries through Email, Facebook, LinkedIn, Twitter, etc. A wide selection of journals (inclusive of 9 subjects, more than 200 journals)
Providing 24-hour high-quality service User-friendly online submission system Fair and swift peer-review system
Efficient typesetting and proofreading procedure
Display of the result of downloads and visits, as well as the number of cited articles Maximum dissemination of your research work
Submit your manuscript at: http://papersubmission.scirp.org/