Looking hard: Eye tracking for detecting grammaticality of
automatically compressed sentences
Sigrid Klerke University of Copenhagen
Copenhagen, Denmark skl@hum.ku.dk
H´ector Mart´ınez Alonso University of Copenhagen Copenhagen, Denmark
alonso@hum.ku.dk
Anders Søgaard University of Copenhagen
Copenhagen, Denmark soegaard@hum.ku.dk
Abstract
Natural language processing (NLP) tools are often developed with the intention of easing human processing, a goal which is hard to measure. Eye movements in read-ing are known to reflect aspects of the cog-nitive processing of text (Rayner et al., 2013). We explore how eye movements reflect aspects of reading that are of rel-evance to NLP system evaluation and de-velopment. This becomes increasingly rel-evant as eye tracking is becoming avail-able in consumer products. In this pa-per we present an analysis of the dif-ferences between reading automatic sen-tence compressions and manually simpli-fied newswire using eye-tracking experi-ments and readers’ evaluations. We show that both manual simplification and auto-matic sentence compression provide texts that are easier to process than standard newswire, and that the main source of dif-ficulty in processing machine-compressed text is ungrammaticality. Especially the proportion of regressions to previously read text is found to be sensitive to the dif-ferences in human- and computer-induced complexity. This finding is relevant for evaluation of automatic summarization, simplification and translation systems de-signed with the intention of facilitating hu-man reading.
1 Introduction
Intuitively, the readability of a text should reflect the effort that a reader must put into recognizing the meaning encoded in the text. As a concept, readability thus integrates both content and form.
Sentence-level readability assessment is desir-able from a computational point of view because
smaller operational units allow systems to take rich information into account with each deci-sion. This computer-centric approach is in con-trast to traditional human-centric readability met-rics which are explicitly constructed for use at text level (cf. Bjornsson (1983) and Flesch (1948)) and are by their own definitions unsuitable for au-tomatic application (cf. Benjamin (2012) for an evaluation of readability-formula usability).
The standard approach to assessing text read-ability in natural language processing (NLP) is to ask readers to judge the quality of the output in terms of comprehensibility, grammaticality and meaning preservation (cf. Siddharthan and Katsos (2012)). An alternative is to use existing text col-lections categorized by readability level for learn-ing models of distinct categories of readability e.g. age or grade levels (Schwarm and Ostendorf, 2005; Vajjala and Meurers, 2014).
In this paper we seek to establish whether ers share an intuitive conceptualization of the read-ability of single sentences, and to what extent this conceptualization is reflected in their reading be-havior. We research this by comparing subjective sentence-level readability judgments to recordings of readers’ eye movements and by testing to what extent these measures co-vary across sentences of varying length and complexity. These analyses enable us to evaluate whether sentence-level sim-plification operations can be meaningfully and di-rectly assessed using eye tracking, which would be of relevance to both manual and automated simpli-fication efforts.
1.1 Automatic Simplification by Compression
With inspiration from McDonald (2006), we train a sentence compression system on a corpus of parallel sentences of manually expert-simplified and original newswire text where all simplifica-tions are compressions. The system is described in detail in section 2.
Sentence compression works by simply drop-ping parts of a sentence and outputting the shorter sentence with less information content and simpler syntax. This approach allows us to control a num-ber of variables, and in particular, it guarantees that each expert simplification and each system output are true subsets of the original input, pro-viding three highly comparable versions of each sentence. Further the system serves as a proof of concept that a relatively small amount of task-specific data can be sufficient for this task.
Sentence compression is, in addition, an impor-tant step in several downstream NLP tasks, includ-ing summarization (Knight and Marcu, 2000) and machine translation (Stymne et al., 2013).
Below, we present the automatic simplification setup, including the parallel data, features and model selection and details on how we select the data for the eye-tracking experiment. The follow-ing section details the eye movement recordfollow-ing and subjective evaluation setup. Section 4 presents our results followed by a discussion and our con-clusions.
2 Automatic Simplification Setup
2.1 Training and Evaluation Corpus
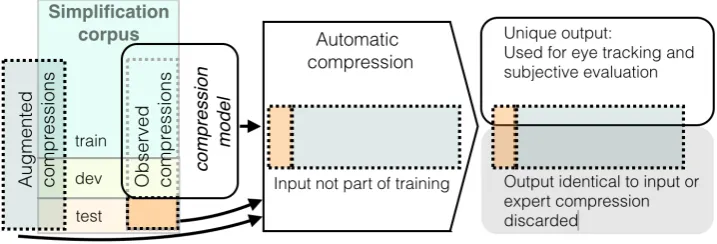
For the sentence compression training and evalu-ation data we extracted a subset of ordinary and simplified newswire texts from the Danish DSim corpus (Klerke and Søgaard, 2012). In Figure 1 we give a schematic overview of how the data for our experiments was obtained.
For model development and selection we ex-tracted all pairs of original and simplified sen-tences under the following criteria:
1. No sentence pair differs by more than 150 characters excluding punctuation.
2. The simplified sentence must be a strict sub-set of the original and contain a minimum of four tokens.
3. The original sentence must have at least one additional token compared to the simplified
sentence and this difference must be non-punctuation and of minimum three charac-ters’ length.
This results in a corpus of 2,332 sentence pairs, close to 4% of the DSim corpus. Descriptive statistics of this corpus are shown in Table 1.
We followed the train-dev-test split of the DSim corpus forming a training set of 1,973 sentence pairs, a development set of 239 pairs, and a test set of 118 pairs.1
For our experiment with eye tracking and sub-jective evaluation we created a similar dataset, denoted “augmented compressions” in Figure 1, from sentence pairs displaying similar compres-sions and in addition exactly one lexical substitu-tion. We augmented these pairs by simply chang-ing the synonym back to the original word choice, resulting in a valid compression. We obtained an automatically compressed version of these sen-tences from the trained model2. This results in a corpus of sentence triples consisting of an origi-nal, anexpertsimplification and asystem gener-ated version. In some cases the system output was identical to either the original input or to the ex-pert simplification. We therefore selected the eval-uation data to include only sentence triples where all three versions were in fact different from one another resulting in 140 sentence triples, i.e. 420 individual stimuli. On average the system deleted 15 tokens per sentence while the experts average around 12 token deletions per sentence.
2.2 Compression Model and Features
The compression model is a conditional random field (CRF) model trained to make a sequence of categorical decisions, in each determining whether the current word should be left out of the compres-sion output while taking into account the previous decision. We used CRF++ (Lafferty et al., 2001) trained with default parameter settings.
Below, we describe the features we imple-mented. The features focus on surface form, PoS-tags, dependencies and word frequency informa-tion. Our initial choice of features is based on the comparisons in Feng et al. (2010) and Falkenjack and J¨onsson (2014), who both find that parsing
1The corpus was PoS-tagged and parsed using the Bohnet
parser (Bohnet, 2010) trained on the Danish Dependency Treebank (Kromann, 2003) with Universal PoS-tags (Petrov et al., 2011).
2Note that this dataset did not contribute to training,
Figure 1: We extract observed compressions from the simplification corpus and train an automatic com-pression model. For the eye tracking and subjective evaluation we run the model on data that was not used for training. We only keep automatic compressions that are different from both the input and the expert compression. Augmented compressions are similar to compressions, but in addition they dis-play one lexical substitution. We augment these by substituting the original synonym back in the expert simplification, thereby making it a compression.
Original newswire Expert compressions Difference
Characters Tokens Characters Tokens % deleted tokens
Total 288,226 46,088 133,715 21,303 53.8%
Mean 123.6 19.8 57.3 9.1 51.0%
Std 43.2 7.1 24.5 4.0 18.2%
Range 24 – 291 5 – 45 15 – 178 4 – 33 4.4% – 86.2%
Table 1: Statistics on the full specialized corpus, 2.332 sentence pairs in total. Except for the row “Total”, statistics are per sentence. “Difference Tokens” report the average, standard deviation and range of the proportional change in number of tokens per sentence.
features are useful while the gain from adding fea-tures beyond shallow feafea-tures and dependencies is limited. In the CRF++ feature template we speci-fied each feature to include a window of up to +/- 2 tokens. In addition we included all pairwise com-binations of features and the bigram feature option which adds the model’s previous decision as a fea-ture for the current token.
Shallow FORM, POS, CASE: This group con-sists of the lowercase word form, universal PoS-tag and the original case of the word.
Length W LENGTH, S LENGTH: This group registers the word length (characters) and sentence length (tokens).
Position PLACE, NEG PLACE, REL TENTH,
THIRDS: This group records the token indices from both the beginning and end of the sentence, as well as each token’s relative position measured in tenths and in thirds of the sentence length.
Morphology BIGRAM, TRIGRAM, FOUR
-GRAM: The group records the final two, three and four characters of each token for all tokens of at
least four, five and six characters’ length, respec-tively.
Dependencies DEP HEAD, DEP LABEL: These
two features capture the index of the head of the token and the dependency label of this dependency relation.
Vocabulary OOV, FREQ 3, FREQ 5,
FREQ 10PS, FREQ 10EXP: This feature group records a range of frequency-counts3. The first feature records out-of-vocabulary words, the remaining features assign the token to one of 3, 5 or 10 bins according to it’s frequency.4 In the 10-bin cases “Pseudo tenths” (PS) assigns the token to one of 10 bins each representing an equal number of word forms5, while “Exponential”
3We used the Danish reference corpus KorpusDK
(As-mussen, 2001) concatenated with the training part of the DSim corpus
43 bins: in 1K most frequent tokens (mft), 5K mft or
out-side 5K mft. 5 bins: in 100 mft, 500 mft, 1K mft, 5K mft or outside 5K mft.
5Three large bins were assigned word forms occurring 1,
[image:3.595.105.496.302.396.2]splits the vocabulary into 10 bins containing a decreasing number of word forms as the contained word form frequencies rise exponentially.
2.3 Feature Selection
We tested five types of feature selection on the de-velopment set of the corpus, namely single best feature, single best feature group, add-one, and feature-wise and group-wise feature ablation. On the development set the single best feature was POS alone, the single best feature group was the Shallow group alone, while the add-one-approach returned the combination of the three features
FORM, PLACE and FREQ 10PS, and single fea-ture ablation returned all individual feafea-tures mi-nusFREQ 10EXP,OOV,REL TENTHS, and
group-wise ablation favored all groups minus the Vo-cabulary and Shallow groups. Of these, the last model, chosen with group-wise feature ablation, obtained the best F1-score on the test set. We use this model, which include the feature groups Length, Position, Morphology and Dependencies, to generate system output for the subsequent ex-periments.
3 Human Evaluation
The experiment described in the following section consisted of an eye tracking part and a subjective evaluation part. The eye tracking part of the ex-periment was carried out first and was followed by the subjective evaluation part, which was carried out by email invitation to an online survey.
We recruited 24 students aged 20 to 36 with Danish as first language, 6 male and 18 female. All had normal or corrected-to-normal vision. None of the participants had been diagnosed with dyslexia. A total of 20 participants completed the evaluation task. The experiment was a balanced and randomized Latin-square design. This design ensured that each participant saw only one ver-sion from each sentence-triple from one half of the dataset while being eye-tracked. Afterwards par-ticipants were asked to assign relative ranks be-tween all three versions in each sentence-triple in the half of the dataset which they had not previ-ously seen. In total, each version of each sentence was read by four participants in the eye-tracking experiment and ranked by 9-11 other participants. In the subjective evaluation task participants had to produce a strict ordering by readability of all three versions of each sentence, with the rank
‘1’ designating the most readable sentence. Pre-sentation order was fully randomized.
3.1 Eye Tracking Design
The stimuli were presented on a screen with 1080 x 1920 resolution, and eye movements were recorded with a Tobii X120 binocular eye tracker at 60hz. We used the IV-T fixation filter with stan-dard parameter settings (Olsen, 2012). The eye tracker was calibrated to each participant.
Each stimulus was presented on one screen with left, top and right margins of 300 px and 1-6 lines per slide6. The font vas Verdana, size 60px and line spacing was 0.8em7.
Participants were given written instructions and three demo trials before they were left alone to complete the experiment. All participants com-pleted 72 trials in three blocks, with the option to take a short break between blocks. Each trial consisted of a fixation screen visible for 1.5 sec-onds, followed by stimulus onset. The participants were instructed to try to notice if each sentence was comprehensible and to press a key to proceed to the following trial as soon as they had finished reading.
This setup only encourages but does not require participants to read for comprehension. Through data inspection and informal questions after the experiment, we ascertained that all participants were in fact reading and trying to decide which sentences were comprehensible.
3.2 Eye-movement Measures
Eye movements in reading can be divided into fixations and saccades. Saccades are rapid eye movements between fixations, and fixations are brief periods of relatively stationary eye positions where information can be obtained from an area covering the central 1-2 degrees of the visual field. Because reading is largely sequential, we can ob-serve regressions, which denote episodes of re-reading, that is, fixations directed at text which is located earlier in the text than the furthest fixated word (Holmqvist et al., 2011).
In our analyses we include the measures of eye movements described below. All measures are cal-culated per single sentence reading and averaged
6After recording, sentences with seven lines were
dis-carded due to data quality loss at the lower edge of the screen
7Following Blache (2012) who show that the viewing
over all four individual readings of each version of each sentence.
Fixation count (Fix), the average total number of fixations per sentence. This measure is expected to vary with sentence length, with more text re-quiring more fixations.
Total duration (ms), the average time spent reading the entire sentence. This measure is ex-pected to increase with sentence length and with sentence complexity.
Fixations per word (Fix/w), the average num-ber of fixations per word. This measure is sensitive to the number of saccades relative to the sentence length and is expected to reflect the reader’s con-fusion as more fixations are needed to collect ad-ditional information. It should also be expected to be sensitive to high amounts of long words.
Reading time per word (ms/w), the average time spent per word. This measure increases with slower paced reading, regardless of the number of fixations. Reading time is considered a measure of processing cost and is influenced by both lexi-cal and syntactic complexity.
Proportion regressions (%-regr), the propor-tion of fixapropor-tions spent on parts of the text that were already passed once. This measure is typically 10-15% in full paragraphs, and is expected to increase with sentence complexity. (Rayner et al., 2006)
We include the sentence length as number of words (n-words) in our analyses for comparison because sentence length can influence the reading strategy (Holmqvist et al., 2011).
Longer sentences will typically have a more complex syntax than short sentences due to the number of entities that need to be integrated into both the syntactic and mental representation of the sentence. However, unfamiliar or even erroneous words and syntax can add processing difficulties as well, leaving the reader to guess parts of the in-tended message. We consider all these cases under the termcomplexityas they are all likely to appear in automatically processed text. This is a natural consequence of the fact that statistical language processing tools are typically not able to distin-guish between extremely rare, but admissible text use and text that would be judged as invalid by a reader.
4 Results
We first analyze the correlation of the subjective evaluations followed by analyses that compare eye
movement measures, subjective rankings and sen-tence version.
4.1 Ranking
First we test whether the subjective rankings are similar between subjects. We estimate agreement with Kendall’s τB association statistic, which is
a pairwise correlation coefficient appropriate for comparing rank orderings. The range of τB is
[−1,1] where -1 indicates perfect disagreement, i.e. one ranking is the precise opposite order of the other, 1 indicates perfect agreement and 0 in-dicates no association, that is, the order of two el-ements in one ranking is equally likely to be the same and the opposite in the other ranking. The odds-ratio of a pair of elements being ranked con-cordantly is(1+τB)/(1−τB). The metricτB
com-pares pairs of rankings, and we therefore calculate the average over all pairs of participants’ agree-ment on each ranking task. We use the one-tailed one-sample student’s t-test to test whether the av-erage agreement between all 91 unique pairs of an-notators is significantly different from 0. If the rankings are awarded based on a shared under-standing and perception of readability, we expect the average agreement to be positive.
We find that the average τB is 0.311(p < 0.0001). This corresponds to a concordance odds-ratio of 1.90 which means that it is almost twice as likely that two annotators will agree than disagree on how to rank two versions of a sentence. Al-though this result is strongly significant, we note that it is a surprisingly low agreement given that the chance agreement is high for two people rank-ing three items.
The relatively low systematic agreement could arise either from annotators ranking only a few traits systematically (e.g. syntax errors rank low when present and otherwise ranking is random) or it could result from annotators following fully systematic but only slightly overlapping strate-gies for ranking (e.g. one ranks by number of long words while another ranks by sentence length which would tend to overlap).
4.2 Eye Tracking
Difference in medians
System – Expert System – Original Original – Expert Expert – Broken Broken – Original avg. rank 0.25 * -0.47 *** -0.73 *** -1.51 *** 0.78 *** ms -7.5 ms – -190.0 ms *** 182.5 ms *** -2 ms – -168 ms *** Fix -0.8 fix – -14.0 fix *** 13.3 fix *** -1.3 fix – -11 fix *** ms/w 3.0 ms – -3.0 ms – 6 ms ** -13 ms ** -3 ms – fix/w 0.1 fix – 0.4 fix *** -0.27 fix ** -0.19 fix – 0.36 fix ** %-regr 4 pp ** 1 pp – 5 pp *** 11 pp *** 2 pp – n-words -1 word * -2 words * 1 word – 0 words – -5 words –
[image:6.595.88.510.65.164.2]Table 2: Influence of sentence variant and brokenness on perceived readability and eye movements. When comparing Expert, Original and System 109 sentences are included while for Broken only 27 sentences are compared. Stars denote significance levels: *: p< .05, **: p< .01, ***: p< .001
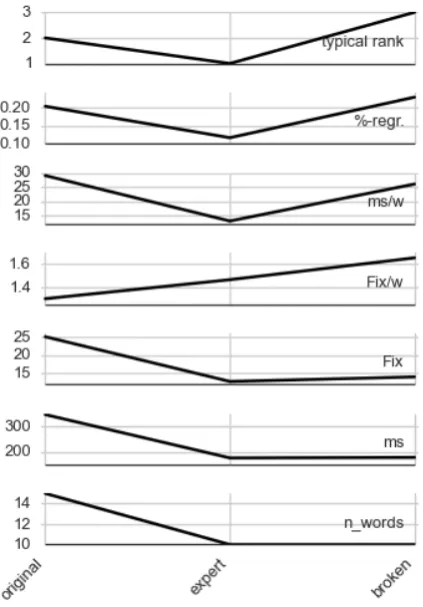
Figure 2: Interaction of sentence type and broken-ness on perceived readability and eye movements. (N=27)
the τB association, we now assign ranks within
each sentence-triple based on each eye-tracking measure and compare these pseudo-rankings to thetypical rankassigned by the annotators.8 We find that neither sentence length or any of the eye tracking measures are significantly associated with the typical rank. This means that we do not observe any correlation between sentences’
8This approach introduces ties which are handled by the
τBstatistic but influences the result notably since each
rank-ing task only includes 3 items.
perceived readability and the sentence length, the time it takes to read it or the speed or number of fixations or proportion of regressions recorded.
One potential reason why we do not observe the expected association between rank and eye movements can be that several of our eye track-ing measures are expected to vary differently with sentence length and complexity, whereas readers’ readability rankings are not necessarily varying consistently with any of these dimensions as par-ticipants are forced to conflate their experience into a one-dimensional evaluation.
In order to investigate whether the eye move-ments do in fact distinguish between length and complexity in sentences, we compare how readers read and rank long original sentences, short expert simplifications and short, syntactically broken sys-tem output.
The system output was post hoc categorized by syntactic acceptability by the main author and a colleague, resulting in a sample of 27 sentence triples with syntactically unacceptable system and a sample of 109 fully syntactically acceptable sen-tence triples. This allows us to compare the fol-lowing four groups, Original, Expert, Unbroken System and Broken System.
We compare all eye-movement measures and ranking for each pair of groups9 and test whether the measures differ significantly between groups using the Wilcoxon signed-rank test. We report the comparisons as the difference between the medi-ans in Table 2. This is similar to an unnormalized Cohen’s d effect size, but using the median as esti-mate of the central tendency rather than the mean. We observe that all group-wise comparisons re-ceive significantly different average ranks, ranging from the Unbroken System scoring a quarter of a
9We use the larger sample whenever the group Broken
[image:6.595.77.289.234.538.2]rank-position better than the Expert compressions to the Broken System output fairing 1.51 rank po-sitions worse than the Expert group.
Note that Broken System is also ranked signifi-cantly below the Original newswire sentences, sig-naling that bad syntax has a stronger impact on perceived readability than length. Even though the sample of Broken System sentences is small, overall reading time and number of fixations dis-tinguish the long Original sentences from both the short Expert simplifications and Broken Sys-tem outputs, that are comparably short. We also observe that the number of fixations per word is consistently lower for the long Original sentences compared to the other, shorter groups. Impor-tantly, we observe that two measures significantly distinguish Expert simplifications from syntacti-cally Broken System output, namely reading time per word, which is slower for Broken System syn-tax and proportion of regressions which is much higher in Broken System sentences. In addition and as the only eye-tracking measure, proportion of regressions also distinguishes between Unbro-ken System output and Expert simplifications, in-dicating a 4 percentage point increase in propor-tion of regressions when reading Unbroken Sys-tem output.
In Figure 2 we show how the medians of all the measures vary in the small subset that con-tain Broken System output, Expert compressions and Original newswire. The figure illustrates how the different aspects of reading behavior re-flect length and syntax differently, with regres-sions most closely following the subjective rank-ing (top).
5 Discussion
In the following section we discuss weaknesses and implications of our results.
5.1 Learning and Scoring the Compression Model
It is important to note that the compression model inherently relies on the expert compressed data, which means it penalizes any deviation from the single gold compression. This behavior is sub-optimal given that various good simplifications usually can be produced by deletion and that al-ternative good compressions are not necessarily overlapping with the gold compression. One ex-ample would be to pick either part of a split
sen-tence which can be equally good but will have zero overlap and count as an error. Our results suggest that the framework is still viable to learn a useful model, which would need a post-processing syn-tax check to overcome the synsyn-tax errors arising in the deletion process.
We note that the model produces more aggres-sive deletions than the experts, sometimes produc-ing sentences that sound more like headlines than the body of a text. It is surprising that this is the case, as it is typically considered easier to improve the readability slightly, but we speculate that the behavior could reflect that the parts of the training data with headline-like characteristics may pro-vide a strong, learnable pattern. However, from an application perspective, it would be simple to ex-ploit this in a stacked model setup, where models trained to exhibit different characteristics present a range of alternative simplifications to a higher-level model.
From inspections of the output we observe that the first clause tends to be kept. This may be domain-dependent or it may reflect that PoS-tags and parsing features are more reliable in the be-ginning of the sentence. This could be tested in the future by applying the model to text from a domain with different information structure.
5.2 Implications for System Development
We found that the very simple compression model presented in this paper was performing extensive simplifications, which is important in light of the fact that humans consider it harder to produce more aggressive simplifications. We trained our model on a relatively small, specialized compres-sion corpus. The Simple English Wikipedia sim-plification corpus (SEW) (Coster and Kauchak, 2011), which has been used in a range of statistical text simplification systems (Coster and Kauchak, 2011; Zhu et al., 2010; Woodsend and Lapata, 2011), is far bigger, but also noisier. We found fewer than 50 sentence pairs fitting our compres-sion criteria when exploring the possibility of gen-erating a similar training set for English from the SEW. However, in future work, other, smaller sim-plification corpora could be adapted to the task, providing insight into the robustness of using com-pression for simplification.
5.3 Implications for Evaluation Methodology
to recognize acceptable output, and it is typical of this type of setup that neither system-intrinsic scoring functions or as standard automatic evalu-ation procedures are reliably meeting this require-ment. In such cases it is common to obtain ex-pensive specialized human evaluations of the out-put. Our results are encouraging as they suggest that behavioral metrics like regressions and read-ing time that can be obtained from nave subjects simply reading system output may provide an af-fordable alternative.
5.4 Brokenness in NLP output
The experiments we have presented are targeting a problem specific to the field of computer manip-ulation of texts. In contrast to human-written text, language generation systems typically cannot fully guarantee that the text will be fluent and coherent in both syntax and semantics. Earlier research in readability has focused on how less-skilled read-ers, like children, dyslectic readers and second-language readers, interact with natural text, often in paragraphs or longer passages. It is important to determine to what extent the existing knowledge in these fields can be transferred to computational linguistics.
6 Conclusion
We have compared subjective evaluations and eye-movement data and shown that human simplifi-cations and automatic sentence compressions of newswire produce variations in eye movements.
We found that the main source of difficulty in processing machine-compressed text is ungram-maticality. Our results further show that both the human simplifications and the grammatical auto-matic sentence compressions in our data are easier to process than the original newswire text.
Regressions and reading speed were found to be good candidates for robust, transferrable measures that, with increasing access to eye-tracking tech-nology, are strong candidates for being directly in-corporated into language technologies.
We have shown that these measures can capture significant differences in skilled readers’ reading of single sentences across subjects and with eco-logically valid stimuli. In future research we wish to explore the possibility of predicting relevant reading behavior for providing feedback to NLP systems like automatic text simplification and sen-tence compression.
References
Marcelo Adriano Amancio, UK Sheffield, and Lucia Specia. 2014. An analysis of crowdsourced text simplifications. InProceedings of the 3rd Workshop on Predicting and Improving Text Readability for Target Reader Populations (PITR)@ EACL, pages 123–130.
Jørg Asmussen. 2001. Korpus 2000. Korpuslingvistik (NyS30).
Rebekah George Benjamin. 2012. Reconstructing readability: Recent developments and recommenda-tions in the analysis of text difficulty. Educational Psychology Review, 24(1):63–88.
Carl-Hugo Bjornsson. 1983. Readability of Newspa-pers in 11 Languages. Reading Research Quarterly, 18(4):480–497.
Philippe Blache, Stephane Rauzy. 2012. Robustness and processing difficulty models. a pilot study for eye-tracking data on the french treebank. In24th In-ternational Conference on Computational Linguis-tics, page 21.
Bernd Bohnet. 2010. Very high accuracy and fast de-pendency parsing is not a contradiction. In Proceed-ings of the 23rd International Conference on Com-putational Linguistics, pages 89–97. Association for Computational Linguistics.
William Coster and David Kauchak. 2011. Simple En-glish Wikipedia: a new text simplification task. In
Proceedings of the 49th Annual Meeting of the Asso-ciation for Computational Linguistics: Human Lan-guage Technologies: short papers-Volume 2, vol-ume 2, pages 665–669. Association for Computa-tional Linguistics.
Johan Falkenjack and Arne J¨onsson. 2014. Classify-ing easy-to-read texts without parsClassify-ing. In Proceed-ings of the 3rd Workshop on Predicting and Improv-ing Text Readability for Target Reader Populations (PITR)@ EACL, pages 114–122.
Lijun Feng, Martin Jansche, Matt Huenerfauth, and No´emie Elhadad. 2010. A comparison of features for automatic readability assessment. In Proceed-ings of the 23rd International Conference on Com-putational Linguistics: Posters, pages 276–284. As-sociation for Computational Linguistics.
Rudolph Flesch. 1948. A new readability yardstick.
Journal of applied psychology, 32(3):221.
Kenneth Holmqvist, Marcus Nystr¨om, Richard An-dersson, Richard Dewhurst, Halszka Jarodzka, and Joost Van de Weijer. 2011. Eye tracking: A com-prehensive guide to methods and measures.
Sigrid Klerke and Anders Søgaard. 2012. DSim , a Danish Parallel Corpus for Text Simplification. In
Kevin Knight and Daniel Marcu. 2000. Statistics-based summarization-step one: Sentence compres-sion. InAAAI/IAAI, pages 703–710.
Matthias T Kromann. 2003. The Danish Dependency Treebank and the DTAG treebank tool. In Proceed-ings of the Second Workshop on Treebanks and Lin-guistic Theories (TLT), page 217.
John Lafferty, Andrew McCallum, and Fernando CN Pereira. 2001. Conditional random fields: Prob-abilistic models for segmenting and labeling se-quence data.
Ryan McDonald. 2006. Discriminative sentence com-pression with soft syntactic evidence. InEACL.
Anneli Olsen. 2012. The tobii i-vt fixation filter.Tobii Technology.
Slav Petrov, Dipanjan Das, and Ryan McDonald. 2011. A universal part-of-speech tagset. Arxiv preprint ArXiv:1104.2086.
Keith Rayner, Kathryn H Chace, Timothy J Slattery, and Jane Ashby. 2006. Eye movements as reflec-tions of comprehension processes in reading. Scien-tific Studies of Reading, 10(3):241–255.
Keith Rayner, Alexander Pollatsek, and D Reisberg. 2013. Basic processes in reading. The Oxford Handbook of Cognitive Psychology, pages 442–461.
Sarah E Schwarm and Mari Ostendorf. 2005. Reading Level Assessment Using Support Vector Machines and Statistical Language Models. In Proceedings of the 43rd Annual Meeting of the ACL, pages 523– 530.
Advaith Siddharthan and Napoleon Katsos. 2012. Of-fline sentence processing measures for testing read-ability with users. InProceedings of the First Work-shop on Predicting and Improving Text Readability for target reader populations, pages 17–24. Associ-ation for ComputAssoci-ational Linguistics.
Sara Stymne, J¨org Tiedemann, Christian Hardmeier, and Joakim Nivre. 2013. Statistical machine trans-lation with readability constraints. InProceedings of the 19th Nordic Conference on Computational Lin-guistics (NODALIDA’13), pages 375–386.
Sowmya Vajjala and Detmar Meurers. 2014. Explor-ing measures of readability for spoken language: Analyzing linguistic features of subtitles to iden-tify age-specific tv programs. In Proceedings of the 3rd Workshop on Predicting and Improving Text Readability for Target Reader Populations (PITR)@ EACL, pages 21–29.
Kristian Woodsend and Mirella Lapata. 2011. Wik-iSimple: Automatic Simplification of Wikipedia Ar-ticles. In Twenty-Fifth AAAI Conference on Artifi-cial Intelligence.