Practical issues in developing semantic frameworks for the analysis of
verbal fluency data: A Norwegian data case study
Mark Rosenstein
a, Peter W. Foltz
a,b, Anja Vaskinn
c,dand Brita Elvevåg
e,fa Pearson, 4940 Pearl East Circle, Suite 200, Boulder, CO 80301 USA. [email protected],
b Institute of Cognitive Science, University of Colorado, Boulder, CO 80309 USA.
c Department of Psychology, University of Oslo, Oslo, Norway.
d NORMENT K.G. Jebsen Centre for Psychosis Research, Oslo University Hospital,
Oslo, Norway. [email protected]
e Psychiatry Research Group, Department of Clinical Medicine, University of Tromsø, Norway.
f Norwegian Centre for Integrated Care and Telemedicine (NST), University Hospital of North Norway,
Tromsø, Norway. [email protected]
Abstract
Background: Verbal fluency tasks, which re-quire producing as many words in response to a cue in a fixed time, are widely used within clinical neuropsychology and in neuropsycho-logical research. Although semantic word lists can be elicited, typically only the number of words related to the cue is interpreted thus ig-noring any structure in the word sequences. Automated language techniques can provide a much needed framework for extracting and charting useful semantic relations in healthy individuals and understanding how cortical disorders disrupt these knowledge structures and the retrieval of information from them.
Methods: One minute, animal category verbal fluency tests from 150 participants consisting of healthy individuals, patients with schizo-phrenia, and patients with bipolar disorder were transcribed. We discuss the issues in-volved in building and evaluating semantic frameworks and developing robust features to analyze this data. Specifically we investigate a Latent Semantic Analysis (LSA) semantic space to obtain semantic features, such as pairwise semantic similarity and clusters.
Results and Discussion: An in-depth analysis of the framework is presented, and then re-sults from two measures based on LSA se-mantic similarity illustrate how these automated techniques provide additional, clin-ically useful information beyond word list cardinality.
1
Introduction
Language disturbances, especially semantic defi-cits, constitute one of the hallmark features of se-vere mental illness such as schizophrenia. Reliably and robustly quantifying these deficits in ways that can support diagnosis, gauge illness severity, de-termine treatment effectiveness and provide inter-mediate phenotypes to help further unravel the underlying genetic components of the disease has until recently proven elusive. With the advent of large, corpus-based statistical models of language, it has become possible to investigate techniques that can automatically elucidate and operationalize the semantic structure of elicited language in ways that can further these clinical goals.
Underlying these automated language tech-niques is an attempt to quantitatively define measures of semantic similarity based on the anal-ysis of large sets of documents. Examples of these techniques include Latent Semantic Analysis (Fur-nas et al., 1988), Neural Networks and specifically Deep Learning (Hinton, 2006), Topic Models (Blei, Ng, & Jordan, 2003) and Independent Com-ponent Analysis (Hyvärinen, Karhunen, & Oja, 2004). Claims for these techniques include pro-gress toward text understanding (Zhang & LeCun, 2015), as a theory of meaning (Landauer, 2007), characterizing the temporal flow of topics in a large set of technical articles (Griffiths & Styvers,
2004), and a computational model of vocabulary acquisition (Biemiller et al., 2014).
In this paper, we focus on one of these tech-niques, Latent Semantic Analysis (LSA; Deerwest-er et al., 1990) and carefully examine the process of building an LSA semantic space and the result-ing issues that arise in applyresult-ing that space to gen-erate quantitative results for Norwegian verbal fluency test data. The paper provides an in-depth methodological analysis of the approach of apply-ing LSA in order to document the considerations for its effective use in semantic verbal fluency analysis. We provide a rationale for the use of two measures based on semantic similarity that indicate the potential of these automated techniques to pro-vide additional clinically useful information be-yond word list cardinality.
1.1
Latent Semantic Analysis
LSA generates semantic representations of words based on an analysis of a large corpus of domain relevant texts. Applying LSA begins when the cor-pus of texts is reduced to a term by document ma-trix. The columns of the matrix represent “documents”, semantically coherent segments of text (for example a paragraph, or a short encyclo-pedia article), across all the text in the corpus and the rows represent the union of the words that are
present in the corpus. The cell at the jth column, ith
row contains a count of the number of times the ith
word appears in the jth document. Various
en-hancements to this basic scheme, such as eliding common words (stop words) or applying weighting schemes for cells (see for instance Dumais, 1990) can be used to modify these counts, but for sim-plicity we will just call the contents of the cells counts. In Norwegian, compound words are con-catenated, so for instance water (“vann”) buffalo (“bøffel”) is written vannbøffel, which simplifies word tokenization for the Norwegian animal words.
A lower dimensional approximation to the term by document matrix is computed using Singular Value Decomposition (SVD) (for details see for instance Berry, Dumais, & O'Brien, 1995). This lower dimensional matrix, or semantic space, dis-tills the semantic relationships of words and con-texts, such that the vector representing a document is the sum of its constituent word vectors. The la-tent semantic structure emerges from the
dimen-sion reduction, where semantic similarity between words or documents is computed by taking the co-sine between vectors representing the words or the documents. This similarity has been exploited in numerous practical applications, such as infor-mation retrieval (Berry & Browne, 2005), essay scoring (Foltz, Laham, & Landauer, 1999) and bio-informatics (for example Homayouni et al., 2005).
LSA has been employed to chart how core cog-nitive processes are affected by illnesses that dis-turb cortical function. These include categorizing incoherence in speech during a fairy tale retelling task to distinguish patients with schizophrenia from controls (Elvevåg et al., 2007), as a more in-formative scoring mechanism for the Wechsler Logical Memory test (a story retelling task) (Dunn et al., 2002; Rosenstein et al., 2014), to distinguish language differences between healthy individuals and individuals with risk of psychosis (Elvevåg et
al., 2010; Rosenstein et al., in press) and its use
was suggested as an early indicator of Alzheimer’s disease derived from analysis of a writer’s oeuvre (Garrard et al., 2005). In all of these examples, a substantial amount (a paragraph or larger) of se-mantically related text was elicited and used in the analysis. Though it is more difficult to obtain se-mantic measures with shorter quantities of text, in his dissertation Koehn (2003) used LSA to study the degradation of semantic memory in Alz-heimer’s patients using word lists from verbal flu-ency tests.
1.2
Verbal Fluency Tests
rubric typically only requires a count of the correct words produced.
As our concern is with underlying changes in semantics, we limit our investigation to the seman-tic fluency task. Given that parseman-ticipants are not in-structed in any way on the manner in which they
should retrieve the words, a priori it may be
sur-prising that a tantalizing structure runs through the thread of words from the semantic task. Bousfield and Sedgewick (1944) were the first to report on temporal patterns in participant recall, where recall occurred in fits and starts with the rate of new words decreasing over time, and Bousfield (1953) noted that participants tended to recall groups of semantically similar words. Wixted and Rohrer (1994) provide a review of the research into the structure derived from the timing literature. Based on earlier work in memory search and clustering, such as Pollio (1964), Troyer et al. (1997) posited semantic clustering and switching as two important additional features that could be extracted from word lists produced in the semantic verbal fluency tests.
An obvious difficulty of attempting to reach deeper into the structure of word lists is maintain-ing objectivity and reliability in detectmaintain-ing these clusters. Beyond the deep philosophical issues of whether to include a dog used in hunting birds (“fuglehund”, variously in English a bird dog, pointing dog, or hunting dog) in a cluster contain-ing birds, there is a strong reliability issue in defin-ing cluster boundaries. The appendix of Troyer et al. (1997) defines a set of semantic categories for animals. The difficulty for any fixed list is that the distribution of word frequencies is such that there are many infrequent words (Zipf, 1935) ensuring that it is difficult to obtain comprehensive lists, and even if a partial list is produced the potential binations that could constitute clusters grows com-binatorially.
Pakhomov, Hemmy and Lim (2012), attempted to overcome these concerns by using a lexical da-tabase, WordNet (Miller, 1995), a curated word collection that captures hierarchical relations among words for automated analysis of verbal flu-ency tasks in cognitive decline. Pakhomov and Hemmy (2014) applied LSA to measure cognitive decline in data from the Nun Study, where they proposed using LSA to provide an automated, con-sistent, generalized measure of cluster boundaries and switching. This contrasts somewhat with
Koehn (2003), where the LSA measure was de-rived from the overall semantic similarity of the word list, and with Nicodemus et al. (2014), where a number of LSA measures were proposed to de-rive quantitative measures over semantic fluency data in a candidate gene study for schizophrenia. Instead of attempting to define and detect clusters, the measures discussed in Nicodemus et al. (2014) examined the overall coherence (the semantic simi-larity of all pairs of words in each word list), and coherence in moving windows of fixed word length (sets of 1-3 words). We build on these ap-plications of LSA to verbal fluency data and report on constructing a semantic space for an animal semantic fluency test in Norwegian. We visualize the resulting semantic relations and temporal paths in an effort to understand how better to detect se-mantic coherence and clusters, and derive useful semantic features.
2
Methods
2.1
Oslo Verbal Fluency Study
[image:3.612.318.515.476.619.2]Verbal fluency data from 150 participants (50 healthy participants, 75 diagnosed with bipolar disorder and 25 diagnosed with schizophrenia; na-tive Norwegian speakers recruited in the Oslo area) who gave informed consent was analyzed. The participants were asked to generate as many animal words in one minute as possible. The audio data was transcribed. Figure 1 shows a histogram of the list lengths.
Figure 1: Distribution of word list lengths.
one repeated word, though no word was repeated more than once by any participant. Nonadjacent perseverations (repeated words) were retained, though non-animal words were discarded, resulting in a total of 3148 words distributed over 269 unique animal words. The mean number of words per participant was 20.97 (5.83), with range from 4
to 38. Table 1 shows the distribution of repeated
words by number of participants.
Number of repeated words 1 2 3 4
Number of participants 41 13 2 1
Table 1. Occurrences of perservations in word lists.
Keeping perservations was one aspect of our overall goal to preserve the original intent of the participants as much as practically possible. Over-all, we would prefer the semantic space automati-cally normalize meanings. Participants used different word forms such as “koala” and “koa-labjørn” to refer to the same animal. We did not perform lemmatization, and specifically kept both singular and plural forms. The only occasion where we did intervene was when the transcription pro-cess added variability due to spelling variants, where we selected the most frequent form. In other cases we preserved the variability except where a form was poorly represented in the corpus, and then the more frequent form was used. All tran-scripts were checked and corrected for typograph-ical errors. By retaining these differences, the spread of nearly similar meanings can be exploited in the process of determining thresholds for cluster boundaries. Specific modifications of the word lists are discussed as part of developing the seman-tic space.
2.2
Building the Semantic Space
A semantic space is most effective when it is built from a corpus that captures a wide range of natu-rally occurring contexts, which produces a space with a robust exposure to the category (e.g. Lan-dauer et al., 1998). Pakhomov and Hemmy (2014) built a space based on Wikipedia articles. We chose a different route due to both the limited ani-mal articles in the Norwegian language version of Wikipedia and also the assumption that a more general source would provide more contexts to build semantic relationships than the encyclopedia model of Wikipedia.
We selected articles from the Norwegian News-paper Corpus (Norsk aviskorpus), version 0.9 http://www.nb.no/sbfil/tekst/norsk_aviskorpus.zip, which is a component of text resources made available by the National Library of Norway,
http://www.nb.no/English/Collection-and- Services/Spraakbanken/Available-resources/Text-Resources.
The newspaper corpus consists of approximately 3.7 million articles, of which we used a subset of 3.6 million articles, excluding approximately
100,000 that were explicitly tagged as “Nynorsk”1.
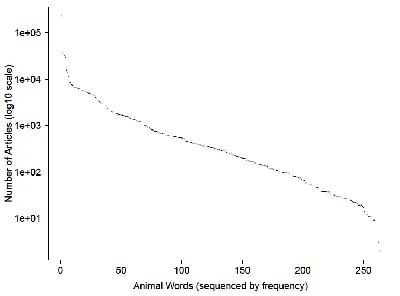
There were 269 unique animal words generated in the verbal fluency study. Of these words, two: “gråmeis” and “svintoks” were not contained in any articles and were removed from the word lists. Two additional words “gjerv” and “papegøje” did not appear in the corpus, but alternative spellings “jerv” and “papegøye” were substituted in the word lists. Two other words “måse” and “panda-bjørn” had very few representations in the articles, but alternative spellings “måke" and “panda” were well represented, so these substitutions were made. These substitutions resulted in 263 unique animal words for the study. Approximately 620,000 news-paper articles contained one or more occurrences of those 263 animals. Figure 2 shows the frequen-cy of articles containing the words, with the y-axis on a log10 scale. The most frequent word is “ørn” (eagle), due to a popular football team of that name, the next most frequent is “and” (duck), due
to contamination from the English connective2, and
the next three are “fisk” (fish), “menneske” (hu-man) and “laks” (salmon). Excluding the tails, the plot is quite linear throughout its range.
For animals appearing in 200 or more articles, a random sample of 200 articles for each animal was added to the space, while for the 114 animals with 200 or fewer articles all the relevant articles were used. Duplicate articles were removed and each article constituted a document for the LSA
1 There are two versions of the Norwegian language –
“Bok-mål” and “Nynorsk”. Although “Bok“Bok-mål” is used by the ma-jority in both written and spoken language, they are of equal standing. “Bokmål” is used in the Oslo area where our data was collected, hence our exclusion of the “Nynorsk” articles.
2 We have experimented using the text categorization
sis. The final space has 286,371 terms and 36,516 articles.
Figure 2. Number of articles per animal word.
We selected 300 dimensions for the reduced dimension space based on experience with other semantic spaces and the observation that usually there is a range of dimensions with approximately similar performance. Often the number of dimen-sions is chosen to optimize some external perfor-mance measure (e.g. Turney & Littman, 2003) and in future work our intention is to explore the choice of dimension. All cosine similarity compar-isons were derived from vectors in this 300 dimen-sion space. About half the terms are dates and times, not of much semantic value, but we tend to be conservative in tokenization, so preserve terms such as “Øst-Afrika” (East Africa) and “øko-maten” (eco-food), which increases the term count. With the semantic space in place, we performed a set of validations of the semantic relationships. Table 2 shows the cosine similarity for singular vs. plural forms and for variant spellings (the last four rows) that were produced by the participants and transcribers. The columns include the counts in the newspaper articles (news cnt) and among the par-ticipants (part cnt). Table S1 in the Supplemental Materials contains an English/Norwegian transla-tion for the 263 animals. Notice that plural forms are relatively uncommon among participants rela-tive to the frequencies found in the newspaper arti-cles. Most of the plurals have relatively high cosine to their singular form. The variant spellings of the participants follow the newspaper frequen-cies, except in the case of “tarantella”. Of the vari-ant spellings, only the “ponni/ponny” pair has high cosine similarity, so the other variants were
con-verted to the most frequent newspaper form. From the cosine similarities between the singular and plural forms, we expect that a cluster threshold will likely be at or below 0.3, if we want to keep those forms clustered.
sing. plural
sing news cnt
plur news
cnt sing part cnt
plur part
cnt cos( sing. plur.) fisk fisker 32321 7239 36 3 0.582 fugl fugler 7546 6738 48 1 0.815 geit geiter 1107 1224 53 2 0.522 gris griser 4630 3122 54 1 0.351 høne høner 746 1209 32 2 0.649 insekt insekter 396 1627 2 1 0.614 katt katter 5510 4075 132 1 0.740 ku kyr 3351 3088 87 1 0.571 reke reker 395 2942 3 1 0.332 rotte rotter 686 5088 53 1 0.395 var. 1 var. 2 giraff sjiraff 118 303 1 111 0.246 lemen lemmen 371 150 5 1 0.003 ponni ponny 194 28 2 1 0.742
taran-tell
[image:5.612.312.533.140.416.2]
tarantel-la 341 77 1 3 -0.012
Table 2. Singular and plural forms (top) and spelling variants (bottom 4 rows).
There are a number of additional ways to vali-date the overall semantic relationships in the space. Figure 3 shows the distribution of cosines taken between all pairs of animal words. The median of this distribution is essentially zero, though due to the long right tail the mean is 0.022 (.117). Of the 34,453 word pairs, only 1098 have a cosine greater than 0.3 and 2174 have a cosine greater than 0.2, so most animals have low similarity.
Another approach is to use hierarchical cluster-ing on the cosine distance matrix among the ani-mals to see one representation of the imposed relationships. We used hierarchical clustering from the statistical programming environment R (R Core Team, 2014).
sub-trees with categories, and smaller scale effects can be seen within categories, for instance in barnyard animals, subtrees of horses, hens and livestock naturally arise. Like any projection, hierarchical clustering reveals some relationships, while others require a different projection to be revealed. Using LSA to measure semantic similarity is equivalent to allowing the relationships that emerge from the corpus to constrain semantic similarity. The only free parameter is the cosine similarity threshold to define a cluster3.
Figure 3. Distribution of animal pair cosines.
2.3
Analysis of Fluency Data
While it is informative to examine the relation-ships across all the animals, our particular interest is in the sets of animals generated by each partici-pant both in terms of the choices of animals, and the structure of the order of those choices. Figure 4 shows the distribution of cosines for all the word pairs (reiterating Figure 3 but as a density plot), as well as just the sequential pairs in the word lists of participants. While there are still a majority of un-related pairs, the participants clearly have more structure and higher cosines with a median 0.08 and 25% of the pairs having a cosine exceeding 0.24. So, as expected, there is substantial structure here.
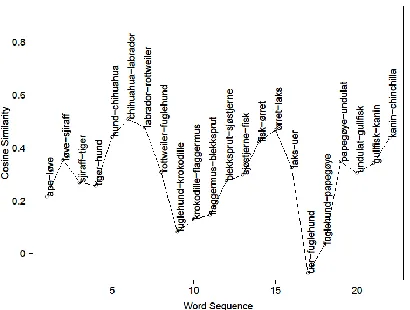
Figures 5 and 6 show the cosine time paths from two participants. The x-axis is the word sequence, and the y-axis is the cosine similarity between each sequential pair of words. The word pair is plotted vertically next to the cosine point. Table S1 in the
3 The selection of number of dimensions for the space is also a
free parameter, but much less directly related to cluster size than this threshold.
supplemental materials contains both English and Norwegian forms of the 263 animal words. Both figures indicate that as the threshold for defining a cluster is lowered the size of clusters will increase, while increasing will cause an increase in number of clusters (in the limit each word will be its own cluster).
Figure 4. Distribution of all animal pair cosines vs. pairs limited to participants.
In Figure 5, we see potentially 4 clusters. The first peak might be called Africa, the second dogs, the third fish and the last pets. Where the bounda-ries are located and cluster membership depends on the cosine threshold. We note that the “fugle-hund” (bird dog) does cluster with dogs, but not with the bird “papegøye” (parrot), and the overall bird similarity is quite low in this sequence.
Figure 5. Time path of cosine similarities with word pairs (example 1).
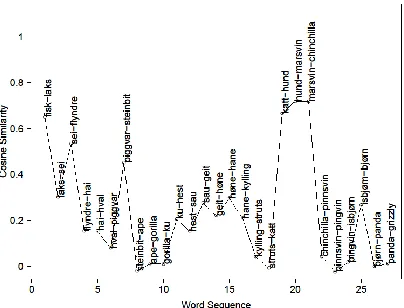
[image:6.612.89.283.214.363.2]“hval” (whale) and a return to fish in the next peak. In addition there is a long low peak of barnyard animals, followed by a pet peak and a small bear peak. How the threshold is set in conjunction with the semantic similarity of the space will greatly influence the shape of clusters.
Figure 6. Time path of cosine similarities with word pairs (example 2).
These examples illustrate that clusters may have a good deal of variability, since they can be de-pendent on single words to delimit the cluster. This implies that distortions of the words “and” and “ørn” due to non-animal meanings and words ab-sent from the corpus such as “gråmeis” and “svintoks” may have disproportionate effects. In-vestigating measures that are more robust to small changes in single words seems a profitable direc-tion. A measure less affected by single word varia-bility is the area under the temporal curve, which if divided by the number of words is just the mean of the cosine pairs.
Figures 5 and 6 indicate that it would be useful to better understand the relationship between threshold and number of clusters over the partici-pants’ data. Figure 7 shows the tradeoff in terms of number of clusters as the threshold for cluster boundary is increased. We see a rapid growth and then a leveling off toward the asymptote. The curve drawn in the figure is a locally weighted re-gression (Loader, 2013) to help visualize the rela-tionship. Following Pollio (1964) the vertical line is at the 75th percentile of the cosine distribution, and is our first pass at a threshold, though further experimentation is necessary to better understand how to set this value.
Figure 7. Change in number of clusters as cosine threshold increases.
2.4
Continuous Space Word
Representa-tion
To validate this approach, we built a semantic space based on a second automated technique, con-tinuous space word representations (Mikolov, Yih, & Zweig, 2013) with the exact same corpus as the LSA space, utilizing bag-of-words and 300
dimen-sions, using the word2vec4 software. We chose this
representation since it belongs to the family of sta-tistical vector space representations which use co-sine similarity to measure semantic closeness. The mean cosine and cosines using word pairs from the participants were both higher than for the LSA space and well above the mean for 1000 randomly chosen word pairs (mean all animal pairs=0.114 (0.100), for participants=0.275 (0.137), random pairs=0.040 (0.078)).
Figure 8 reprises the first example word list shown for LSA-based semantics in Figure 5, but now using cosine similarity from the new space. The main feature of four peaks remains, but there are differences such as now instead of increasing similarity with on the right (pets), the plot levels off.
To further compare the semantic spaces, we took the correlation between all 263 animal pairs in the two spaces and the subset of pairs generated by the participants. For all pairs the correlation was 0.505 and for the participant pairs the correlation was 0.727, with 95% confidence interval (0.709,
[image:7.612.90.292.152.306.2]
0.743). This is a quite interesting result in that pairs humans generate have higher similarity, but also that both models capture more similar seman-tic patterns over the human generated pairs. This result increases our confidence that these models are capturing critical aspects of human semantic organization.
Figure 8. Time path of cosine similarities using contin-uous space model with word pairs (example 1).
2.5
Differences in Diagnostic Groups
The primary purpose of developing this seman-tic framework is to provide the basis for much needed tools to measure how semantic structures are affected by cortical disorders. Utilizing the LSA space and threshold from Section 2.3, we can now begin that process. We compute three measures on the data, the mean number of words per diagnostic group, the mean cosine, and a clus-ter measure, the clusclus-ter fraction which is the num-ber of clusters divided by the numnum-ber of words. Since the number of clusters is limited by the number of words, we need a measure that factors out the number of words, and dividing by the num-ber of words is a way to achieve that aim. Table 3 shows the three measures and their standard devia-tions, as well as the number of participants for the three groups, control (CNTL), bipolar disorder (BD) and schizophrenia (SZ).
All three measures are significantly different among the groups: number of words (F[2,147] = 13.117, p = 5.73e-6), mean cosine (F[2,147] = 3.398, p = .036), and cluster fraction (F[2,147] = 3.190, p = 0.044). The two new semantic features are only moderately correlated to number of words, mean cos, cor = 0.301 and cluster fraction, cor =
-0.254, indicating both provide additional infor-mation beyond the number of words. The control group results are consistent with normative word count results reported by Egeland et al. (2006), where in their Table 5 they report a mean animal word list length of 23.5 (5.7) for 201 participants. Unfortunately, they did not separately report ani-mal counts for their groups with schizophrenia or depression.
Group n num words mean cos cluster frac CNTL 50 23.92(4.750) 0.172(0.0597) 0.736(0.0994) BD 75 20.12(5.273) 0.151(0.0589) 0.778(0.103) SZ 25 17.64(6.867) 0.137(0.0572) 0.794(0.131)
Table 3. Mean(sd) semantic features by group.
The direction of change is consistent among the three measures, number of words decreases from control to bipolar disease to schizophrenia, seman-tic coherence between pairs of words also drops in that order, and cluster fraction, which increases as pairwise semantic coherence decreases moves in the expected opposite direction to the other two measures.
3
Discussion
The aim of this paper is to illustrate a semantic framework that can provide tools for measuring how semantic structure is affected by cortical dis-orders. The approach illustrates that effective se-mantic representations can be developed through automated language models such as LSA. While it is possible to treat automated language models as black boxes, we have attempted to show that there are many ways these spaces can be probed to en-sure that they provide useful semantic relations that correspond to human results and provide po-tentially clinically useful applications.
ap-proach can help reduce variability due to human judgements, making it easier to detect important patterns in the data. Individual differences will continue to make it difficult to detect diagnostic group differences, but by having multiple classes of semantic features we improve the chances of capturing those group differences. Our next steps are to use this knowledge to continue to build ro-bust semantic features and attempt to operational-ize those features with fluency data as well as with other tasks. The overall framework provides a means to continue work to better understand how to use semantics to build robust features, and apply it to data.
Acknowledgments
We wish to thank Kjetil Sundet, Carmen Simonsen and Ole A. Andreassen from the NORMENT KG Jebsen Centre for Psychosis Research at Oslo Uni-versity Hospital in Norway for recruitment and neuropsychological assessment of participants. This research was supported in part by the North-ern Norwegian Regional Health Authority, Helse Nord RHF. Brita Elvevåg was also funded by the Northern Norwegian Regional Health Authority. Peter Foltz and Mark Rosenstein are employees of Pearson, which partially supported their work as part of their employment. The funders had no role in study design, data collection and analysis, deci-sion to publish, or preparation of the manuscript.
References
Michael W. Berry, & Murray Browne. (2005). Under-standing Search Engines: Mathematical Modeling and Text Retrieval. Philadelphia, PA: SIAM Press. Michael W. Berry, Susan T. Dumais, & G. W. O'Brien.
(1995). Using linear algebra for intelligent infor-mation retrieval. SIAM review, 37(4), 573-595. Andrew Biemiller, Mark Rosenstein, Randall. Sparks,
Thomas K Landauer, & Peter W. Foltz. (2014). Models of vocabulary acquisition: Direct tests and text-derived simulations of vocabulary growth. Sci-entific Studies of Reading, 18(2), 130-154.
David M. Blei, Andrew Y. Ng, & Michael I. Jordan. (2003). Latent dirichlet allocation. The Journal of Machine Learning Research, 3, 993-1022.
W. A. Bousfield. (1953). The occurrence of clustering in the recall of randomly arranged associates. The Journal of General Psychology, 49(2), 229-240. W. A. Bousfield, & H. W. Sedgewick. (1944). An
anal-ysis of sequences of restricted associative responses.
Journal of General Psychology, 30, 149-165.
William B. Cavnar, & John M. Trenkle. (1994). N-Gram-Based Text Categorization. Proceedings of SDAIR-94, 3rd Annual Symposium on Document Analysis and Information Retrieval, 161–175. Scott C. Deerwester, Susan T. Dumais, George W.
Fur-nas, Thomas K Landauer, & Richard A. Harshman. (1990). Indexing by latent semantic analysis. JAsIs, 41(6), 391-407.
Susan T. Dumais. (1990). Enhancing performance in latent semantic (LSI) indexing. Behavior Research Methods, Instruments and Computers, 23(2), 229– 236.
John C. Dunn, Osvaldo P. Almeida, Lee Barclay, Anna Waterreus, & Leon Flicker. (2002). Latent semantic analysis: A new method to measure prose recall.
Journal of Clinical and Experimental Neuropsychol-ogy, 24(1), 26-35.
Jens Egeland, Nils I. Landrø, Evelin Tjemsland, & Kjer-sti Walbækken. (2006). Norwegian norms and factor-structure of phonemic and semantic word list genera-tion. The Clinical Neuropsychologist, 20(4), 716-728. Brita Elvevåg, Peter W. Foltz, Daniel R. Weinberger, & Terry E. Goldberg. (2007). Quantifying incoherence in speech: An automated methodology and novel ap-plication to schizophrenia. Schizophrenia Research, 93, 304-316.
Brita Elvevåg, Peter W. Foltz, Mark Rosenstein, & Lynn E. DeLisi. (2010). An automated method to an-alyze language use in patients with schizophrenia and their first-degree relatives. Journal of Neurolinguis-tics, 23(3), 270-284.
Peter W. Foltz, Darrell Laham, & Thomas K Landauer. (1999). Automated essay scoring: Applications to educational technology. World Conference on Edu-cational Multimedia, Hypermedia and Telecommuni-cations. (1999), 1, 939-944.
George W. Furnas, Scott Deerwester, Susan T. Dumais, Thomas K Landauer, Richard A. Harshman, Lynn A. Streeter, & Karen E. Lochbaum. (1988). Information retrieval using a singular value decomposition model of latent semantic structure. Proceedings of the 11th annual international ACM SIGIR conference on Re-search and development in information retrieval, 465-480. ACM.
Peter Garrard, Lisa M. Maloney, John R. Hodges, & Karalyn Patterson. (2005). The effects of very early Alzheimer's disease on the characteristics of writing by a renowned author. Brain, 128(2), 250-260. Thomas L. Griffiths, & Mark Steyvers. (2004). Finding
scientific topics. Proceedings of the National Acade-my of Sciences, 101(suppl 1), 5228-5235.
Geoffrey Hinton, Simon Osindero, & Yee W. Teh. (2006). A fast learning algorithm for deep belief nets.
Neural Computation, 18(7), 1527-1554.
semantic indexing of MEDLINE abstracts. Bioinfor-matics, 21(1), 104-115.
Aapo Hyvärinen, Juha Karhunen, & Erkki Oja. (2004).
Independent component analysis. New York: John Wiley & Sons.
Henry C. Koehn. (2003). Latent semantic analysis of Alzheimer's disease patients' speech as an indicator of semantic network integrity. Dissertation Abstracts International, 65-09, Section: B, 4891.
Thomas K Landauer. (2007). LSA as a theory of mean-ing. In Landauer, T. K, McNamara, D. S., Dennis, S., & Kintsch, W. (Eds.). Handbook of Latent Semantic Analysis. (3-34). Mahway, NJ: Lawrence Erlbaum Associates.
Thomas K. Landauer, Peter W. Foltz, & Darrell Laham. (1998). Introduction to Latent Semantic Analysis.
Discourse Processes, 25, 259-284.
Catherine Loader. (2013). locfit: Local Regression, Likelihood and Density Estimation. R package
ver-sion 1.5-9.1.
http://CRAN.R-project.org/package=locfit.
Tomas Mikolov, Wen-tau Yih, & Geoffrey Zweig. (2013). Linguistic Regularities in Continuous Space Word Representations. HLT-NAACL, 746-751. George A. Miller. (1995). WordNet: a lexical database
for English. Communications of the ACM, 38(11), 39-41.
Kristin K. Nicodemus, Brita Elvevåg, Peter W. Foltz, Mark Rosenstein, Catherine Diaz-Asper, & Daniel R. Weinberger. (2014). Category fluency, latent seman-tic analysis and schizophrenia: a candidate gene ap-proach. Cortex, 55, 182-191.
Serguei V. Pakhomov, Laura S. Hemmy, & Kelvin O. Lim. (2012). Automated semantic indices related to cognitive function and rate of cognitive decline. Neu-ropsychologia, 50(9), 2165-2175.
Serguei V. Pakhomov, & Laura S. Hemmy. (2014). A computational linguistic measure of clustering behav-ior on semantic verbal fluency task predicts risk of future dementia in the Nun Study. Cortex, 55, 97-106.
Howard R. Pollio. (1964). Composition of associative clusters. Journal of Experimental Psychology, 67(3), 199.
R Core Team (2014). R: A language and environment for statistical computing. R Foundation for Statistical Computing, Vienna, Austria. URL http://www.R-project.org/.
Mark Rosenstein, Catherine Diaz-Asper, Peter W. Foltz, & Brita Elvevåg. (2014). A computational language approach to modeling prose recall in schizophrenia.
Cortex, 55, 148-166.
Mark Rosenstein, Peter W. Foltz, Lynn E. DeLisi, & Brita Elvevåg. (in press). Language as a biomarker in those at high-risk for psychosis. Schizophrenia Re-search.
Angela K. Troyer, Morris Moscovitch, & Gordon Winocur. (1997). Clustering and switching as two components of verbal fluency: evidence from young-er and oldyoung-er healthy adults. Neuropsychology, 11(1), 138.
Peter D. Turney, & Michael L. Littman.(2003). Measur-ing praise and criticism: inference of semantic orien-tation from association. ACM Transactions on Information Systems (TOIS), 21(4), 315-346. John T. Wixted, & Doug Rohrer. (1994). Analyzing the
dynamics of free recall: An integrative review of the empirical literature. Psychonomic Bulletin & Review, 1(1), 89-106.
Xiang Zhang, & Yann LeCun. (2015). Text understand-ing from scratch. arXiv:1502.01710v1.