8 Retirement and Labour Market Participation 3 Older People as Members of their Families and Communities
8
Retirement And Labour
Market Participation
Irene Mosca and Alan Barrett
Contents
8.1 Introduction 220
8.2 Labour market status of older
adults in Ireland: an overview 221
8.3 Determinants of labour market status of
men and women aged 50 to 64 223
8.3.1 Employment and health 223
8.3.2 Employment and education 224
8.3.3 Employment and wealth 225
8.3.4 Employment and life satisfaction 226
8.4 Labour market status of men and
women aged 65 to 74 228
8.5 Working conditions of employees
aged 50 and above 230
8.5.1 Workplace discrimination 230
8.5.2 Hours at work and wind-down 230
8.5.3 Expected retirement age 231
8.5.4 Pension coverage 233
The Irish Longitudinal Study on Ageing
Retirement And Labour
Market Participation
8
Key findings
• Among those aged 50 to 64, 62% of men and 46% of women are at work compared to 16% of men and 8% of women aged 65 to 74.
• Of men aged 65 to 74, 82% describe themselves as retired, compared to 52% of women. However, 36% of women aged 65 to 74 report that they are ‘looking after home or family’.
• For those below the State Pension Age:
• Labour supply of older adults aged 50 to 64 in Ireland is concentrated amongst the healthiest, most educated, wealthiest and most satisfied with life.
• For example, 53% of men and 28% of women with primary or no education are employed, compared to 70% of men and 62% of women with tertiary or higher education.
• In the poorest quartile of this population, 34% of women and 38% of men are at work compared to 59% of women and 71% of men in the richest quartile.
• The average number of hours worked decreases as workers move closer to age 65, suggesting some form of ‘wind-down’ in advance of retirement. • Around 25% of male and female employees expect to retire before state
pension age (65). Retirement expectations are different for different
education groups, with the more highly educated expecting to retire earlier. • Of female employees, 41% are not covered by an occupational, PRSA
(Personal Retirement Savings Account) or private pension scheme compared to 20% of male employees.
• Pension coverage varies by group. Among higher professionals, 78% are covered by an occupational pension, compared to 32% of unskilled workers. • Of those currently at work, 96% of women and 98% of men report that they
are not affected by any kind of workplace discrimination.
8.1 Introduction
1 At a time of recession, it might be argued that the demand for labour is below supply and so additional supply, through higher participation, will not lead to an increase in output. While there might be some truth in this argument, the argument here applies over the longer term during which time periods of excess labour demand may also apply.
the level of the macroeconomy, higher levels of participation among older people
translate into a bigger labour force and so increased output1. If higher participation
is combined with the later payment of pensions, reductions in pensions can be achieved. Increasing the labour market participation of older people is increasingly viewed as a prerequisite for tackling the long-run costs associated with population ageing and this policy objective is reflected in the National Pensions Framework (1). Given this context, it is important to understand the patterns and determinants of labour market participation among those aged 50 and over in Ireland.
This chapter examines the issue of labour market participation from a number of perspectives. Section 8.2 provides a general overview of the labour market status of individuals aged 50 to 64 and aged 65 to 74 in Ireland. The extent to which patterns of employment of men and women aged 50 to 64 and 65 to 74 vary with health, education, wealth and life satisfaction is explored in detail in Sections 8.3 and 8.4. Section 8.5 explores the working conditions for older people in Ireland. Among the issues investigated are workplace discrimination, the pattern of hours worked by age, expectations regarding retirement age and pension coverage. Section 8.6 provides some conclusions.
8.2 Labour market status of older adults in Ireland: an overview
Self-reported labour market status reflects individuals’ perceptions about their role in the labour market. TILDA respondents are asked to choose the status that best describes their current situation, including: retired; employed (including unpaid work in family business, temporarily away from work, or participating in
an apprenticeship or an employment programme such as Community Employment); self-employed; unemployed; permanently sick or disabled; looking after home or family; in education or training; and other. If they answer “other”, they are asked to specify their status in more details. Most respondents answering “other” do not see themselves as falling in one single category. For example, they are working for a few hours per week, are not in good health but do not see themselves as permanently sick or disabled and are caring for a family member.
Table 8.1 shows that the distribution of men and women in: employment, retirement, looking after family or home, and falling into the other category varies significantly by sex and age group. For the purpose of this analysis, the other category includes those who regard themselves as being unemployed, permanently sick or disabled, in education and training and other. (For a more detailed breakdown, see Table A8.1).
The Irish Longitudinal Study on Ageing
(SHARE), which show that the employment rate for men aged between 50 and 65 is 62% compared to 43% for women for the ten European countries studied (2).
As expected, the proportion of men and women at work decreases significantly with age. Between the ages of 65 and 74, 16% of men and 8% of women are in employment, while 82% of men and 52% of women report themselves as retired. Another 36% of women aged 65 to 74 are looking after home or family, while men almost never describe themselves as such. The vastly different proportions of men and women who report being retired most likely reflects a difference in perception of retirement as opposed to a substantive difference across the sexes.
[image:4.595.104.539.313.663.2]Among men aged 75 and over, 11% are still employed, with farmers making up most of this group (84%).
Table 8.1: Labour market status by sex and age group
Employed Retired Looking after family/home Other
Total Number in sample % 95% CI % 95% CI % 95% CI % 95% CI
Male
50-64 62 (60-65) 14 (12-15) 1 (1-2) 23 (21-25) 100 2081
65-74 16 (14-19) 82 (79-84) 0 (0-1) 2 (1-3) 100 1070
>=75 11 (8-14) 87 (84-90) 0 (0-1) 2 (1-3) 100 598
Total 44 (42-45) 41 (39-43) 1 (1-1) 15 (13-16) 100 3749
Female 50-64 46 (44-49) 11 (10-13) 27 (25-29) 16 (14-17) 100 2587
65-74 8 (7-10) 52 (49-56) 36 (32-39) 4 (3-5) 100 1093
>=75 1 (1-2) 55 (50-59) 40 (35-44) 4 (3-6) 100 749
Total 28 (27-30) 30 (28-32) 31 (29-33) 10 (9-12) 100 4429
Total 50-64 54 (53-56) 12 (11-14) 14 (13-15) 19 (18-21) 100 4668
65-74 12 (10-14) 67 (64-69) 18 (17-20) 3 (2-4) 100 2163
>=75 5 (4-7) 68 (64-71) 24 (21-27) 3 (2-4) 100 1347
Total 36 (34-37) 35 (34-37) 17 (16-18) 12 (12-13) 100 8178
8.3 Determinants of labour market status of men and women
aged 50 to 64
Table 8.1 showed that 62% of men and 46% of women aged 50 to 64 are currently at work. Self-employment is more common among men (41% of those at work) than women (12%, see section 8.5.2). The drivers of employment at older ages are complex. Previous studies have suggested that determinants of employment of older people include: mental and physical health; level of education; wage opportunities; type of employment; overall wealth; financial incentives in both public and private pension schemes; preferences for work; job satisfaction; and family responsibilities or arrangements. The extent to which employment status is associated with health, education, wealth and life satisfaction in those aged 50-64 is described below.
8.3.1 Employment and health
Health strongly affects an individual’s ability and willingness to work at older ages. Several international studies have shown that there is a strong positive association between health and employment (3,4). The 2004 wave of SHARE has shown that the employment rate of European individuals aged 50 and above is much lower for people who report having a disease or severe restrictions in activities of daily living or perceiving themselves to have poor health (2,5). Also, results from the 2002 wave of the ELSA survey have shown that self-reported employment status is lower for individuals in poorer health. For example, English men before State Pension Age (SPA) who report being in excellent, very good or good health are between 35 and 40 percentage points more likely to be active than those who are in fair or poor health (6, p.130).
TILDA respondents are asked to rate their health on a five-point scale (excellent, very good, good, fair, poor). For the purpose of this analysis, three groups are identified: (a) those claiming to be in excellent, very good or good health; and (b) those
reporting fair health; and (c) those claiming to be in poor health.
The Irish Longitudinal Study on Ageing
Figure 8.1: Proportion of the population aged 50-64 at work by self-rated health status and sex
8.3.2 Employment and education
Previous studies suggest that there is a positive association between education and employment. For example, Kakwij and Vermeulen (7) used the first wave of SHARE data and found that all other things being equal, the higher the level of education an individual has, the higher is the probability of labour market participation.
Avendano, Jürges, and Mackenbach (8) used Wave 1 and 2 of SHARE and found that low educational attainment is associated with a lower probability of being employed in all European regions. Haider and Loughran (9) used the 1991-1999 waves of the Current Population Survey and the 1998 wave of the HRS survey to investigate the labour market status of Americans aged 50 and above. They found that labour force participation is higher at higher levels of education at all ages, ranging from 23% for dropouts to 62% for those with more than a college level education (p. 10).
In TILDA, education is measured by the highest level of formal education achieved. Irish-specific levels are reclassified into three categories: primary/none (not complete or primary or equivalent), secondary (intermediate/junior/group certificate or
equivalent and leaving certificate or equivalent) and third/higher (diploma/ certificate, primary degree and postgraduate/higher degree).
Figure 8.2 shows that a clear education gradient exists: more educated respondents are more likely to be in employment between the ages of 50 and 64, and the
0 20 40 60 80
Exc./V.good/Good Fair Poor Exc./V.good/Good Fair Poor
Male Female
strength of the association appears particularly strong for women. Looking at men first, the proportion who are employed rises from 53% for those with primary education to 65% for those with secondary education and to 70% for the third level group. For women, this employment-education gradient starts at 28%, increases to 47% for those with second level education and then increases to 62% for those with third level education.
8.3.3 Employment and wealth
The association between wealth and labour market status has also been widely investigated in the literature. It is possible that older people choose to remain at work because of poor financial circumstances, however, Haider and Loughran (9) found that the wealthiest Americans are more likely to be working than the poorest at all ages, and that the difference in labour force participation between the richest and poorest groups (quintiles) increases with age. Banks and Casanova (6) investigated the relationship between inactivity and wealth of English men aged 50 to 64. Contrary to Haider and Loughran (9), they found that inactivity rates exhibit a U-shaped pattern by wealth. Looking across five wealth quintiles, the lowest two wealth groups are most likely to be inactive, but not retired. The highest two wealth groups are most likely to inactive and retired, while those in the middle of the wealth distribution are most likely to be at work. They also found that the association between inactivity and wealth flattens considerably at older ages, with men remaining in work being concentrated at either extreme of the wealth distribution (i.e., in the poorest or richest quintile).
0 20 40 60 80
Primary/none Secondary Third/higher Primary/none Secondary Third/higher
Male Female
Note. N = 4668; Missing obs = 0; Error bars correspond to 95% confidence intervals
The Irish Longitudinal Study on Ageing
TILDA respondents are asked to provide information on their gross assets, including self-valuation of: current residence, properties other than current residence; cars; savings; other financial assets; and other assets including businesses and land. For the purpose of this analysis, wealth is defined as the sum of gross assets and respondents are divided in wealth quartiles.
Figure 8.3 shows that there is a consistent positive association between employment and wealth, especially for women. Of women who fall in the poorest quartile, 34% are in employment, compared to 41% in the second quartile, 46% in the third quartile and 59% in the richest quartile. Of men who fall in the poorest quartile, 38% are in employment, compared to 50% in the second quartile and 71% in both the third and richest quartiles.
8.3.4 Employment and life satisfaction
Previous studies have suggested that working to an older age has positive physical and psychological effects. This may be due to work being an opportunity for active engagement (10,11). Calvo (12) exploited the longitudinal dimension of the Health and Retirement Survey (HRS) and found that longer working lives have beneficial effects on individuals’ physical and psychological well-being. However, the type of job undertaken was found to be a critical factor, with undesirable jobs washing out the potential favourable effects of work. On the other hand, results from SHARE suggest that contented employees tend to work longer. Individual responsibility
0 20 40 60 80
Lowest 2nd 3rd Highest Lowest 2nd 3rd Highest
Male Female
[image:8.595.125.522.297.534.2]Note. N = 2377; Missing obs = 2291; Error bars correspond to 95% confidence intervals
and professional recognition also act as incentives to postpone retirement (13. p.8). Calvo, Haverstick, and Sass (14) studied the HRS cohort of respondents who were fully employed in 1992 and fully retired by 2004. They found that what matters for individuals’ happiness is not the type of transition to retirement (e.g. gradual versus full retirement) but whether the transition is perceived as chosen or imposed.
TILDA respondents are asked whether they agree or disagree with the statement “I am satisfied with my life”. Alternatives are presented on a show card ranging from one (strongly agree) to seven (strongly disagree). Around 80% of male respondents aged 50 to 64 give a response of one or two. Around 10% give a response of three and the remaining 10% give a response of four or above. Hence, the following three categories are identified: a) one-two (high); three (medium); and four and above (low).
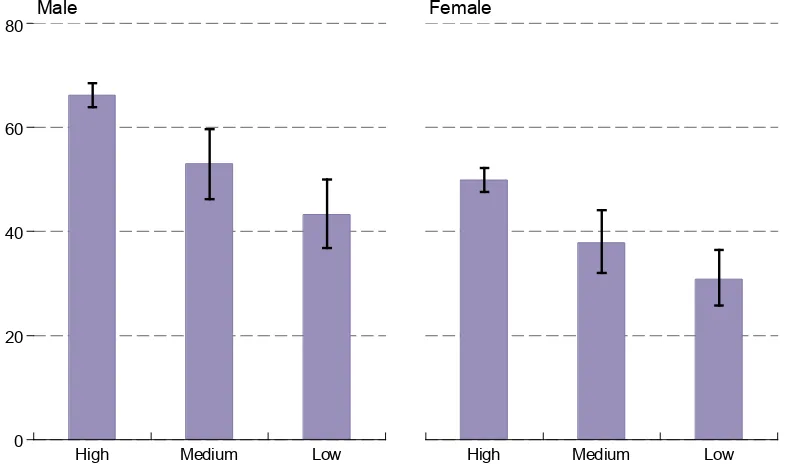
[image:9.595.83.477.376.610.2]Figure 8.4 shows an association between life satisfaction and employment. The rate of employment among the most satisfied men is 66%; amongst the least satisfied it is 43%. For women, the corresponding figures are 50% and 31%.
Figure 8.4: Employment rate by life satisfaction and sex in those aged 50-64
In summary, labour supply of older adults aged 50 to 64 in Ireland is concentrated amongst the healthiest, most educated, wealthiest and most satisfied members of the population.
0 20 40 60 80
High Medium Low High Medium Low
Male Female
The Irish Longitudinal Study on Ageing
8.4 Labour market status of men and women aged 65 to 74
The following section describes the labour market status of men and women aged 65 to 74 and hence already beyond the state pension age (SPA). Table 8.1 showed that for this group, most men are retired (82%) and the majority of women are either retired or looking after home or family (52% and 36%, respectively). Of those at work (16% of all men, 8% of all women), 73% of men are self-employed and 27% are employees. These compare to 31% and 69%, respectively, for women.
Previous international studies including ELSA and HRS have shown that some retired men and women still undertake some paid work. Although reporting themselves as retired, such individuals still show some attachment to the labour market. In the TILDA sample, 4% of both men and women aged 65 to 74 report themselves to be retired but have done at least one hour of paid work in the previous week. These are defined as “retired but working”. For these respondents, the transition out of work is not complete. For this reason, it is appropriate to include them with those who give their main status as being employed.
Similarly to those aged between 50 and 64, there is an association between health and employment. Of men who report being in excellent, very good or good health, 22% are working or retired but working, compared to 12% of those who claim to be in fair or poor health. The corresponding figures for women are 12% and 5%, respectively.
Compared to those aged 50-64, differences across the three educational groups do not hold for men, but are still clear-cut for women. Figure 8.5 shows that 6% of women aged 65 to 74 with primary or no education are still at work, compared to 12% for those with secondary education and 17% for those with third or higher education.
Figure 8.6 shows that there is an association between employment and wealth for men aged 65-74, but not for women. Of men aged 65 to 74 who fall in the poorest group, 5% are in employment, compared to 13% in the second quartile, 20% in the third quartile and 26% in the wealthiest group. Also, the vast majority (73%) of men aged 65 to 74 who are still at work are self-employed whereas most women (69%) are employees, suggesting significant differences in the reasons for continuing to work between men and women in this age group. Finally, in contrast with those aged between 50 and 64, there is no association between employment and life satisfaction for those aged 65 to 74.
0 5 10 15 20 25
Primary/none Secondary Third/higher Primary/none Secondary Third/higher
Male Female
[image:11.595.82.478.110.344.2]Note. N = 2162; Missing obs = 1; Error bars correspond to 95% confidence intervals
Figure 8.5: Employment rate by educational attainment and sex in those aged 65-74
Figure 8.6: Employment rate by wealth quartile and sex in those aged 65-74
0 10 20 30 40
Lowest 2nd 3rd Highest Lowest 2nd 3rd Highest
Male Female
[image:11.595.79.478.437.680.2]The Irish Longitudinal Study on Ageing
8.5 Working conditions of employees aged 50 and above
Here the working conditions of all older employees in Ireland are discussed. Particular issues investigated are: workplace discrimination; the pattern of hours worked by age; expected retirement age; and pension coverage.
8.5.1 Workplace discrimination
TILDA respondents currently in employment are asked whether over the past twelve months they have been subjected to discrimination linked to: sex; age; nationality; ethnic background; religion; disability; and sexual orientation. Very few older people are affected by discrimination at work: 97.6% of men and 96.4% of women who are at work report that they are not being affected by any kind of workplace discrimination.
8.5.2 Hours at work and wind-down
Individuals may change their attitudes about work and compensation as they age. Haider and Loughran (9) found that older Americans work fewer weeks and fewer hours than their younger counterparts and that the median wage decreases with age for both full and part-time workers, regardless of their level of education. SHARE and ELSA have shown that more women work part-time than men, and that both men and women over 65 are more likely to work part time than their younger counterparts. (6, 15).
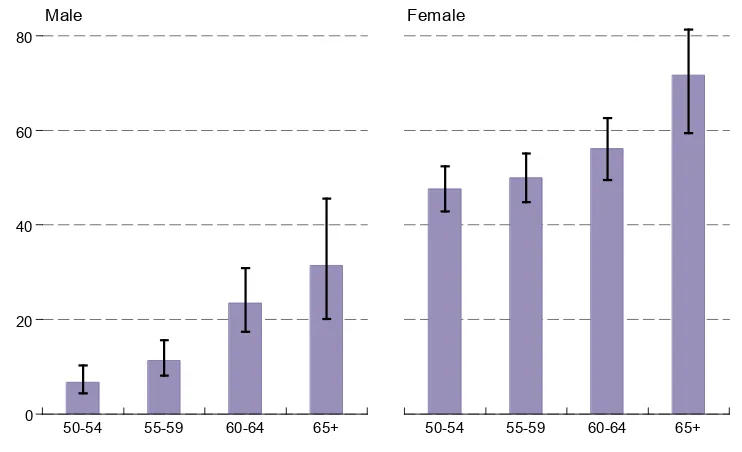
Figure 8.7 explores the issue of “wind-down” by looking at the relative proportions of men and women who are in part-time work divided into four different age groups: (a) 50-54; (b) 55-59; (c) 60-64; and (d) 65+. Following ELSA and SHARE, a part-time worker is defined as an individual working for less than 30 hours per week (excluding meal breaks but including any paid or unpaid overtime). If a respondent has more than one job, both main and subsidiary jobs are taken into account. Only respondents who report themselves to be employed are included (self-employed are excluded).
Men and women approaching the State Pension Age (SPA) (i.e. those aged 60-64) and after SPA (aged 65+) are more likely to be working part-time than their younger counterparts (aged 50-54 and 55-59): 7% of men aged 50-54 work part-time, compared to 23% of men aged 60-64 and 31% of men aged 65+. The corresponding figures for women are 48%, 56% and 71%, respectively.
For men, the average number of hours worked is similar before and after reaching age 65 (37 for men aged 60-64 compared to 36 for men aged 65+). However, far fewer men work after this age and there is likely to be a “composition effect” caused by the characteristics of this group. For women, the number of hours worked decreases significantly after reaching age 65, shifting from 27 for women aged 60 to 64 to 21 for women aged 65 and above.
Table 8.2: Weekly average number of hours spent at work by sex and age group, employees only
8.5.3 Expected Retirement Age
As noted in the introduction to this chapter, a central theme in the economics of ageing is the desirability of extending working lives/postponing retirement so that
Men Women
Mean 95% CI Mean 95% CI
50-54 43 (42,44) 29 (28,30)
55-59 42 (40,44) 28 (27,30)
60-64 37 (35,40) 27 (25,29)
65+ 36 (31,42) 21 (18,24)
0 20 40 60 80
50-54 55-59 60-64 65+ 50-54 55-59 60-64 65+
Male Female
[image:13.595.93.463.522.640.2]Note. N = 2037; Missing obs = 9; Error bars correspond to 95% confidence intervals
Figure 8.7 : Proportion of employees working part time by age and sex
The Irish Longitudinal Study on Ageing
the pressures on state pensions systems can be alleviated. In Ireland, a recent policy initiative which aims to achieve these objectives was contained in the National Pensions Framework (1). Under proposals contained in that document, the state pension age will be increased gradually to 68 years over a period of time. Starting in 2014, the state pension age will be increased by one year to 66. It will subsequently be raised to 67 in 2021 and to 68 in 2028. In this context, it is important to explore the age at which those currently at work expect to retire.
TILDA respondents are asked to state the age at which they plan to retire. The question is asked not only to those currently employed (including employees and self-employed), but also to those who are unemployed or in education or training. However, only employees aged 50 to 64 are included in the present analysis.
[image:14.595.116.532.429.683.2]Figure 8.8 shows that male and female employees have different expectations. Among employees, 43% of men and 36% of women expect to retire at age 65, the current state pension age. 25% of men and 26% of women plan to retire before state pension age (50-64), whereas 15% of men and 10% of women plan to continue working after reaching the current state pension age (66+). Also, women are more uncertain about the age at which they will retire: 13% of women and 6% of men do not know when they will retire. Interestingly, 16% of women and 11% of men do not plan to retire.
Figure 8.8: Expected retirement age by sex, employees aged 50-64
0 10 20 30 40 50
Male Female
50-64 65 66+ Don't plan to retire Don't know
Figure 8.9 shows that expectations are different for different education groups, with the more highly educated expecting to retire earlier. For example, 7% of men and 9% of women with primary or no education expect to retire before SPA, compared to 37% of men and 38% of women with tertiary or higher education. Similarly, 17% of men and 26% of women with primary or no education do not plan to retire, compared to 10% of men and 11% of women with tertiary or higher education. For more details, see Table A8.2.
Figure 8.9: Expected retirement age by educational attainment and sex, employees aged 50-64
8.5.4 Pension coverage
Another objective of the National Pensions Framework is to ensure increased pension coverage beyond the state pension. TILDA respondents working in both the private sector and public sector were asked whether they are covered by an occupational pension scheme organised by their current or previous employer, a Personal Retirement Saving Account (PRSA) organised through their current employer, or another kind of personal pension scheme.
Figure 8.10 shows the proportions of male and female employees aged 50 to 64 who are: a) covered by an occupational pension scheme; b) covered by a PRSA or another kind of personal pension scheme; c) not covered by any of these. If respondents are covered by both an occupational and personal pension scheme, they are classed as having an occupational pension.
0 20 40 60 80 100
Third/higher Secondary Primary/none
Female Male Female Male Female Male
Note. N = 1915; Missing obs = 0
The Irish Longitudinal Study on Ageing
[image:16.595.110.531.208.499.2]Echoing results from a special module of the Quarterly National Household Survey (16), TILDA shows that female employees aged 50 to 64 are less likely to be covered by occupational and private pension schemes than their male counterparts. Amongst women at work, 41% are not covered by an occupational, PRSA or private pension scheme compared to 20% of men. Women are also less likely to be covered by an occupational pension scheme (52% compared to 68% for men).
Figure 8.10: Pension coverage and sex, employees aged 50-64
Private sector employees who are covered by an occupational pension scheme with their current employer are then asked if this is a defined contribution or defined benefit scheme. Defined benefit schemes provide the employee with a pension “promise” of a certain percentage of an employee’s final salary. Defined contribution schemes offer a pension determined by the level of contributions invested into a fund, its investment performance and the charges levied. Public sector employees are asked the name of the scheme they are covered by (e.g., main civil service pension scheme and pension schemes of members of the Garda, armed forces or university teaching and research staff). For the purpose of this analysis, public sector employees who are covered by an occupational pension scheme are considered as covered by a defined benefit scheme. Of those covered by an occupational pension scheme with their current employer, 74% of men and 85% of women are covered by a defined benefit scheme. 26% of men and 15% of women are covered by a defined contribution scheme.
0 20 40 60 80 100
Female Male
Note. N = 1898; Missing obs = 17
Figure 8.11 shows that pension coverage varies significantly by socio-economic group. For example, 74% of managers and 78% of higher professionals are covered by an occupational pension, compared to 48% of semi-skilled and 32% of unskilled workers. For more details, see Table A8.3.
Figure 8.11: Pension coverage by socio-economic group, employees aged 50-64
8.6 Conclusions
More educated, healthier, wealthier and more satisfied older adults are more likely to be at work. While it is tempting to draw inferences about causation, plausible arguments can be made in the case of each factor as to why causal relationships with employment could run in either direction. Better health allows people to remain at work for longer but it is also possible that work contributes to mental and physical health through its impact on social interaction or physical activity. Chapter 6 also shows that respondents with depression have extremely low rates of labour force participation compared to the general population. As with many other dimensions of TILDA, the longitudinal component of the study will be vital in developing insights into these causal links.
The results show both positive and negative aspects of the labour market situations of older employees. On the positive side, little evidence was found of widespread discrimination on the grounds of age. It was also found that average hours worked decline for older groups, thereby suggesting that some form of “wind-down” in
0 20 40 60 80 100
Z All others gainfully occupied and unknown H Own account workers I Farm owners and managers G Unskilled F Semi-skilled E Manual skilled D Non-manual C Lower professional B Higher professional A Employers and managers
Note. N = 1883; Missing obs = 32
The Irish Longitudinal Study on Ageing
advance of retirement may be occurring for some people. On the negative side, the analysis has also shown that one in five male employees and two in five female employees aged 50-64 are not covered by any form of pension.
While the findings presented here shed light on a range of aspects of the labour market situation of older adults, the real value of TILDA will emerge when the data from wave 2 and subsequent waves are available. As the later waves become available, it will be possible to track trends in the variables of interest. It will also be possible to establish causal relationships including for example, the extent to which good health leads people to work longer or working longer leads to good health. By identifying factors that assist longer and more fulfilling working lives, TILDA will allow for the development of carefully designed policy interventions.
References
1. Department of Social and Family Affairs. National Pensions Framework. Dublin: The Stationery Office; 2010.
2. Barnay T, Debrand T. Effects of health on the labour force participation of older persons in Europe. Health Econ Letters. 2006;109.
3. Currie J, Madrian BC. Health, health insurance and the labor market. In:
Ashenfelter O, Card D, editors. Handbook of Labor Economics. Amsterdam: North Holland; 1999. p. 3309-3416.
4. Lumsdaine R, Mitchell O. New developments in the economic analysis of
retirement. In: Ashenfelter O, Card D, editors. Handbook of Labor Economics (3). Amsterdam: North Holland; 1999.
5. Alavinia SM, Burdorf A. Unemployment and retirement and ill-health: a cross-sectional analysis across European countries. Int Arch Occup Environ Health. 2008;82:39-45.
6. Banks J, Casanova M. Work and retirement. In: Marmot M, Banks J, Blundell R, Lessof C, Nazroo J, editors. Health, wealth and lifestyles of the older population in England: the 2002 English Longitudinal Study Of Ageing; 2003. p. 127-142. 7. Kalwij A, Vermeulen F. Health and labour force participation of older people in
Europe: what do objective health indicators add to the analysis?. Health Econ. 2007;17(5): 619-638.
8. Avendano M, Jürges H, Mackenbach JP. Educational level and changes in health across Europe: longitudinal results from SHARE. J EUR SOC POLICY. 2009;19(301). 9. Haider S, Loughran D. Elderly labor supply: work or play?, RAND Labor and
population program working paper 01-09, Santa Monica, CA. 2001
10. Atchley RC. Continuity and adaptation in aging: creating positive experiences. Baltimore, MD: Johns Hopkins University Press; 1999.
11. Rowe JW, Kahn R. Successful aging. New York: Pantheon; 1998.
13. SHARE. 50+ in Europe – Summary of initial results. 2006. Available from:
http://www.share-project.org/t3/share/fileadmin/pdf_selected_results/English.pdf 14. Calvo E, Haverstick K, Sass SA. Gradual retirement, sense of control and retirees’
happiness. RES AGING. 2009;31(112).
15. Brugiavini, A, Croda E, Mariuzzo F. Labour force participation of the older adults: unused capacity?. In: Börsch-Supan A, Brugiavini A, Jürges H, Mackenbach J, Siegrist J, Weber G, editors. Health, ageing and retirement in Europe - first results from the Survey of Health, Ageing and Retirement in Europe; 2005. p. 236-240. 16. Central Statistics Office. Quarterly National Household Survey Pensions Update:
The Irish Longitudinal Study on Ageing The Irish Longitudinal Study on Ageing
App
endi
x
A8
. Tab
le
s on
lab
our
ma
rke
t statu
s of old
er
pe
opl
e
Ta ble 8 .A 1: La bo ur m ar ke t sta tu s b y se x a nd ag e gr ou p Ret ired Em pl oy ed Une m pl oy ed Per m an en tly Si ck or Di sab le d Loo ki ng Af te r Fam ily / Hom e Oth er To tal N um be r in sa m ple % 95% CI % 95% CI % 95% CI % 95% CI % 95% CI % 95% CI M ale 50 -54 3 (2 -4 ) 76 ( 73 -79 ) 13 ( 10 -15 ) 6 (5 -8 ) 1 (1 -3 ) 1 (1 -2 ) 100 727 55 -59 11 (9 -14 ) 62 ( 58 -65 ) 17 ( 14 -20 ) 7 (6 -10 ) 1 (0 -2 ) 2 (1 -3 ) 100 737 60 -64 28 ( 25 -32 ) 48 ( 44 -52 ) 8 (6 -10 ) 12 (9 -15 ) 1 (1 -3 ) 2 (1 -4 ) 100 616 65 -69 77 ( 73 -80 ) 20 ( 16 -24 ) 1 (0 -2 ) 2 (1 -4 ) 0 (0 -1 ) 1 (0 -2 ) 100 591 70 -74 88 ( 85 -91 ) 11 (8 -1 4) 0 - 0 (0 -2 ) 0 (0 -2 ) 0 (0 -2 ) 100 476 75+ 87 ( 84 -90 ) 11 (8 -14 ) 0 - 1 (0 -2 ) 0 (0 -1 ) 1 (0 -2 ) 100 602 To ta l 41 (39 -43 ) 44 (42 -45 ) 8 (7 -9 ) 6 (5 -6 ) 1 (1 -1 ) 1 (1 -2 ) 100 3749 Fem al e 50 -54 2 (1 -3 ) 58 ( 54 -61 ) 7 (5 -9 ) 8 (6 -10 ) 21 ( 19 -25 ) 4 (3 -5 ) 100 895 55 -59 8 (7 -10 ) 47 ( 44 -51 ) 5 (4 -7 ) 8 (6 -10 ) 28 ( 25 -32 ) 2 (1 -4 ) 100 912 60 -64 25 ( 22 -28 ) 33 ( 30 -36 ) 4 (3 -6 ) 6 (5 -9 ) 30 ( 27 -34 ) 2 (1 -3 ) 100 777 65 -69 48 ( 44 -52 ) 13 ( 10 -16 ) 1 (0 -2 ) 3 (2 -4 ) 35 ( 31 -39 ) 2 (1 -3 ) 100 605 70 -74 58 ( 53 -63 ) 3 (1 -4 ) 0 - 2 (1 -4 ) 37 ( 32 -42 ) 1 (0 -2 ) 100 487 75+ 55 ( 50 -59 ) 1 (1 -2 ) 0 (0 -1 ) 2 (1 -4 ) 40 ( 35 -44 ) 2 (1 -3 ) 100 753 To ta l 30 (28 -32 ) 28 (27 -30 ) 3 (3 -4 ) 5 (4 -6 ) 31 (29 -33 ) 2 (2 -3 ) 100 4429 N ote .CI = con
[image:20.595.149.492.61.735.2]Tab le 8. A1 (con t): L ab our m ar ke t st at us b y se x a nd age g ro up Ret ired Em pl oy ed Une m pl oy ed Per m an en tly Si ck or Di sab le d Loo ki ng Af te r Fam ily / Hom e Oth er To tal N um be r in sa m ple % 95% CI % 95% CI % 95% CI % 95% CI % 95% CI % 95% CI To tal 50 -54 3 (2 -3 ) 67 ( 65 -69 ) 10 (8 -11 ) 7 (6 -8 ) 11 ( 10 -13 ) 2 (2 -3 ) 100 1622 55 -59 10 (8 -11 ) 55 ( 52 -57 ) 11 (9 -13 ) 8 (6 -9 ) 15 ( 13 -17 ) 2 (1 -3 ) 100 1649 60 -64 26 ( 24 -29 ) 41 ( 38 -43 ) 6 (5 -7 ) 9 (7 -11 ) 16 ( 14 -18 ) 2 (2 -3 ) 100 1393 65 -69 62 ( 59 -65 ) 16 ( 14 -19 ) 1 (0 -1 ) 2 (2 -3 ) 18 ( 15 -20 ) 1 (1 -2 ) 100 1196 70 -74 73 ( 69 -76 ) 7 (5 -9 ) 0 - 1 (1 -2 ) 19 ( 17 -22 ) 0 (0 -1 ) 100 963 75+ 68 ( 64 -71 ) 5 (4 -7 ) 0 (0 -1 ) 2 (1 -3 ) 24 ( 21 -27 ) 1 (1 -2 ) 100 1355 To ta l 35 (34 -37 ) 36 (34 -37 ) 5 (5 -6 ) 5 (5 -6 ) 17 (16 -18 ) 2 (1 -2 ) 100 8178 N ote .
CI = con
[image:21.595.126.325.84.732.2]The Irish Longitudinal Study on Ageing The Irish Longitudinal Study on Ageing
Tab
le
8.
A2
: Exp
ect ed ret iremen t age b y ed ucati on al a tt ai nm ent a nd sex , e mpl oye es age d 5 0-64 Be for e SPA (50 -64) At SPA (65) After SPA (6 6+ ) Do n ot p la n t o re tir e Do n ot k now To tal N um ber in sam pl e % 95% CI % 95% CI % 95% CI % 95% CI % 95% CI Pri m ar y/ no ne M al e 7 (4 -13 ) 50 ( 41 -58 ) 18 ( 12 -26 ) 17 ( 11 -24 ) 9 (5 -15 ) 100 127 Fe ma le 9 (5 -16 ) 36 ( 29 -45 ) 10 (6 -16 ) 26 ( 19 -35 ) 18 ( 12 -25 ) 100 129 To ta l 8 (5 -12 ) 44 ( 37 -50 ) 14 ( 10 -20 ) 21 ( 16 -27 ) 13 (9 -17 ) 100 256 Se con da ry M al e 25 ( 21 -29 ) 43 ( 38 -48 ) 16 ( 12 -20 ) 10 (7 -14 ) 6 (4 -9 ) 100 362 Fe ma le 23 ( 19 -27 ) 37 ( 33 -42 ) 10 (7 -13 ) 16 ( 12 -20 ) 14 ( 11 -18 ) 100 473 To ta l 24 ( 21 -27 ) 40 ( 37 -44 ) 13 ( 10 -16 ) 13 ( 11 -16 ) 10 (8 -13 ) 100 835 Th ird/ hi ghe r M al e 37 ( 31 -43 ) 38 ( 33 -44 ) 11 (8 -15 ) 10 (7 -14 ) 4 (3 -7 ) 100 301 Fe ma le 38 ( 34 -42 ) 33 ( 29 -37 ) 9 (7 -12 ) 11 (9 -15 ) 9 (7 -12 ) 100 521 To ta l 37 ( 34 -41 ) 35 ( 32 -39 ) 10 (8 -12 ) 11 (8 -13 ) 7 (5 -9 ) 100 822 To tal M al e 25 ( 22 -28 ) 43 ( 39 -47 ) 15 ( 12 -18 ) 11 (9 -14 ) 6 (4 -8 ) 100 790 Fe ma le 26 ( 23 -28 ) 36 ( 33 -39 ) 10 (8 -12 ) 16 ( 14 -19 ) 13 ( 11 -15 ) 100 1123 To ta l 25 ( 23 -27 ) 39 ( 37 -42 ) 12 ( 10 -14 ) 14 ( 12 -16 ) 10 (8 -11 ) 100 1913 N ote .
CI = con
[image:22.595.101.482.85.756.2]Tab le 8. A3 : Pe nsi on co ver age b y soci oecon omic g rou p, empl oye es ag ed 50 -64 Occ up ation al PRSA /Per son al No P en si on To tal N um ber in sam pl e % 95% CI % 95% CI % 95% CI A E m pl oy ers a nd man ager s 74 (67 -79 ) 11 (8 -17 ) 15 (11 -21 ) 100 206 B H igher p ro fe ss ion al 78 (68 -86 ) 9 (4 -18 ) 13 (7 -23 ) 100 89 C Lo w er pro fe ss ion al 85 (81 -89 ) 5 (3 -8 ) 10 (7 -14 ) 100 313 D N on -m an ual 50 (46 -55 ) 8 (6 -11 ) 41 (37 -46 ) 100 486 E M an ua l s kille d 55 (47 -62 ) 18 (13 -25 ) 27 (21 -35 ) 100 154 F Se m i-s kille d 48 (42 -55 ) 8 (5 -13 ) 44 (38 -50 ) 100 243 G U nsk ill ed 32 (22 -44 ) 3 (1 -10 ) 65 (53 -75 ) 100 76 H O w n a ccou nt w ork ers
I Farm o
w ne rs a nd man ager s 41 (13 -76 ) 18 (6 -42 ) 41 (18 -70 ) 100 11 Z Al l o th ers ga in fu lly occup ie d a nd unk no w n 61 (56 -67 ) 10 (6 -14 ) 2 9 (24 -35 ) 100 305 To ta l 59 (57 -62 ) 9 (8 -11 ) 31 (29 -34 ) 100 1883 N ote .
CI = con
[image:23.595.82.337.82.747.2]