HOO 2012:
A Report on the Preposition and Determiner Error Correction Shared Task
Robert Dale, Ilya Anisimoff and George Narroway Centre for Language Technology
Macquarie University Sydney NSW 2109
Australia
[email protected], [email protected], [email protected]
Abstract
Incorrect usage of prepositions and determin-ers constitute the most common types of er-rors made by non-native speakers of English. It is not surprising, then, that there has been a significant amount of work directed towards the automated detection and correction of such errors. However, to date, the use of differ-ent data sets and differdiffer-ent task definitions has made it difficult to compare work on the topic. This paper reports on the HOO 2012 shared task on error detection and correction in the use of prepositions and determiners, where systems developed by 14 teams from around the world were evaluated on the same previ-ously unseen errorful text.
1 Introduction
It is widely recognized that the correct usage of determiners and prepositions in English is a ma-jor problem area for non-native speakers of the lan-guage.1 The issues here have been explored and discussed extensively in the literature; an excellent and up-to-date summary is available in (Leacock et al., 2010). However, the various teams that have at-tempted to tackle these problems so far have tended to use slightly different task specifications, and ferent data sets for evaluation; this makes it very
dif-1We use the broad term ‘non-native speaker’, abbreviated
‘NNS’, in this paper; other work makes a distinction between ESL (English as a Second Language) speakers (who live and speak in a primarily English-speaking environment) or EFL (English as a Foreign Language) speakers (who are learning En-glish in a non-EnEn-glish-speaking country.
ficult to compare the results achieved using different approaches.
To address this problem, the aim of the HOO 2012 Shared Task was to provide a forum for the compar-ative evaluation of different approaches to the cor-rection of these errors.2 The shared task provides a common training dataset, a shared evaluation frame-work, and a set of previously unseen test data.
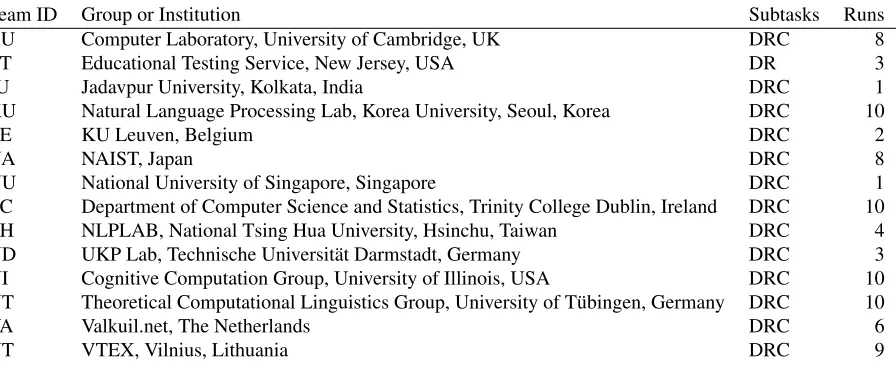
These proceedings contain detailed reports by all 14 teams who participated in HOO 2012. The present paper provides a summary of the task and its evaluation, and a report on the results of that evalu-ation.
Section 2 provides an overview of the task and the timeline across which it was carried out; Section 3 provides details of the participating teams; Section 4 describes the training and test data in more detail; Section 5 presents the results of the evaluation; and Section 6 provides some concluding remarks and discussion, reflecting on lessons learned.
2 The Task
Non-native speakers who are learning English find prepositions and determiners particularly problem-atic. The selection of the appropriate preposition in a given context often appears to be a matter of id-iom or convention rather than being governed by a consistent set of rules; and selecting a determiner
2HOO stands for ‘Helping Our Own’, a reflection of the
his-torical origins of the exercise as an attempt to develop tools to help researchers in natural language processing to write better papers: see (Dale and Kilgarriff, 2010) for the background to this enterprise and (Dale and Kilgarriff, 2011) for a report on the pilot round of the task held in 2011.
Team ID Group or Institution Subtasks Runs
CU Computer Laboratory, University of Cambridge, UK DRC 8
ET Educational Testing Service, New Jersey, USA DR 3
JU Jadavpur University, Kolkata, India DRC 1
KU Natural Language Processing Lab, Korea University, Seoul, Korea DRC 10
LE KU Leuven, Belgium DRC 2
NA NAIST, Japan DRC 8
NU National University of Singapore, Singapore DRC 1
TC Department of Computer Science and Statistics, Trinity College Dublin, Ireland DRC 10 TH NLPLAB, National Tsing Hua University, Hsinchu, Taiwan DRC 4 UD UKP Lab, Technische Universit¨at Darmstadt, Germany DRC 3 UI Cognitive Computation Group, University of Illinois, USA DRC 10 UT Theoretical Computational Linguistics Group, University of T¨ubingen, Germany DRC 10
VA Valkuil.net, The Netherlands DRC 6
[image:2.612.88.536.53.240.2]VT VTEX, Vilnius, Lithuania DRC 9
Table 1: Participating teams
depends on a complex of contextual factors which is particularly challenging for those whose native language does not make use of determiners. The literature suggests that mistakes in the use of the determiners and prepositions account for 20–50% of grammar and usage errors; the extent to which a learner has problems with determiners varies de-pending on their native language, while the degree of difficulty experienced with prepositions is less var-ied (see Chapter 3 in (Leacock et al., 2010)).
For the shared task, we made use of data drawn from the CLC FCE Dataset, a set of 1,244 exam scripts written by candidates sitting the Cambridge ESOL First Certificate in English (FCE) examina-tion in 2000 and 2001, and made available by Cam-bridge Universiy Press; see (Yannakoudakis et al., 2011). This data is described in more detail below.
The version of the data we provided to teams as training data consisted of the original text as written by the examination subjects, so it contains many er-rors besides the preposition and determiner erer-rors; it thus provides a quite realistic challenge, as opposed to artificial data sets where the only errors present are the particular errors of interest. The training data we provided consisted of the raw, errorful texts, and for each text file a set of gold-standard standoff an-notations indicating the locations of the preposition and determiner errors and their corrections, which we extracted from the CUP data annotations.
The task consisted in attempting to generate sets of standoff annotations that matched those in the
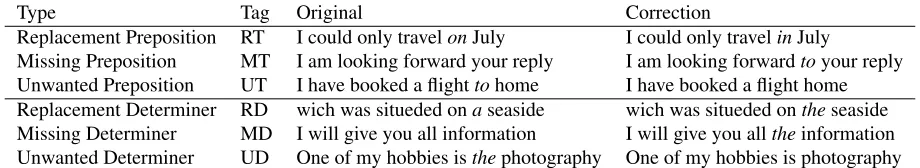
gold standard. Teams were to be evaluated on three subtasks:detection,recognitionandcorrection. The first of these is a measure of a system’s success in determining that something is wrong in a text and that it requires fixing; the second requires also that the precise extent of the error be identified, and the correct type assigned; and the third requires that a correction matching that in the gold standard be of-fered. Scores on each of these subtasks were puted for preposition and determiner errors com-bined, and for preposition and determiner errors sep-arately; thus, each participating system run could generate up to nine distinct scores. In addition, we also provided teams with detection, recognition and correction scores for each of the six base error types (see Table 2); some teams report on these statistics in their individual reports.
The training data and evaluation tools were made available on 27th January 2012; test data was re-leased on April 6th 2012, with submissions of results from teams due on April 13th 2012. Teams therefore had 10 weeks to develop a system that could handle the training data, and one week to provide results on the test data.
3 The Participants
Type Tag Original Correction
Replacement Preposition RT I could only travelonJuly I could only travelinJuly
[image:3.612.76.536.54.138.2]Missing Preposition MT I am looking forward your reply I am looking forwardtoyour reply Unwanted Preposition UT I have booked a flighttohome I have booked a flight home Replacement Determiner RD wich was situeded onaseaside wich was situeded ontheseaside Missing Determiner MD I will give you all information I will give you alltheinformation Unwanted Determiner UD One of my hobbies isthephotography One of my hobbies is photography
Table 2: Examples of the six base error types
from the competition. The 14 teams who completed the shared task are listed in Table 1.3
4 The Data
4.1 Basic Statistics
The training data consisted of 1000 files drawn from the publicly available FCE dataset. These were con-verted from the native FCE format into the HOO data format, which was slightly revised from the ver-sion used in HOO 2011 (see (Dale and Kilgarriff, 2011)). The original data was marked up with all the errors found by the CUP annotator, but we discarded annotations of errors other than the six base types we were interested in, and converted the remaining er-rors into standoff annotations. The six types, with examples of each, are shown in Table 2;4 Figure 1 shows a fragment of an FCE data file, and Figure 2 shows a standoff annotation example extracted from this file in the HOO format.
Elements of some of these files were removed to dispose of nested edits and other phenomena that caused difficulties in the preprocessing of the data.5 The resulting set of training data comprised a total of 374680 words, for an average of 375 words per file.
The test data consisted of a further 100 previously unseen files provided to us for this shared task by CUP. These were processed in the same manner as the training data. The test data comprised 18013 words, for an average of 180 words per file. Counts
3
The ‘Subtasks’ column indicates which subtasks the team took part in: detection (D), recognition (R) and correction (C). The ‘Runs’ column is explained later.
4For the present exercise we used the preposition and
deter-miner error tags as provided in the CLE tagset. The full CLE tagset is described in (Nicholls, 2003).
5
This preprocessing step was not perfect, and we subse-quently discovered it had introduced some noise into the data.
<p>
First I must say that most <#UT>of</#UT> people don’t see any problems with <#RV>growing|increasing</#RV> <#RD>a|the</#RD> list of <#UP>car’s|car</#UP> owners.
Some of them think that it shows how <#SX>reach|rich</#SX> our country is. </p>
Figure 1: A fragment of an FCE data file
<edit type="RD" index="0005" file="0006" part="1" start="427" end="428"> <original>a</original> <corrections>
<correction>the</correction> </corrections>
</edit>
Figure 2: A standoff error annotation
of the different error types in the training and test data are provided in Table 3, demonstrating that the error rate remained fairly constant across training and test data. However, whereas the training data included information on author’s first language (L1) and age range, the L1 information was not present in the test data, thus removing a potentially useful feature that some teams may have hoped to exploit.
4.2 Revisions to the Gold-Standard Data
Note that Table 3 shows counts for two versions of the gold-standard test data: the original version as derived from the CUP-provided data set (‘Test A’), and a revised version (‘Test B’) which incorporates corrections to errors found in the annotations.
Type # Training # Test A # Test B
UT 822 43 39
MT 1105 57 56
RT 2618 136 148
Prep 4545 236 243
UD 1048 53 62
MD 2230 125 131
RD 609 39 37
Det 3887 217 230
Total 8432 453 473
[image:4.612.356.495.52.152.2]Words/Error 44.18 39.77 38.08
Table 3: Data statistics
in particular, systems were identifying real errors in the source texts which had not been annotated in the gold standard, and were consequently being pe-nalised for finding spurious errors which were not in fact spurious.
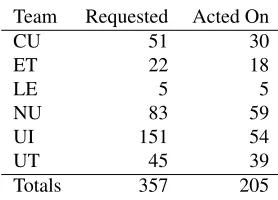
To address this problem, once teams had submit-ted their results, we allowed a brief period where teams could review the gold-standard data to iden-tify possible corrections to that data. Table 4 shows the number of revisions requested by each team, and the number of these revisions that were accepted. Note that there were a significant number of revi-sions (99) that were requested by more than one team, so the total count of revision requests is larger than the actual number of revisions considered. Of the total 357 requests, 205 were acted on, in some cases not in the manner requested by the team; 152 requests led to no changes being made to the anno-tations.
Note that the teams’ original sets of submitted ed-its were compared against this revised gold standard, so there was no sense in which a system’s behaviour could be tuned to the test data. However, clearly any given team might stand to benefit from iden-tifying particular errors their system had identified that were not in the gold standard, effectively tuning the test data to system behaviour. Consequently, we provide results below for both the original and the revised data sets, and briefly discuss the impact of these corrections.
5 Results
Each team was allowed to submit up to 10 sepa-rate ‘runs’ over the test data, thus allowing them to
Team Requested Acted On
CU 51 30
ET 22 18
LE 5 5
NU 83 59
UI 151 54
UT 45 39
[image:4.612.83.291.54.190.2]Totals 357 205
Table 4: Requests for corrections to the gold-standard data
have different configurations of their systems evalu-ated; the number of runs submitted by each team is shown in Table 1. We report here only on the best-performing runs from each team.
Teams were asked to indicate whether they had used only publicly-available data to train their sys-tems, or whether they had made use of privately-held data: only the ET and CU teams used privately-held data, and in the latter case only for a subset of their runs. In the tabulated results provided here, reported runs that involve privately-held data are marked with an asterisk.
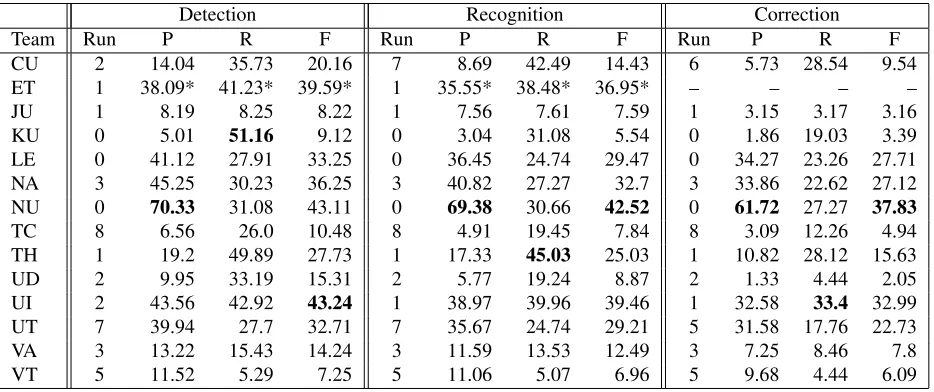
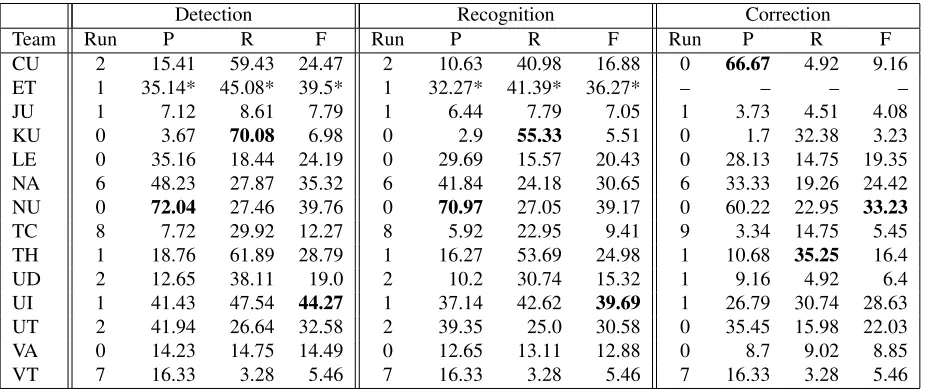
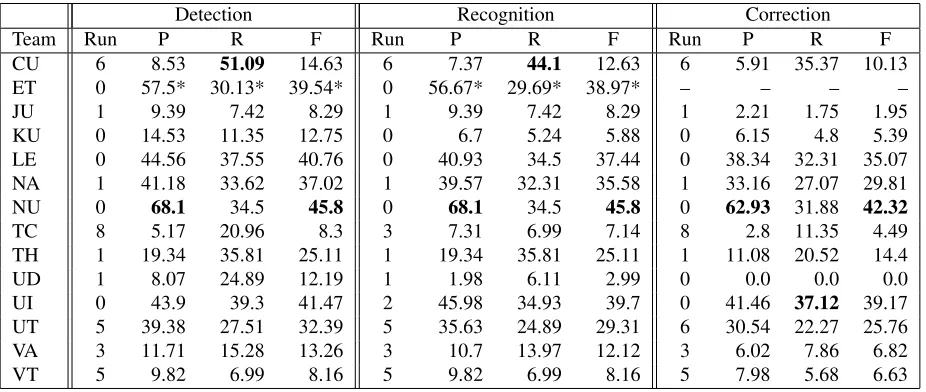
The results of the evaluation are provided here in six tables. Tables 5 and 6 provide results for prepo-sition and determiner errors combined; Tables 7 and 8 provide results for preposition errors only; and Ta-bles 9 and 10 provide results for determiner errors only. In each pair, the first table shows results before the revisions described in Section 4.2 were carried out, and the second table shows the results using the revised gold-standard data. Each table shows preci-sion, recall and F-score (computed as the harmonic mean) for each of detection, recognition and correc-tion; for each of these, the best score is shown in bold.6 Note that team ET did not participate in the correction subtask.
The scores for all teams improve as a consequence of the revisions being made to the data. The result of a paired t-test on the ‘before’ and ‘after’ combined preposition and determiner scores across teams was statistically significant (t=−3.17,df(12),p < .01);
6
F-scores improved by a mean value of 2.32. The same analyses for preposition scores also resulted in significant improvement (t = −3.29, df(12),
p < .01), with a mean improvement in F-scores
of 2.6. A smaller (but still statistically significant) improvement in determiner scores was also present (t=−2.86,df(12),p < .05), with a mean improve-ment in F-scores of 1.99.
There are also positive correlations between the rankings before and after revisions. Pearson corre-lation coefficients for the ‘before’ and ‘after’ scores for prepositions and determiners combined, prepo-sitions only, and determiners only (respectively) are .993, .985 and .996. All correlation coefficients are significant atp < .001,n= 13(teams).
However, some systems improve more than oth-ers. An obvious question to ask, then, is whether the benefit that a team achieves is positively correlated with the number of accepted corrections they pro-posed; a calculation of Pearson’s correlation coeffi-cient suggests that this is indeed the case (r = 0.821,
p = 0.044(one-tailed)).7 This suggests, then, that the ‘before’ results may be a more reliable indicator of comparative performance.
6 Discussion and Conclusions
In this section, we make some observations on lessons learned with regard to various aspects of the shared task.
6.1 Data Acquisition
Data annotated with non-native speaker errors has significant commercial value, and so is not easy to find in the public domain. We were fortunate to be able to take advantage of the recently-made-available FCE dataset as training data, but this left us with the problem of acquiring previously unseen test data. To address this, we entered into negotia-tion with Cambridge University Press with the aim of acquiring some additional previously unreleased data. We started this process in December 2011, but it quickly became apparent that some of the legal aspects would necessarily make this a slow process.
7
Computed here on the combined preposition and deter-miner scores, and taking account only of the five teams that proposed corrections, these being UI, NU, LE, UT and CU. ET was not included in this calculation since they did not submit to the corrections subtask.
As a back-up plan, we informed teams that we might have to fall back on some of the already-available FCE data as test data; to this end, we asked teams only to use versions and subsets of the FCE data that we made directly available. We thus selected 1000 files from the 1200 that make up the public FCE data set as training data, and reserved the remainder as a source of possible test data.
This is clearly not an ideal situation; fortunately, we finally signed agreements for the use of a new set of FCE data in the week before the test data was due to be released, but this was leaving things rather tight. The moral here is that one needs to be confi-dent of one’s data sources early on in the process.
6.2 Data Quality
As discussed above, it became apparent that there were what appeared to be annotation errors in our data. This is perhaps inevitable given the nature of the source data, which was annotated by only one annotator (subsequent to some prior automatic pro-cessing). The issue of reliability of annotation in this area has been noted by others (see, for example, the discussion in Chapter 5 in (Leacock et al., 2010)). Assuming that we agree an error is present—and this is not always in itself straightforward—there is often more than one way to correct that error; however, the FCE annotation scheme does not permit multiple possible corrections, so in the source data we used, there was only ever one correction per error. Our revision process identified a number of cases where alternative corrections were equally acceptable, and fortunately the HOO annotation scheme allowed us to incorporate multiple possible corrections; but it’s quite clear that we did not identify all cases where multiple corrections were valid.8
This is a significant issue. If we cannot entirely trust our gold-standard data, then we cannot place too much trust in the results of evaluations carried out using that data. Of course, annotation quality is a problem in any task, but it may be more se-vere in cases like the present one because the judge-ments here are often less clear cut: whereas there is rarely dispute as to whether a given string consti-tutes a named entity, it is not always so clear that
8The HOO scheme also allows optional edits, but we did not
Detection Recognition Correction
Team Run P R F Run P R F Run P R F
CU 2 13.12 34.88 19.07 7 8.13 41.5 13.6 0 70.0 4.64 8.7
ET 1 33.59* 37.97* 35.65* 1 30.27* 34.22* 32.12* – – – –
JU 1 6.93 7.28 7.1 1 6.3 6.62 6.46 1 2.52 2.65 2.58
KU 0 4.61 49.23 8.43 0 2.67 28.48 4.88 0 1.45 15.45 2.65
LE 0 37.38 26.49 31.01 0 33.33 23.62 27.65 0 31.15 22.08 25.84 NA 3 40.19 28.04 33.03 3 36.39 25.39 29.91 3 29.43 20.53 24.19
NU 0 57.42 26.49 36.25 0 55.98 25.83 35.35 0 45.45 20.97 28.7
TC 9 5.33 25.61 8.82 9 4.18 20.09 6.92 9 2.66 12.8 4.41
TH 1 17.74 48.12 25.92 1 15.38 41.72 22.47 1 9.44 25.61 13.79
UD 2 8.94 31.13 13.88 2 5.51 19.21 8.57 2 1.2 4.19 1.87
UI 8 37.22 43.71 40.2 1 34.23 36.64 35.39 1 26.39 28.26 27.29 UT 6 37.46 25.39 30.26 7 32.01 23.18 26.89 7 21.95 15.89 18.44
VA 3 12.5 15.23 13.73 3 10.87 13.25 11.94 3 6.16 7.51 6.77
[image:6.612.74.539.53.247.2]VT 5 10.6 5.08 6.87 5 10.14 4.86 6.57 5 8.76 4.19 5.67
Table 5: Results before revisions, all errors
Detection Recognition Correction
Team Run P R F Run P R F Run P R F
CU 2 14.04 35.73 20.16 7 8.69 42.49 14.43 6 5.73 28.54 9.54
ET 1 38.09* 41.23* 39.59* 1 35.55* 38.48* 36.95* – – – –
JU 1 8.19 8.25 8.22 1 7.56 7.61 7.59 1 3.15 3.17 3.16
KU 0 5.01 51.16 9.12 0 3.04 31.08 5.54 0 1.86 19.03 3.39
LE 0 41.12 27.91 33.25 0 36.45 24.74 29.47 0 34.27 23.26 27.71 NA 3 45.25 30.23 36.25 3 40.82 27.27 32.7 3 33.86 22.62 27.12
NU 0 70.33 31.08 43.11 0 69.38 30.66 42.52 0 61.72 27.27 37.83
TC 8 6.56 26.0 10.48 8 4.91 19.45 7.84 8 3.09 12.26 4.94
TH 1 19.2 49.89 27.73 1 17.33 45.03 25.03 1 10.82 28.12 15.63
UD 2 9.95 33.19 15.31 2 5.77 19.24 8.87 2 1.33 4.44 2.05
UI 2 43.56 42.92 43.24 1 38.97 39.96 39.46 1 32.58 33.4 32.99 UT 7 39.94 27.7 32.71 7 35.67 24.74 29.21 5 31.58 17.76 22.73
VA 3 13.22 15.43 14.24 3 11.59 13.53 12.49 3 7.25 8.46 7.8
VT 5 11.52 5.29 7.25 5 11.06 5.07 6.96 5 9.68 4.44 6.09
Table 6: Results after revisions, all errors
something is an error, or where that error should be located. The incorporation of optional and multiple corrections in the HOO framework was intended to address this kind of problem, but the value of these features is only delivered if the scheme is used dur-ing annotation, rather than bedur-ing applied after anno-tation has already been carried out.
6.3 The Annotation Scheme and Evaluation
Tools
Given real non-native speaker data that contains a wide range of errors other than those that we were particularly concerned with in this shared task, we
were faced with three alternatives in how we pre-pared the data for use in the task.
1. We could provide the data with all original er-rors in place.
2. We could provide the data with all but the preposition and determiner errors corrected.
3. We could provide the data with selected errors corrected or replaced.
[image:6.612.74.541.285.481.2]Detection Recognition Correction
Team Run P R F Run P R F Run P R F
CU 2 14.88 59.32 23.79 2 9.99 39.83 15.97 0 61.11 4.66 8.66
ET 1 31.95* 42.37* 36.43* 1 27.16* 36.02* 30.97* – – – –
JU 1 6.1 7.63 6.78 1 5.42 6.78 6.03 1 3.05 3.81 3.39
KU 0 3.39 66.95 6.46 0 2.51 49.58 4.79 0 1.27 25.0 2.41
LE 0 32.81 17.8 23.08 0 27.34 14.83 19.23 0 25.78 13.98 18.13 NA 6 41.13 24.58 30.77 3 36.43 19.92 25.75 3 30.23 16.53 21.37
NU 0 56.99 22.46 32.22 0 53.76 21.19 30.4 0 41.94 16.53 23.71
TC 9 6.49 29.66 10.65 9 5.19 23.73 8.52 9 3.06 13.98 5.02
TH 1 17.39 59.32 26.9 1 14.16 48.31 21.9 1 9.19 31.36 14.22
UD 2 11.84 36.86 17.92 2 9.66 30.08 14.62 1 7.63 4.24 5.45
UI 1 38.21 45.34 41.47 5 31.05 40.25 35.06 1 20.36 24.15 22.09 UT 2 39.35 25.85 31.2 7 35.76 22.88 27.91 0 25.45 11.86 16.18
VA 0 13.44 14.41 13.91 0 11.46 12.29 11.86 0 7.51 8.05 7.77
[image:7.612.74.539.53.248.2]VT 7 12.24 2.54 4.21 7 12.24 2.54 4.21 7 12.24 2.54 4.21
Table 7: Results before revisions, preposition errors only
Detection Recognition Correction
Team Run P R F Run P R F Run P R F
CU 2 15.41 59.43 24.47 2 10.63 40.98 16.88 0 66.67 4.92 9.16
ET 1 35.14* 45.08* 39.5* 1 32.27* 41.39* 36.27* – – – –
JU 1 7.12 8.61 7.79 1 6.44 7.79 7.05 1 3.73 4.51 4.08
KU 0 3.67 70.08 6.98 0 2.9 55.33 5.51 0 1.7 32.38 3.23
LE 0 35.16 18.44 24.19 0 29.69 15.57 20.43 0 28.13 14.75 19.35 NA 6 48.23 27.87 35.32 6 41.84 24.18 30.65 6 33.33 19.26 24.42
NU 0 72.04 27.46 39.76 0 70.97 27.05 39.17 0 60.22 22.95 33.23
TC 8 7.72 29.92 12.27 8 5.92 22.95 9.41 9 3.34 14.75 5.45
TH 1 18.76 61.89 28.79 1 16.27 53.69 24.98 1 10.68 35.25 16.4
UD 2 12.65 38.11 19.0 2 10.2 30.74 15.32 1 9.16 4.92 6.4
UI 1 41.43 47.54 44.27 1 37.14 42.62 39.69 1 26.79 30.74 28.63 UT 2 41.94 26.64 32.58 2 39.35 25.0 30.58 0 35.45 15.98 22.03
VA 0 14.23 14.75 14.49 0 12.65 13.11 12.88 0 8.7 9.02 8.85
VT 7 16.33 3.28 5.46 7 16.33 3.28 5.46 7 16.33 3.28 5.46
Table 8: Results after revisions, preposition errors only
of a preposition or determiner error could confuse a system focussed only on preposition or determiner errors; if the surrounding context contains errors, then it cannot be relied upon to deliver the kinds of features that one would expect to find in well-formed text. To partially address this, many teams ran a spelling correction process on the texts prior to applying their techniques; but this only catches a small proportion of the potential problems.
However, the second option has the opposite problem: by removing all the other errors from the text, we would be providing a very artificial dataset where one assumes some other process has fixed all
the other errors before the errors of interest here are addressed. While there are some types of er-rors that might sensibly be addressed before others in a pipeline, in general this is not a very plausible model; any real system is going to have to address noisy data containing many different kinds of errors simultaneously.
[image:7.612.76.540.285.481.2]Detection Recognition Correction
Team Run P R F Run P R F Run P R F
CU 6 7.8 49.31 13.48 6 6.86 43.32 11.84 6 5.25 33.18 9.07
ET 0 51.67* 28.57* 36.8* 0 50.83* 28.11* 36.2* – – – –
JU 1 7.73 6.45 7.04 1 7.73 6.45 7.04 1 1.66 1.38 1.51
KU 0 12.85 10.6 11.62 0 6.7 5.53 6.06 0 6.15 5.07 5.56
LE 0 40.41 35.94 38.05 0 37.31 33.18 35.12 0 34.72 30.88 32.68 NA 1 37.43 32.26 34.65 1 36.36 31.34 33.66 1 28.88 24.88 26.73
NU 0 57.76 30.88 40.24 0 57.76 30.88 40.24 0 48.28 25.81 33.63
TC 3 8.68 8.76 8.72 3 7.76 7.83 7.8 3 4.11 4.15 4.13
TH 1 17.69 34.56 23.4 1 17.69 34.56 23.4 1 9.91 19.35 13.1
UD 2 6.41 24.88 10.19 1 1.98 6.45 3.03 0 0.0 0.0 0.0
UI 0 40.0 37.79 38.86 0 38.05 35.94 36.97 0 35.61 33.64 34.6
UT 5 34.38 25.35 29.18 5 31.87 23.5 27.06 6 25.75 19.82 22.4 VA 3 11.04 15.21 12.79 3 10.37 14.29 12.02 3 5.02 6.91 5.81
[image:8.612.79.534.53.247.2]VT 5 9.82 7.37 8.42 5 9.82 7.37 8.42 5 7.98 5.99 6.84
Table 9: Results before revisions, determiner errors only
Detection Recognition Correction
Team Run P R F Run P R F Run P R F
CU 6 8.53 51.09 14.63 6 7.37 44.1 12.63 6 5.91 35.37 10.13
ET 0 57.5* 30.13* 39.54* 0 56.67* 29.69* 38.97* – – – –
JU 1 9.39 7.42 8.29 1 9.39 7.42 8.29 1 2.21 1.75 1.95
KU 0 14.53 11.35 12.75 0 6.7 5.24 5.88 0 6.15 4.8 5.39
LE 0 44.56 37.55 40.76 0 40.93 34.5 37.44 0 38.34 32.31 35.07 NA 1 41.18 33.62 37.02 1 39.57 32.31 35.58 1 33.16 27.07 29.81
NU 0 68.1 34.5 45.8 0 68.1 34.5 45.8 0 62.93 31.88 42.32
TC 8 5.17 20.96 8.3 3 7.31 6.99 7.14 8 2.8 11.35 4.49
TH 1 19.34 35.81 25.11 1 19.34 35.81 25.11 1 11.08 20.52 14.4
UD 1 8.07 24.89 12.19 1 1.98 6.11 2.99 0 0.0 0.0 0.0
UI 0 43.9 39.3 41.47 2 45.98 34.93 39.7 0 41.46 37.12 39.17 UT 5 39.38 27.51 32.39 5 35.63 24.89 29.31 6 30.54 22.27 25.76
VA 3 11.71 15.28 13.26 3 10.7 13.97 12.12 3 6.02 7.86 6.82
VT 5 9.82 6.99 8.16 5 9.82 6.99 8.16 5 7.98 5.68 6.63
Table 10: Results after revisions, determiner errors only
In the end, we opted for the first alternative here, on the grounds that this is the best approximation to the real task of non-native speaker error correction. The third alternative would also have been possible, but we were concerned about the impact on the size of our test data set that would result from carrying out this process across the board. However, in the re-vision step described in Section 4.2, we did remove instances of a particular error type, where a preposi-tion error was immediately followed by a verb error; consider the following sentence and its correction.
(1) a. What do you dofor tryingto save the wild
life?
b. What do you doto tryto save the wild life?
The compound nature of these errors meant that teams were unlikely to correct them; and it might be argued that they are not preposition errors in the con-ventional sense. However, we did not remove these instances uniformly, so some still remain in the test data.
[image:8.612.76.539.285.481.2]standoff edit notation. It is often inaccuracies at this level that contribute to the differences between a team’s detection score and the corresponding recog-nition score. While precise character offset infor-mation is important for some error correction tasks (for example, one would not want an automated cor-rector to insert corrections misplaced by one charac-ter), arguably it is too strict in the present circum-stances. Dahlmeier and Ng (2012) propose an al-ternative evaluation scheme which, along with other properties, overcomes this by operating in terms of tokens rather than character offsets.
6.4 Summary
Overall, we were immensely pleased with the level of interest in this shared task. The HOO 2012 train-ing data and evaluation tools are publicly available, so interested parties who did not take part in the shared task can still try their hand retrospectively; unfortunately, our contract with CUP means that the test data used in this round is not publicly available. Our future plans include packaging a subset of the initially held-out public FCE data set as a new test set, with the aim of establishing a standardised train-ing and testtrain-ing setup in the same way as Section 23 of the Wall Street Journal corpus is conventionally used as a test set. We have strongly encouraged the use of publicly available data sets, and have asked teams to be as detailed as possible in their reports in the interests of replicability; we hope this will make it possible for new entrants to the area to get up to speed quickly.
Of course, the FCE data also supports work on many other kinds of errors. We expect to address subsets of these in future HOO rounds.
Acknowledgements
We’d like to acknowledge the kind assistance of various people in making this shared task possi-ble: Ted Briscoe for seeding the enterprise by work-ing to make the FCE data publicly available; Di-ane Nicholls and Adam Kilgarriff for encourage-ment and advice along the way; Ann Fiddes at Cam-bridge University Press for providing the previously unseen test data; Richard Cox for statistics; and Joel Tetreault, Claudia Leacock and Jill Burstein for agreeing to host the shared task at the Building Ed-ucational Applications Workshop. Macquarie Uni-versity provided financial support via a Research
Development Grant. Finally, of course, we’d like to thank all the teams for participating.
References
Daniel Dahlmeier and Hwee Tou Ng. 2012. Better evalu-ation for grammatical error correction. InProceedings of the 2012 Conference of the North American Chapter of the Association for Computational Linguistics: Hu-man Language Technologies, Montr´eal, Canada, 3rd– 8th June 2012.
Robert Dale and Adam Kilgarriff. 2010. Helping Our Own: Text massaging for computational linguistics as a new shared task. In Proceedings of the 6th In-ternational Natural Language Generation Conference, pages 261–266, Dublin, Ireland, 7th–9th July 2010. Robert Dale and Adam Kilgarriff. 2011. Helping our
own: The HOO 2011 pilot shared task. In Proceed-ings of the 13th European Workshop on Natural Lan-guage Generation, Nancy, France, 28th–30th Septem-ber 2011.
Robert Dale and George Narroway. 2012. A frame-work for evaluating text correction. In Proceed-ings of the Eighth International Conference on Lan-guage Resources and Evaluation (LREC2012), Istan-bul, Turkey, 21st–27th May 2012.
Michael Gamon. 2010. Using mostly native data to cor-rect errors in learners writing. InProceedings of the Eleventh Annual Conference of the North American Chapter of the Association for Computational Linguis-tics (NAACL), pages 163–171, Los Angeles, USA. Claudia Leacock, Martin Chodorow, Michael Gamon,
and Joel Tetreault. 2010. Automated Grammatical Er-ror Detection for Language Learners. Synthesis Lec-tures on Human Language Technologies. Morgan and Claypool.
Diane Nicholls. 2003. The Cambridge Learner Corpus—error coding and analysis for lexicography and ELT. In D Archer, P Rayson, A Wilson, and T McEnery, editors, Proceedings of the Corpus Lin-guistics 2003 Conference, pages 572–581, Lancaster, UK, 29th March–2nd April 2001.