Journal of the Statistical and Social Inquiry Society of Ireland Vol XXV Part V THE BARRINGTON PRIZE LECTURE, 1986/87
THE REVEALED COMPARATIVE ADVANTAGE OF IRISH EXPORTS OF MANUFACTURES 1969-1982
DONAL J THORNHILL*
(read before the Society, 14 January 1988)
"This lecture is delivered under the auspices of the Barnngton Trust (founded in 1986 by the bequest of John Barnngton, Esq ) with the collaboration of the Statistical and Social Inquiry Society of Ireland "
1 INTRODUCTION
This paper outlines the results of an empirical study of the repealed comparative advantage of Irish exports of manufactures during the period 1969-1982
The concept of comparative advantage is central to the theory of international trade This study involved the measurement of the evolution over time of the revealed comparative advantage of the different sub-sectors which constitute Irish manufacturing industry
The paper is organised as follows Section 2 outlines the theoretical background Section 3 deals with the approaches used for the measurement of comparative advantage and for the classification of industrial sectors An analysis of the pattern of revealed comparative advantage by industrial sector is described in Section 4 These results are evaluated within a theoretical framework in Section 5 Section 6 tentatively explores the implications of the conclusions drawn in the earlier sections for the discussion of industrial policy issues
In 1984 the Council of the Statistical and Social Inquiry Society of Ireland established a competition to select the author of an Annual Barnngton Lecture to replace the former system of appointment of Barnngton Lecturers who delivered lectures in the four provinces throughout the year The competition will be held annually and is open to Irish graduates within 10 years of primary qualification to submit a paper on economic policy and analysis of current interest in Ireland The 1987 prize-winning lecture is presented here
2 WHAT IS COMPARATIVE ADVANTAGE? THE THEORETICAL BACKGROUND
Before Ricardo s work in the nineteenth century, differences in the absolute productivity of labour - otherwise described as absolute advantage - were identified as the explanation for trade between countries This explained why a more efficient country exported to a less efficient trading partner but it also led to the conclusion that unless a country enjoyed an absolute advantage in the production of at least one commodity then it could not afford to trade Despite its limitations, this view of trade still influences public debate and policy It explains for example, some of the opposition in the developed industrial economies to the "unfair competition" from the newly industrialising countries
A contemporary Irish illustration of the persistence of this notion is the apparent widespread puzzlement and concern about the high level of imports of fresh vegetables
Ricardo
By introducing the concept of comparative advantage, Ricardo provided a more satisfactory explanation of the basis for trade If the opportunity cost for good X in country A (i e the amount of production of commodity Y which must be given up in order to produce one additional unit of commodity X) is lower than the corresponding cost in country B then both countries will gain if A exports X to B and B exports Y to A As long as the opportunity costs for one good differ, each country has a comparative advantage in the production of one of the two goods Both countries will gain from trade even if one country has an absolute advantage in both lines of production
The Ricardian trade model identified labour as the only factor of production which restricted its value as an analytical framework The concept of comparative advantage has however remained central to most of the subsequent theoretical models of international trade A very brief, and incomplete, survey of some of these models is given in the following paragraphs
Heckscher-Ohlm, factor proportions
The Heckscher-Ohlin model uses two factors of production - labour and capital Its basic theorem for a two-country, two-commodity model is that a country exports the good which uses intensively the factor of production with which it is relatively well endowed and imports the good which uses intensively the factor with which it is relatively poorly endowed A relatively capital-rich country exports capital-intensive goods and imports labour-intensive goods while a relatively labour-intensive country exports labour-intensive goods and imports capital-intensive goods A country's comparative advantage vis-a-vis another is determined by their relative endowments of labour and capital
The Heckscher-Ohlin model makes many assumptions which are not realised in the real world1 To explain trade in the real world it needs to be extended and the simplifying assumptions need to be relaxed Attempts have been made to incorporate intra-industry trade, the role of education and skills in the labour force (so-called human-capital) and R + D (knowledge-capital) In the process the model loses its analytical rigour in the real multi-country, multi-commodity world with complex production functions, factor mobility, variable factor supplies, imperfect competition, transport and information costs, government interference in markets and less than full employment
Product cycle
This model was originally published by Vernon in 1966 and provides a useful analytical framework It allows for factor mobility, product differentiation, knowledge and skill development It also fits easily into a dynamic framework (i e one where a country's comparative advantage can change over time) The model also incorporates multi-national enterprises (MNEs)
A simple presentation of this model begins with a product or process innovation involving a knowledge input into the production process This provides the country where the innovation took place with a temporary comparative advantage The innovation is initially diffused to foreign markets through trade As the products or technologies mature and as the knowledge input begins to become dated (or perhaps the owners lose ownership of the intellectual property involved in the innovation), production shifts abroad to locations where labour costs are lower and the previously exported goods may be imported into the innovating country Meanwhile, further innovations may occur in the innovating country resulting in comparative advantage in new or improved products
The determinants of comparative advantage in this model are knowledge (or knowledge-capital), skill levels among the workforce (human-capital), market size and per-capita income The last two determinants reflect the fact that innovations tend to be labour-saving and are more valuable the higher the cost of labour - irrespective of whether the labour saved is in the work place or is household labour time saved by a new consumer durable good According to the model innovating firms perceived needs and opportunities in their home markets, and so innovations tend to be made in the countries with the highest labour costs and per-capita incomes Initial production tends to take place near the market and point of innovation because of the need to develop and maintain feedback with the market as well as uncertainty about the production process in the early stages This model has been particularly powerful in explaining the dominance of the US in exports of knowledge-intensive products and as a home of multi-national enterprises during the 1950's and 1960's
growth The assumptions underlying the model included the considerable differences in technological capacity and in per-capita incomes (as a consequence in market demands and factor-cost relativities) between the US and other countries These differences, of course, gradually disappeared as the leading European countries and Japan closed the technological and income gaps with the US Vernon took account of these developments and also of the declining costs of information in a re-appraisal of the model which he published in 1979 [2] He postulated that as MNEs improved their capacity to obtain and evaluate information about world wide changes in market demands and production costs, the original model of the innovating firm developing a product at home and then transferring production abroad in response to competitive threats would become less valid The new "global-scanning MNE" would be in a position to immediately locate production of new products in the optimum location and to re-locate as its assessment of the relevant parameters changed In 1979 he considered this model to be unreal, the reduction in information processing and transmission costs that have taken place since then may mean that it approximates closer to reality today For other categories of MNEs (such as highly centralised organisations producing standardised products for homogeneous world demand e g automobiles, aircraft, Pharmaceuticals, computers and organisations which allow decentralised production and marketing) he argued that the original model was still useful as an explanatory and predicative framework
Neo-factor proportions
This is a less radical departure than the product cycle from the Heckscher-Ohhn two-factor framework and essentially involves an extension and a refinement of the range of factors of production It draws a distinction between human capital and non-human capital Natural resources and the cost and availability of technology are also included among the determinants of comparative advantage (the latter regarded as augmenting capital)
Telesis
The concept of "complex factor cost determined businesses" which is used as an analytical tool in the Telesis report on Irish industrial policy [3] incorporates many of the concepts of the product cycle model and of the neo-factor proportions approach The Telesis presentation divides businesses into four categories
(1) Unskilled labour-intensive,
(2) Capital and raw material-intensive,
(3) Capital and machinery-intensive,
(4) Knowledge-intensive (complex factor-cost)
In the first category competitive advantage is determined by wage costs In contrast, businesses in the fourth category require a capacity for high performance in knowledge development and application, organisation and strategy in order to ensure competitive success According to Telesis "the proportion of businesses an economy has which are complex-factor cost determined rather than being low-wage dependent is a measure of its potential for increased living standards" [4] This conclusion is not dissimilar to those derivable from the product-cycle model and the neo-factor proportions approach
Natural resources
While these are taken into consideration in the neo-factors proportion approach, economic theory appears to have been less than fully successful in dealing with the role of natural resources in determining a country's comparative advantage This may be a reflection of the fact that "explanations of real-world phenomena which are based on the special circumstances of each case such as environmental conditions tend to become tautological In the extreme, "explanations" consist of listings of all the determinants of trade and there are no hypotheses or theories to test' [5] The Vent for
Surplus model advances the notion that a country may have 'free" some
commodity or unused resources which can be used to generate export earnings The Availability approach suggests that comparative advantage is determined by the availability in a particular country of scarce resources or commodities, e g Saudi Arabia has surplus reserves of oil and hence is a major oil exporter These approaches have some value in explaining trade flows but they do not have the same broad explanatory power as the hypotheses reviewed earlier However, since agricultural exports constitute almost half of Irish net exports, natural resources will be included in the subsequent analysis of the determinants of Ireland's comparative advantage
Comparative advantage and competitiveness
indicators should indicate the cost structure at which these resources will be utilised
The differences between the two concepts can be illustrated by the following somewhat stylised and simplistic example interpreted according to the Heckscher-Ohlin model We have two countries A (capital-rich) and B (labour-rich) Prior to the opening of trade both countries manufacture and consume two commodities K (capital-intensive) and L (labour-intensive) When trade opens up between the two countries, resources in A shift from the production of L to K and A exports K to B
The opposite sequence takes place in B A avails of a comparative advantage in the production of K and B makes use of a comparative advantage in the production of L In this example the countries are assumed not to specialise Because of the assumption of declining marginal rates of substitution of one factor for the other, the transfer of production resources in both countries will stop at the point where world prices and domestic prices of both products become equal
Suppose that the relative cost of labour increases in B but not in A As a result B suffers a loss in labour cost competitiveness compared to A Producers in B now find that the shift of production towards L (the labour-intensive product) is less attractive The point of equality between domestic and world prices now corresponds to a lower level of trade, in particular of exports of L from B to A In the strict Heckscher-Ohlin model, the assumption of full employment of resources would also require that production in A would shift back towards L and A would export less K to B Both countries would suffer welfare losses However, in a real multi-country world which allows for less than full employment of resources what would happen is that exports of L from B would lose market share to producers from A and other countries The short-run consequence of B's loss in labour cost competitiveness would be unemployed labour in that country
Relevance to policy
Both the concepts of competitiveness and comparative advantage are impdrtant If cost structures in a country are not competitive, its industry will lose market share in the short run If an economy does not adjust to losses in labour competitiveness, the result will be unemployment and/or labour emigration and the export of capital and a fall in living standards
Comparative advantage has a more strategic character Two points are important
First an economy will be most efficient and welfare at its highest if its production of goods and services is consistent with its comparative advantage Therefore government policy should favour comparative advantage (The measurement of comparative advantage is however a problem which is discussed in Section 3) The history of protection both internationally
(particularly in LDCs) and in Ireland indicates that welfare losses result when systems of incentives are distorted in favour of products in which a country has a comparative disadvantage
Second, despite impressions to the contrary given by presentations of some of the models (including the Ricardian and Heckscher-Ohlin models), comparative advantage is a dynamic concept As Balassa [6] has argued the structure of a country's comparative advantage and exports will change with the accumulation of labour and capital The most notable example of this process is Japan which has progressed since the 1950's from being a low-cost producer of labour-intensive goods to its present position of strong comparative advantage in physical-capital and knowledge-intensive goods
3 MEASUREMENT OF COMPARATIVE ADVANTAGE AND THE CLASSIFICATION OF INDUSTRIAL SECTORS
It is difficult to devise or interpret measures or other indicators of comparative advantage The problem arises from the fact that is is specified with regard to pre-trade relative prices while empirical research has to deal with data generated by trade flows which have already taken place These, in turn, may be influenced by distortions such as protective barriers and export subsidies For this reason indicators such as export/import ratios, distribution of exports among different commodity groups, market shares etc , have limitations as measures of comparative advantage
Balassa's concept of revealed comparative advantage [7], [8] gets over some of these problems He defines the revealed comparative advantage of a country in a particular industrial commodity as the share of that country's exports in that commodity divided by the share of its manufacturing industry in world trade in manufactures, i e for a given country and commodity category the RCA export performance index is expressed as follows
RCA index = L / iiL 100
Xi value of exports of commodity (i) from the particular country Xiw value of "world" exports of commodity (i)
Xm value of exports of all manufactures from the particular country
Xmw value of "world" exports of manufactures
The RCA index is, of course, an ex-post rather than ex-ante indicator or performance Subject to this important qualification it is a reasonable indicator Biases caused by import restrictions are corrected to some extent by the liberalisation in world trade in manufactured products and the use of export value ratios Because of its limitations, we will not focus attention exclusively on whether or not a particular industry exhibits index values greater than 100 The ranking of industries according to index values and changes in these values over time can also be significant A list of RCA values for the export of manufactures from Ireland covering the period 1969-1982 is given in Appendix 1
Classification of industrial sectors by factor-intensity
We can use these data to find out which, if any, of the theoretical models provides the most plausible explanation of the pattern of Irish exports In doing so we will focus attention on three of the models - natural resource based, Heckscher-Ohlin and product cycle These three models have different determinants of comparative advantage - natural resource availability and cost (resource-based hypotheses), capital-labour ratio (Heckscher-Ohlin) and requirements for and availability of skilled labour (product cycle [13]) The link between the list of RCA values for individual industrial sectors and the determinants of comparative advantage was provided by the classification of industries according to their factor intensities shown in Appendix 2 This classification was derived using data for Irish industry Relative capital and labour intensities were assigned to the industrial sectors using the results of a correlation exercise involving rankings of the sectors according to values of the remainder of net output2 per employee and aggregate investment per employee Skill intensities were assigned on the basis of the results of a ranking correlation between sectoral data for wages and salaries per employee and the proportion of skilled employees in the total sectoral workforce Two criteria were used to characterise resource intensive industries The first was the value of materials for processing as a proportion of the value of gross output The second consisted of characteristics such as bulk, perishability and local availability of the raw materials used by these industries A detailed account of the methodology and the data sources used is given elsewhere [12]
4 ANALYSIS OF THE PATTERN OF REVEALED COMPARATIVE ADVANTAGE OF IRISH EXPORTS OF MANUFACTURES 1969-1982
The industries3 recording a revealed comparative advantage during at least one or more of the sub-periods chosen in this study are listed in Appendix 3 This table also includes data on the shares of world exports accounted for by the Irish industries as well as their factor and resource intensities An overview of these results is given in the following Table 1
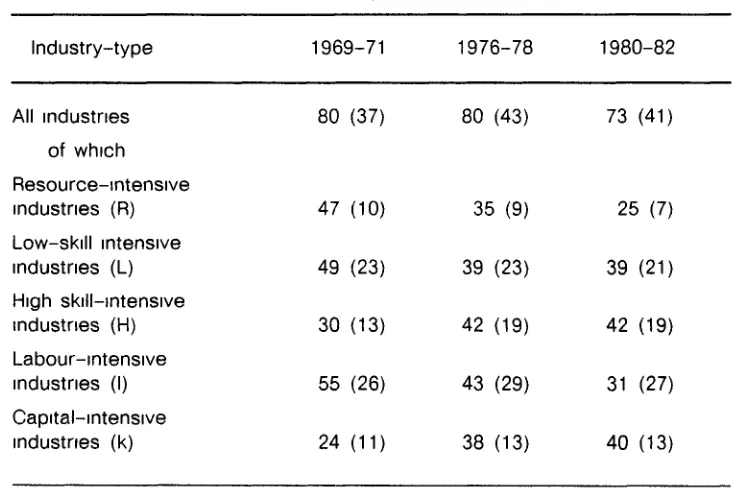
Table 1 Irish export industries recording a revealed comparative advantage (1969-71) to (1980-82) changes in the distribution of
factor intensities
(Exports as a percentage of all Irish exports of manufactures, number of industries in parentheses)
Industry-type 1969-71 1976-78 1980-82
All industries 80 (37) 80 (43) 73 (41)
of which
Resource-intensive
industries (R) 47 (10) 35 (9) 25 (7)
Low-skill intensive
industries (L) 49 (23) 39 (23) 39 (21)
High skill-intensive
industries (H) 30 (13) 42 (19) 42 (19)
Labour-intensive
industries (I) 55 (26) 43 (29) 31 (27)
Capital-intensive
industries (k) 24 (11) 38 (13) 40 (13)
Note Totals do not add up because individual industries are classified under
more than one category
The significant trends in revealed comparative advantage shown in Table 1 are
the decline over time in the importance of resource-intensive industries (R)
a decline in the share of low skill-intensive industries (L) and and an increase in the importance of high skill industries (H),
and
a shift away from labour-intensive industries (I) towards capital intensive industries (k)
Resource-intensity
preparations industry (011-013, SITC) The value of the RCA index for this industry inclined by almost 30 per cent Interestingly this was not due to a decline in the Irish industry's share of world markets but rather due to a decline in its share of Irish manufactured exports (see Appendix 3) The rate of growth in the value of world exports of this commodity was also significantly below average
Table 2 Resource-intensive export industries showing a revealed comparative advantage (1969-71) to (1980-82)
(Irish exports industries showing a revealed comparative advantage as a percentage of total Irish exports of manufactures numbers of industries in parentheses)
Industry-type
Resource-intensive industries (R)
of which
RLI (resource, low-skill and labour intensive)
RHI (resource, high-skill and labour-intensive)
RHk (resource, high-skill and capital-intensive)
RLk (resource, low-skill and capital-intensive)
1969-71
47(10)
28(4)
4(3)
14(3)
0(0)
1976-78
35 (9)
19(3)
2(2)
15(4)
0(0)
1980-82
25 (7)
14(3)
1(2)
10(2)
0(0)
Note Totals may not add up due to rounding and non-specification of SITC
category 895 (Office and Stationery Supplies not elsewhere specified)
Within the resource-intensive category the decline in the share of export industries with a revealed comparative advantage was least pronounced for the high skill, capital-intensive (RHk) group The exports of this sub-group are mainly accounted for by the following industries (SITC Rev 1 code in parentheses)
dairy products (022-024)
alcoholic beverages (122)
feeding stuffs for animals (081)
sugar preparations and honey (061-062)
The share of the high skill, labour intensive resource-intensive group (RHI) declined from 4 percent to 1 per cent of manufactured exports Cocoa and chocolate preparations (0722, 3, 073) are the principal commodities within this sub-group
[image:11.479.54.422.132.612.2]Labour and physical capital intensity
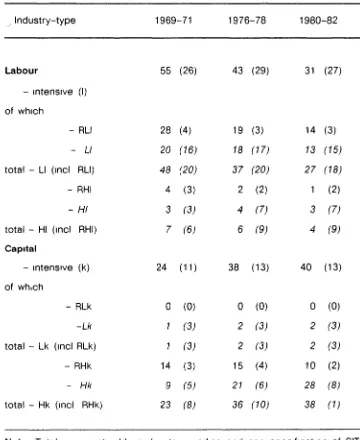
Table 3 categorises the RCA data according to the relative labour or capital intensities of the industry groups The main trends evident from this table are
(1) The increasing export share of capital-intensive industries (k) accompanied by a corresponding decline in the relative importance of the labour-intensive industries (I),
(2) The increase in the export share of the capital-intensive industries is due almost entirely to the increased importance of the high-skill, capital-intensive (Hk) sub-group By the end of the period this sub-group accounted for the single largest share of Irish manufacturing exports
(3) The low-skill, capital-intensive (Lk) sub-group remained relatively unimportant during this period while, as noted previously, the share of the RHk category declined,
(4) The decline of the relative importance of the labour-intensive industries was spread across three of the four categories within this group viz
Decline in share of
Industry-type in s h exports of
manufactures
RLI (Resource-intensive, low-skill,
labour-intensive) - 14%
LI (Low-skill, labour-intensive) - 7%
RHI (Resource-intensive, high-skill,
labour-intensive) - 3%
Table 3 Export industries showing a revealed comparative advantage (1969-71) to (1980-82), labour and physical capital intensity
(Irish export industries showing a revealed comparative advantage as a percentage of total Irish exports of manufactures, number of industries in parentheses)
^Industry-type 1969-71 1976-78 1980-82
Labour 55 (26) 43 (29) 31 (27)
- intensive (I)
of which
- RLI
- LI
total - LI (incl RLI)
- RHI
- HI
total - HI (incl RHI)
Capital
- intensive (k) 24 (11) 38 (13) 40 (13)
of wh.ch
- RLk
-Lk
total - Lk (incl RLk)
- RHk
- Hk
total - Hk (incl RHk)
Note Totals may not add up due to rounding and non-specification of SITC
category 895 (Office and Stationery Supplies not elsewhere specified)
28
20 48
4
3
7
(4)
(16) (20)
(3)
(3) (6)
19
18 37
2
4
6
(3)
(17) (20)
(2)
(7) (9)
14
13 27
1
3
4
(3)
(15) (18)
(2)
(7) (9)
0
1 1
14
9
23
(0)
(3) (3)
(3)
(5) (8)
0
2
2
15
21 36
(0)
(3)
(4)
re;
(70J
0
2
2
10
28
38 (0)
(3) (3) (2) (8)
(D
(a) High-skill, capital-intensive (Hk)
The increase in the relative importance of this sub-group is due to the growth of three industries viz
Commodity Code (SITC
Rev 1)
Description
Increase in percentage share of Irish exports
Value of RCA index (1980-82)
099
512
714
Food preparations not elsewhere specified
Organic chemicals
Office machines
3
7
10
1,499
288
491
[image:13.477.54.420.290.557.2]The increased revealed comparative advantage shown by these three industries reflected increases in their share of Irish manufactured exports and of world trade in these commodities - see Table 4
Table 4 Increasing importance of Irish exports of high-skill, capital intensive (Hk) industries
Commodity Code (SITC
Rev 1)
099 512 714
Description
Food preparations not elsewhere specified
Organic chemicals
Office machines
Exports of Irish manufactures
Percentage share of Irish export of manufactures
1969-71 1980-82
0 54 3 6
0 34 7 49
0 32 10 27
100 00 100 00
Irish exports as a percentage of world exports
1968-71
1 04
0 06
0 06
0 35
1980-82
8 41
1 62
2 74
0 56
Table 5 Irish exports of meat and dairy products
Commodity Percentage Irish exports Code (SITC Description share of as a percentage
Rev 1) Irish export of world exports of manufactures
1969-71 1980-82 1968-71 1980-82
011-013 Meat and meat preparations
022 024 Dairy products
Exports of Irish manufactures 25 9 100 12 03 00 13 8 100 01 17 00 4 3 0 26 05 35 4 4 0 87 62 56
(b) Low-skill, labour-intensive (Lk)
The declining importance of this sub-group is mainly accounted for by 5 industries - see Table 6
Table 6 Share of low-skill, labour-intensive, export industries showing a revealed comparative advantage 1969-71 to 1980-82
Commodity Code (SITC Rev 1) 651 657 662 725 841 Description
Textile yarn and thread
Floor coverings, tapestries etc
Clay and refractory construction materials
Domestic electrical equipment
Clothing, except fur clothing
[image:14.477.64.424.333.608.2]All of these Irish industries showed declining RCA values even though two -textile yarn and thread and domestic electrical equipment - increased their share of world exports This increase was not sufficient to offset the effect on the RCA index of the declining share of these commodities in the exports of Irish manufactures
(c) High-skill, labour-intensive (HI)
In contrast with the other sub-groups in the labour-intensive category, the industries with a revealed comparative advantage in this sub-group maintained their (admittedly modest) share of manufactured exports The number of industries with RCA index values greater than 100 in this sub-group also increased - see Table 7 The increase in world market share of Irish manufacturers in the essential oils, perfumes and flavour materials (551 SITC Rev 1) sub-group is particularly striking
Skill intensity
Table 7 High-skill, labour-intensive (HI) export industries showing a revealed comparative advantage (1969-71) to (1980-82)
o
CD
Commodity Code
642
665 892 091 111
551
723
Description
Articles of pulp, paper or paperboard
Glassware
Printed matter
Margarine and shortening
Non-alcoholic beverages not elsewhere specified
Essential oils, perfumes and flavour materials
Equipment for distributing electricity
Exports of Irish manufactures
Percentage share of Irish export of manufacture
1969-71
0 64
1 12
1 05
0 07
0 03
0 02
0 20
100 00
1980-82
0 45
0 72
0 78
0 07
0 13
0 96
0 61
100 00
Irish exports as a percentage of world exports
1969-71
0 58
1 48
0 47
0 33
0 32
0 04
0 17
0 35
1980-82
0 60
1 70
0 70
0 78
1 19
4 22
0 79
0 56
Value of RCA index
1969-71
167 421 134 95
91
11
51
1980-82
107 304 126 141
211
752
Table 8 Export industries showing a revealed comparative advantage (1969-71) to (1980-82), skill intensity
(Irish industries showing a revealed comparative advantage as a percentage of total Irish exports of manufactures, number of industries in parentheses)
Industry-type 1969-71 1976-78 1980-82
High skill
of which
- total HI
- total Hk
Low-skill
of which
- total LI
- total Lk
industries (H) - RHI - HI (incl RHI) - RHk - Hk (incl RHk) industries (L) - RLI - LI (incl RLI) - RLk - Lk (incl RLk) 30 4 3 7 14 9 23 49 28 20 48 0 1 1 (13) (3) (3) (6) (3) (5) (7) (23) (4) (16) (20) (0) (3) (3) 42 2 4 6 15 21 36 39 19 18 37 0 2 2 (19) (2) (7) (9) (4)
re;
(10) (23) (3) (17) (20) (0) (3) (3) 42 1 3 4 10 28 38 29 14 13 27 0 2 2 (19) (2) (7) (9) (2) (8) (10) (21) (3) (15) (18) (0) (3) (3)Note Totals may not add up due to rounding and non-specification of SITC
5 WHICH HYPOTHESIS?
The most important trends shown in the data reviewed to date are
decreasing importance of resource-intensive industries,
increased importance of capital-intensive industries,
increased importance of high-skill industries
This analysis is in line with the expected result that as the Irish economy developed6 natural resources availability would become less important as a determinant of comparative advantage A similar result was reported by the authors of a UN cross-country analysis for the period 1969-1978 [17] The results do not distinguish between the Heckscher-Ohlin and the more recent models (product cycle and neo-factor proportions) in terms of their ability to explain the shifts in Ireland's comparative advantage because the shift in revealed comparative advantage is most pronounced in the high-skill, capital-intensive (Hk) sub-group at a time of increasing skill and physical capital endowment levels7
Dynamic aspects of comparative advantage industries showing an improved RCA over the period 1969-71 to 1980-82
Tables 9 and 10 focus on those industries which as well as recording RCA values greater than 100 during 1980-82 also showed an increase in revealed comparative advantage over the period 1969-71 to 1980-82 There are 19 industries in this group and their share in total Irish exports of manufactures increased from 7 6 per cent in 1969-71 to 35 per cent in 1980-82 As in the earlier tables, the high-skill, capital-intensive (Hk) group shows a pronounced increase in export share but as in the previous case the formats do not help us to distinguish between the Heckscher-Ohlin and product-cycle hypotheses
Table 9 Dynamic aspects of comparative advantage - I
(Irish export industries showing a revealed and increasing comparative advantage, labour and physical capital intensity)
Industry-type Percentage share of exports of industries in the group
1969-71 1980-82
Labour-intensive (I) 63 25 of which
- RLI 0 0 - LI 48 17 - total LI (incl RLI) 48 17 - RHI 12 3 - HI 3 5 - total HI (incl RHI) 15 8
Capital-intensive (k) 37 75
of which
- RLk 0 0
Lk 20 12
total Lk (incl RLk) 20 12
RHk 0 0
- Hk 17 63
Table 10 Dynamic aspects of comparative advantage - II
(Irish export industries showing a revealed and increasing comparative advantage, skill intensity)
Industry-type Percentage share of exports of industries in the group 1969-71 1980-82
High-skill industries (H) 32 71 of which
- RHI 12 3 - HI 12 3 - total HI (incl RHI) 15 8 - RHk 0 0
- Hk 17 63
total Hk (incl RHk) 17 63
Low-skill industries (L) 68 29 of which
- RLI 0 0
- LI 48 17
- total LI (incl RLI) 48 17 - RLk 0 0
- Lk 20 12
- total Lk (incl RLk) 20 12
An alternative test
The next line of enquiry arises from work done by Hirsch [18] He has shown that the Heckscher-Ohhn and product cycle models yield different hypotheses in respect of the relationships between national attributes and the comparative advantage of the four industry groups - Hk, HI, Lk and LI - in an economy with increasing capital and skill endowments - see Table 11 This table includes two variants of the product cycle model In the first, or so called extreme
version, skill-intensity alone is assumed to determine comparative advantage The second, which Hirsch [19] considers to be more realistic, assumes that as products mature, labour and capital endowments will become more important in determining comparative advantage This eclectic approach, is of course, reminiscent of the neo-factors proportions hypothesis mentioned earlier The presentation of the Irish data in the same format is shown in Table 12 The results are consistent with a very mild variant of the product cycle model However, a focus on the dynamic changes presents a profile much closer to the "extreme" product cycle model - see Table 13
Table 11 Predicted relationship between percentage share of the four industry groups in total manufacturing exports in an economy with increasing capital and skill endowments
Theoretical Model High-skiH (H) industries
Low-skill (L) industries
Hk HI Lk LI
Heckscher-Ohlin
Product Cycle-extreme version Product Cycle-mild version
( + ) = increasing percentage share (-) = decreasing percentage share
Table 12 Irish manufactured exports 1969-1982, change in percentage share of industry groups in total exports of manufactures
Theoretical Model High-skill (H) industries
Low-skill (L) industries
Industries recording a revealed comparative advantage
- change in percentage share (absolute change)
- proportionate change in percentage share
Hk H! Lk LI
+ 19 No change + 1 - 7
[image:21.478.53.422.180.395.2]Table 13 Irish manufactured exports 1969-1982, change in percentage share of industry groups in total exports of industries recording an increased revealed comparative advantage
Theoretical Model High-skill (H) Low-skill (L) industries industries Hk HI Lk LI
Change in percentage share
(absolute change) + 4 6 +2 - 8 - 31
Proportionate change in
percentage share + 271 % + 67 % - 40 % - 65 %
Comparison of the profiles
The increase in importance of the Hk sub-group is the most striking feature of Tables 12 and 13 The growth of the two principal industries in this sub-group - organic chemicals and office machines - is due to the export activities of foreign owned enterprises located in Ireland
The two profiles show different patterns in respect of the low-skill capital-intensive (Lk) group The modest increase in share of this group shown in Table 12 reflects gains in comparative advantage and export share made by three industries - synthetic and re-generated fibres (SITC 266), chemical materials and products not elsewhere specified (SITC 599) and woven cotton fabrics (SITC 652) - see Table 14 Ireland's comparative advantage and competitive position (as indicated by world market share) in these three industries improved over the period under review Foreign-owned firms such as Asahi Spinners and Burlington Industries contributed significantly to the growth of these industries in Ireland These two commodity groups showed a slower than average growth rate - see Table 14 As a result they were overshadowed by faster growing sectors in the dynamic framework The two profiles (Tables 12 and 13) also present different impressions of the performance of the high-skill, labour-intensive (HI) sub-group This can be easily explained Table 12 reflects the fact - see Table 8 that the industries in this sub-group with a revealed comparative advantage maintained their share of manufactured exports Since this took place against a background of (i) rapid growth in the exports of the Hk sub-group and (H) a significant growth in Irish exports of manufactures8, the presentation in Table 12 which is based on
Table 14 Export performance of principal low-skill, capital-intensive (Lk) industries in Ireland
SITC Code
Description
RCA index Share of Irish exports of manufactures
Share of world exports of manufactures
Percentage growth in value (US$) of
world exports (1969-71) to (1980-82)
1969-71 1980-82 1969-71 1980-82 1969-71 1980-82 World Average
266 Synthetic and regenerated fibres
599 Chemical materials and products not elsewhere specified
652 Cotton fabrics woven
655 Special textile fabrics and related products
661 Lime cement building materials excl glass and clay
694 Nails screws nuts bolts rivets
29 294 0 13 0 90 0 10 1 65
63 91 0 74 2 28 2 22 0 51
87 219 0 62 110 0 65 0 92
123 100 0 57 0 36 0 43 0 56
116 39 0 30 0 14 0 40 0 22
168 57 0 44 0 12 0 58 0 32
300
1 188
326
365
721
export share, tends, in contrast with Table 13, to understate the improved export performance of this category
During the period between the late 1960's and early 1980's the export performance of Irish manufacturing industry tends to be closer to predictions of the product cycle rather than those of the Heckscher-Ohlin model The conclusion is in line with those drawn by Farley [20] and Teeling [21] These studies were based on data for earlier periods and, it can be plausibly argued, reflect the Irish manufacturing sector at an earlier stage of development
Farley, using data for the mid-1960's, concluded that in terms of the product cycle spectrum of manufacturing activity Ireland had specialised in the export of mature standardised commodities Teeling found that the detailed sectoral distribution of new foreign industries in Ireland in 1954-71 bore a close resemblance to the labour-intensive export industries established in less developed economies This was consistent with the interpretation that during that period Ireland's comparative advantage lay in the availability of low-cost labour for the manufacture of mature products In terms of the presentation which we used earlier the conclusions of these and other studies9 reflected a "mild" variant of the product cycle model as an explanation of Irish export performance during the 1960's Analysis of the more recent data, however, suggests a shift in comparative advantage towards the manufacture of new products requiring high-skill labour although the essential feature of the mild product cycle model is retained in that factor proportions also continue to influence Irish comparative advantage
R + D expenditures
Comparative data for R + D expenditures tend to support this eclectic view of the determinants of comparative advantage According to a 1985 OECD report [23] R + D indicators are the best available proxy for innovative activities in econometric models Proponents of the neo-technological explanations of comparative advantage have stressed the importance of innovative activity alongside with human capital (i e skilled-labour) as one of the most important factors shaping the comparative advantage of advanced industrial economies The data in Table 15 shows that in comparative terms Ireland ranked at the bottom of a group of OECD countries in terms of R + D activity in industry While R + D expenditures increased as a proportion of value added in the period since 1971, the improvement was not sufficient to change Ireland's position in the ranking The data in Table 16 suggest, however, that the sectors dominated by foreign firms - electrical and electronics and chemicals, were responsible for the (admittedly modest) increase in R + D expenditures This is confirmed by the 1985 OECD review of the Irish economy [24] which states that over half the R + D in Irish manufacturing industry is carried out by foreign-owned firms
An important conclusion which can be drawn from this and preceding sections is that foreign investment in Irish industry has been associated with an increase in skill levels or human capital in Irish industry but that it has not been accompanied by as marked an increase in innovative activity This conclusion as well as the high R + D rankings for US, Japan, Germany and the UK, are consistent with the conventional product cycle thesis that MNEs will tend to concentrate R + D activities in their principal markets
Table 15 Manufacturing industries R + D expenditures as a percentage of value added for a selection of OECD member countries
1969 1981
United States
Japan
FRG
France
United Kingdom
Italy Canada
Australia
Netherlands
Sweden
Belgium
Denmark
Norway
Finland
Ireland
7 4
2 9
3 3
3 4
4 7
1 6
2 1
-4 1
2 9
2 5
2 1
2 0
1 4
0 07*
7 7
4 9
5 4
4 4 6 6
1 7
2 4 0 9
5 6
6 3
3 8**
2 6
3 0
2 5
1 0
Sources OECD/STIU DATA Bank - May 1985
Data for Ireland derived from data supplied by NBST and CSO
* 1971 data for Ireland ** 1979 data for Belgium
Table 16 Sectoral Distribution of R + D in Irish manufacturing industry
Percentage share in total R + D Industry in manufacturing industry
1969 1981
Electrical and electronics (incl
machinery)
Food, drink and tobacco
Chemicals
Basic metals
Other manufacturing
Rubber and plastics
Transport
Textiles and clothing
14 26 12 5 22 4 5 7
75 90 99 66 54 90 10
14
34 20 19 6 6 6 3 3
17 04 19 70 43 25 95 27
Source Derived from data supplied by NBST
Profit repatriations
The outflow of payments under the heading "Profits, Dividends and Royalties has increased dramatically since 1980 - see Table 17
Table 17 Trading and Investment Income, Debit or Outflow, 1980-86 ( £ million)
National Debt Interest Other Interest Profits Dividends Royalties
Profits etc as % of GDP 1980
193 381
258 2 8
1981
266 455
362 3 2
1982
526 498
499 3 7
1983
597 490
659 4 5
1984
720 598
983 6 0
1985
795 612
1 321 7 6
1986
761 588
1 346 7 4
Source "Determinants of Profit Outflows from Ireland" E O'Malley & S
Scott in "Medium Term Review 1987-1992" No 2, Economic and Social Research Institute, 1987
O'Malley and Scott have shown that the trend in these outflows can be related to the sales and exports of the high technology sectors dominated by foreign enterprises [25] This relationship and the high profit rates recorded by some foreign owned firms in these sectors [26] are consistent with the product cycle model
Many of these firms will have incurred considerable research and development costs as well as marketing and distribution costs outside of Ireland in respect of the products which are now being exported from Ireland but under the corporate tax regime applying to manufacturing companies they have little incentive to assign these expenditures as production costs to their Irish operations O'Malley and Scott are therefore quite correct in stating "that the term "profits" could be somewhat misleading in the present context" [27]
Ireland/Japan, trade in manufacturers
6 IMPLICATIONS FOR POLICY AND CONCLUSIONS
The product cycle explanation of Irish manufacturing export performance is consistent with the by now well established analysis of the development of the Irish manufacturing sector over the last quarter of a century or so The policy of attracting inward investment has resulted in considerable benefits in terms of increased exports and output Concern has, however, been expressed about the costs to the Exchequer of this policy, its net impact on employment and the degree of integration between the "new" industrial sectors and the rest of the economy
It is obviously essential to recognise the limitations of the restructuring which has taken place in Irish industry Equally so, good policy making should take account of the progress which has been made For example there is quite properly a concern with the quality of the grant-aided jobs created in the new industries but the shift in export revealed comparative advantage towards higher skilled industries does indicate some progress in the direction of creating a higher income manufacturing sector It is also worth noting the comments of an OECD review which broadly covered the same period as this paper
"The aggregate output of Irish manufacturing industry in the period 1975-1980 outstripped all other OECD countries except Portugal This growth was more than twice the average of the European Community, and made Ireland one of the leaders of a group of "newly industrialising" OECD countries Output growth was also positive in the particularly difficult 1980-1983 period Irish industrial output grew by 10 per cent over the period, compared with a 4 per cent fall for EEC countries combined Over this period the growth of industrial production was the highest recorded for any OECD country Perhaps more significantly, Ireland's apparent industrial performance has also been better than countries and regions against which it is competing in the race to attract foreign direct investment For example, Ireland's aggregate and sectoral performance has been considerably better than that of Scotland, particularly over the 1980-1983 period Ireland has a higher proportion of output in fast-growing electronics, chemicals and food-processing, and a lower proportion of output in traditional industries including mechanical engineering, textiles and clothing which experienced declines in both countries Ireland also experienced higher growth than Scotland in sectors dominated by foreign enterprises, particularly chemicals and electronics" [29]
Exclusive reliance on inward investment is not, however, a sufficient policy Even in the best of all possible worlds it is questionable if it would eventually result in a high valued added industrial sector which was well integrated with the rest of the economy The challenge is to build on the base which has been built up since the end of the protectionist era According to Bradley et al this effort will "within a reduced budget demand inspiration of a high order" [30] The continuing debate on industrial policy will hopefully spark the
"required" inspiration' The following paragraphs, which take the product cycle explanation as a starting point, are offered as a contribution to this debate The discussion which they contain is necessarily very tentative and far from exhaustive
(a) "Picking winners"
One school of thought argues with varying degrees of emphasis that governments should take a very active and interventionist role in industry According to this view governments should try to influence directly the structural composition of production and in particular select industries and firms with promising growth potential ("picking winners") This view was reflected in the Telesis Report which recommended that official government agencies should adopt a selective approach towards companies (as opposed to sectors) and become intimately involved in formulating their development strategies [31] The interventionist approach has been challenged on a number of grounds These include questioning the effectiveness of government intervention in dealing with market imperfections or failures and more fundamentally, the existence of some of these failures
There is also some scepticism about the ability of politicians and bureaucrats to make better investment decisions than managers and investors in the private sector
The rationale of the product cycle model, particularly as applied to the Irish situation, does not favour the interventionist viewpoint According to the product-cycle, an enterprise will tend to locate marketing, R + D and other key functions near its main markets In this context, Ireland's location and the small size of the Irish market constitute a comparative disadvantage To the extent that these aspects of comparative disadvantage distance decision makers from markets they increase the risk that "hands-on government investment in industrial projects may involve a misreading of market signals Also, our experience in this country has been that governments find it very difficult to disengage from unprofitable projects - particularly ones of significant size Active intervention by Irish governments in influencing the direction of R + D and marketing strategies could be highly risky and could lead to major claims on the public finances Leaving theoretical considerations aside, the extent of these risks, the present size of the public sector debt and the urgent need to reduce it to sustainable proportions preclude Irish governments over the medium-term from taking a lead role in determining industrial investment strategies at a sector or company level
This process is slow in generating jobs and increasing output But, it is supportive rather than interventionist in respect of its impact on individual companies and does not insulate the selected companies from market disciplines Accordingly, it is less likely to result in expensive failures than an outright interventionist "hands-on" policy
(b) Taxation
The study of the impact of taxation on economic performance is a complex and increasingly technical field of research Since 1980, considerable effort has been expended in this area, particularly in the United States and hopefully the work of economists in this field will be of increasing value to policy makers The discussion in the following paragraphs can only hope to touch on some of the important issues arising from the impact of taxation on industrial performance and location - I hope in a subsequent paper to discuss some of these issues in more detail
Corporate taxation
A low effective rate of corporate tax on manufacturing industry has been an important part of government industrial policy since 1956 This regime along with the freedom to remit profits overseas is clearly a powerful incentive in terms of the dynamics of the product-cycle model A company producing a product which has progressed beyond the early developmental stages will obviously be attracted by a tax regime which allows it to maximise the net profit (or operating surplus) from production Successive governments have agreed that the present reduced rate of corporation tax on profits from manufacturing should stay in place until the year 2000
However, an important question for future policy is whether a low corporate tax regime is consistent with the policy objectives of increasing the value added and skill content of the Irish operations of overseas companies as well as improving the corporate capacity of indigenous Irish firms
One view is that it isn't The high value added and the high-skill functions of manufacturing businesses include marketing, finance and research and development These do not generate revenue directly in the same sense as the production function but they create tax deductible costs Therefore, it can be argued that a tax-minimising and profit maximising MNE will tend to locate these activities in high-tax locations Taking this line of reasoning a further step it might even be argued that a low rate of corporation tax might encourage indigenous Irish firms, once they have reached a certain stage of development, to locate key business functions in other countries
It might be a mistake, however, to look at the investment decisions of firms from a corporate tax perspective only For example, other considerations such as proximity to the principal markets, the availability of skilled manpower, and the general scientific and technological environment (e g quality and size
comparatively recently it was believed that they cancelled one another out, i e that the net effect of taxation on labour supply was not significant This view is changing following the publication of technically sophisticated studies -particularly in the US [33] While there is now agreement that labour supply elasticities are greater than previously thought there is some disagreement as to their magnitudes and consequently on the sensitivity of labour supply and work effort to changes in tax rates
The theoretical analysis leads to a distinction between the effects of marginal and average tax rates The income effect will tend to be of more importance where changes in average income tax rates are concerned whereas the substitution effect will tend to be more powerful when changes are made in marginal rates, i e a rise in marginal tax rates will, particularly in the higher ranges, encourage a substitution of leisure for work, while a rise in average rates should induce an increase in work effort in order to compensate for the lost income Interestingly, estimates for the US and Sweden suggest that the revenue neutral replacement of the progressive tax schedules in these countries with proportional10 structures should induce increases in labour supply [34] and [35]
Income taxes also influence levels of output and employment by affecting the cost and hence demand for labour The combined demand and supply side effects operate through the tax wedge which income tax, PRSI and indirect taxes drive between the costs incurred by firms in hiring labour and the after-tax purchasing power of the wages received by employees The net effect of this wedge appears to be significant - for Ireland recent estimates by Murphy suggest that the increase in the tax wedge since 1979 has led to a fall of about 5 per cent in the numbers at work and an increase of about 3 75 per cent in the level of unemployment [36]
Table 20 Schedule and effective tax rates at the level of average earnings, married couple with two children - 1981
Australia
Denmark
France
Ireland
Japan
Switzerland
United Kingdom
Schedule rate applied to last unit of gross
earnings*
32 54 10 35 14 11 30
Average
excluding including non-standard tax reliefs
18 33 1 13 8 7 19
17 20 0 12 n a
7 15
- Excludes Social Security Contributions
Source The tax/benefit position of production workers (OECD 1984)
* No account is taken of non-standard reliefs
The comparison in Table 20 is even more interesting because the marginal rate experienced by the Irish proto-type household in this example is the lowest standard rate in the current Irish income tax rate structure Furthermore in 1981-82 only 14 1 per cent of income tax payers were subject to higher marginal rates whereas by 1987-88 this proportion is provisionally estimated to have risen to 44 3 per cent
The opportunities for shifting some of the income tax burden are, as mentioned previously, very limited Not only is there a need to restore balance to the public finances but the incidence of indirect taxation in this country is already very high Property taxation appears to be the only area offering a potential for increased yield In the period since 1970 the yield from property taxes in Ireland declined from 3 9 per cent of GDP (1970) to 1 5 per cent (1985) As a percentage of total tax receipts the proportion fell from 12 2 (above the OECD average) to 3 8 (below the OECD average) The reduction in the yield from domestic rates was the major contributory cause but other factors included the abolition of Estate Duties (1974) and their replacement by a Capital Acquisitions Tax, Capital Gains Tax and Wealth Tax The Wealth Tax was subsequently abolished One of the reasons stated for doing so was the view that it had a detrimental effect on investment and enterprise [39] Concern about the possible adverse effects of capital taxation on investment
and productive employment was also expressed in a Government planning document in 1984 [40] However, the stylised examples described in the footnote below11 suggest that while our income tax system makes it relatively difficult for wage or salary earners to accumulate wealth, the comparatively mild capital tax regime makes it easy to retain wealth The example in particular draws attention to the need to balance the incentive system between the rewards for capital assets (which may, or may not, be used productively) and the rewards for ability and enterprise (reflected in personal earnings) This is relevant to industrial policy because the quality of Irish management and other specialist functions such as R + D will have a crucial bearing on the achievement or otherwise of the industrial policy objective of developing a significant number of Telesis styled "indigenously-owned complex factor-cost" manufacturing businesses The perceived severity or otherwise of the income tax regime on higher than average incomes may have a considerable influence on the ability of Irish industry to reward and retain managers and other executives of the required high calibre
7 CONCLUSION
The principal conclusions which may be drawn from the data analysed in this paper are
(i) the comparative advantage of Irish manufacturing exports shifted strongly during the 1970's in the direction of high-skill, capital intensive (Hk) industries accompanied by a sharp decline in the importance of low-skill, labour-intensive (LI) industries,
(u) the decreasing importance during the same period of resource-inten-sive industries,
(in) foreign investment in Irish industry has been associated with a marked increase in skill levels or human capital in Irish industry but this has not been accompanied by a comparable increase in innovative activity However, the sectors dominated by foreign firms - electrical and electronic industry and chemicals - were responsible for the modest increase in R + D expenditures which was recorded
investment projects which had located in this country (particularly in the electronics sector) were mainly assembly-type low-skill operations with poorly developed linkages with the rest of the economy
The relevance of the product cycle model is not surprising The part which internationally mobile investment has played in promoting the growth of Irish industrial output, and more particularly the increase in manufactured exports, during the 1970's has been extensively studied Consequently, it is not surprising that the product cycle offers a plausible explanation of the export patterns which have resulted from the decisions of foreign (mainly US) enterprises in high-technology sectors such as electronics and chemicals, to locate manufacturing branches and subsidiaries in Ireland
The paper concluded with a tentative discussion which attempted to apply inferences from the product cycle model to some policy issues which are related to industrial development From a historical policy perspective the results in this paper are reasonably encouraging The combination of outward looking trade policies and the attraction of internationally mobile investment has shifted the revealed comparative advantage of Irish industry strongly in the direction of high-skill sectors At the end of the period under review Irish export industries employed a significantly higher proportion of high-skill employees than they did in the early 1970's The outward looking approach appears to have been considerably more effective than the previous import-substitution policy in raising skill levels within Irish industry This change in policy also induced substantial increases in output and exports The challenge now is to move to a qualitatively different plane of industrial development entailing the retention of a higher proportion of retained value added in the Irish economy
FOOTNOTES
1 These assumptions include linearly homogeneous production functions, identical in all countries, no factor intensity reversals, both countries incompletely specialised, factor immobility between countries, fixed factor supplies, perfect competition, no transport or information costs, no government - induced distortions and full employment of factors
2 Remainder of net output equals net output less wages and salaries and is used as a proxy for capital remuneration
3 The term "industries" as used in this text means industrial sectors not individual enterprises
4 It is derived as the secondary school enrolment rate plus five times the university enrolment rate in the respective age cohorts It has been used as a measure of human-capital intensity by Gruber and Vernon
[15] and Balassa [16]
5 Data on enrolment rates is not available for earlier years
6 Between 1970 and 1982 GDP per person at work increased from £3,036 to £3,922 [constant 1975 prices]
7 Between 1969 and 1982 the average investment ratio was 26%
8 Irish exports of manufactures accounted for 0 35 per cent of the value (US$) of "world" exports in 1969-71 This share had increased to 0 56 per cent by 1980-82
9 For example O'hUiginn [22] found that in the 1960's 78 per cent of new grant-aided branch plants had R + D performed by the parent organisation, 62 per cent had marketing done, 44 per cent had materials and components purchased and 33 per cent had them produced, while 40 per cent had accounts and finances looked after by the parent
10 Tax free threshold plus flat rate of tax
Appendix 1
RCA values for manufacturing industry (Ireland)
Commodity Code (SITC Rev 1)
Appendix 1 (contd )
RCA values for manufacturing industry (Ireland)
Commodity Code
(SITC Rev 1)
Appendix 1 (contd )
RCA values for manufacturing industry (Ireland)
Commodity Code
(SITC Rev 1)
Appendix 1 (contd ) RCA values for manufacturing industry (Ireland)
Commodity Code
(SITC Rev 1)
726 729 731 732 733 734 735 812 821 831 841 842 851 861 862 864 891 892 893 894 895 897 899 1969-1971 10 82 67 89 39 79 3 47 45 39 8 42 34 75 67 19 39 56 131 49 245 83 14 39 175 83 224 77 9 19 4 93 7 60 134 08 245 47 154 43 46 45 25 33 105 42 1976-1978 22 44 43 59 80 62 7 20 53 31 11 79 30 35 155 73 50 29 22 72 131 79 39 03 105 40 206 55 15 27 20 95 26 38 154 73 155 78 139 24 125 36 28 57 105 68 1980-1982 78 01 49 23 11 89 21 92 51 39 9 03 9 43 146 27 66 69 35 02 101 83 16 67 73 01 211 81 53 61 18 65 49 23 125 78 158 49 204 09 177 54 82 49 75 23
Notes to Appendix 1
(1) The definition of manufacturing industry used in this table has previously been used in UN studies [9], [10], it has the merit from an Irish perspective that it includes exports of agricultural based industries which are excluded from other definitions
(2) Three year averages are used to reduce sensitivity of the index to year to year fluctuations j
(3) The totals for world exports are taken from the most comprehensive source available [11] and exclude export data from the centrally planned economies
Appendix 2
Classification of industries by resource, skill and factor-intensity
SITC Code (Rev 1) 011-013 022-24 032 0422 046 047 048 052 053 055 061 062 0713 0722/3 073 074 081 091 099 111 112 122 Commodity (industry)
Meat and meat preparations
Dairy Products
Fish and fish preparation
Rice, glazed or polished
Meal and flour of wheat or of meslin
Meal and flour of cereals
Cereal preparations
Dried fruit
Fruit, preserved and fruit preparations
Vegetables, preserved or prepared
Sugar and honey
Sugar confectionery
Coffee extracts, essences etc
Cocoa powder (unsweetened), butter and paste
Chocolate etc
Tea and mate
Feeding stuff for animals
Margarine and shortening
Food preparations not elsewhere specified
Non-alcoholic beverages, not elsewhere specified Alcoholic beverages Tobacco manufactures Type RES R R R R R R R R R R R R* R R code SK L H L H H L H H H H H H H H H H H H H H Fl I k I k k I I I k I k I I k I k I k k
* imported raw materials
Appendix 2 (contd )
Classification of industries by resource, skill and factor-intensity
S I T C Type code
Code Commodity (industry) (Rev 1)
RES SK Fl 2219 Flour and meal of oil seeds etc R H I 2312 Synthetic rubber etc L I 243 Wood, shaped or simply worked R L I 251 Pulp and waste paper
-2626-8 Wool shoddy, wool or other animal hair,
wool tops R L I 266 Synthetic and regenerated fibres L k 332 Petroleum products R* H k 411 Animal oils and fats R H I 421 Fixed vegetable oils, soft R H I 422 Other fixed vegetable oils R H I 431 Animal and vegetable oils, processed etc R H I 512 Organic chemicals H k 513 Inorganic chemicals, elements etc H k 514 Other inorganic chemicals H k 515 Radioactive materials etc NC 521 Mineral tar etc R* H k 531 Synthetic organic dyestuffs etc H k 532 Dyeing and tanning extracts etc NC 533 Pigments, paints etc H k 541 Medicinal and pharmaceutical products H k 551 Essential oils etc H I 553 Perfumery and cosmetics H k 554 Soaps, cleansing and polishing preparations H k 561 Fertilisers, manufactured H k
Appendix 2 (contd )
Classification of industries by resource, skill and factor-intensity
SITC Oode (Rev 1) 571 581 599 611 612 613 621 629 631 632 633 641 642 651 652 653 654 655 656 657 661 662 Type Commodity (industry) RES Explosives etc
Plastic materials etc
Chemical materials and products not elsewhere specified ?
Leather
Manufactures of leather not elsewhere specified
Fur skins, tanned or dressed R
Materials of rubber
Articles of rubber not elsewhere specified
Veneers, plywood etc
Wood manufactures not elsewhere specified
Cork manufactures
Paper and paper board
Articles made of paper etc
Textile yarn and thread
Cotton fabrics
Textile fabrics, other than cotton
Tulle, lace, embroidery etc
Special textile fabrics etc
Made-up articles of textile materials not elsewhere specified
Floor coverings, tapestries etc
Lime, cement etc
Clay construction materials etc
code SK NC L L R R L L L L L L H H L L L L L L L L L Fl I k I I I I I I I I I I I k I I k I I k k
* imported raw materials
Appendix 2 (contd )
Classification of industries by resource, skill and factor-intensity
SITC Code (Rev 1) 663 664 665 666 671 672 673 674 675 676 677 678 679 681 682 683 684 685 686 687 689 691 Commodity (industry)
Mineral manufactures not elsewhere specified
Glass
Glassware
Pottery
Pig iron etc
Primary forms of iron and steel
Iron and steel bars etc
Universals etc of iron and steel
Hoop and strips of iron and steel
Rails etc
Iron and steel wire
Tubes, pipes of iron and steel
Type
RES
Iron and steel castings etc not elsewhere specified
Silver, platinum etc
Copper Nickel Aluminium Lead Zinc Tin
Miscellaneous non-ferrous metals
Finished structural parts not elsewhere specified R* R* R* R* R* R* R* R* code SK H H H L NC L L L L L L L L L L L L L L L L L Fl k k I I I I I I I I k I I I I I I I I I I