Munich Personal RePEc Archive
The Dynamic Linkage between CO2
emissions, Economic Growth, Renewable
Energy Consumption, Number of Tourist
Arrivals and Trade
Ben Jebli, Mehdi and Ben Youssef, Slim and Apergis,
Nicholas
University of Tunis El Manar, FSEG de Tunis, Manouba University,
ESC de Tunis, Curtin University, Perth Australia
9 July 2014
Online at
https://mpra.ub.uni-muenchen.de/57261/
The Dynamic Linkage between CO
2emissions, Economic Growth,
Renewable Energy Consumption, Number of Tourist Arrivals and
Trade
Mehdi Ben Jebli
University of Tunis El Manar, FSEG de Tunis, Tunisia University of Jendouba, ISI du Kef, Tunisia
(00216) 21040246 benjebli.mehdi@gmail.com
Slim Ben Youssef
Manouba University, ESC de Tunis Campus Universitaire, Manouba 2010, Tunisia
(00216) 97363596 slim.benyoussef@gnet.tn
Nicholas Apergis
Curtin University, Perth Australia
(0061) 8 9266 4034
Nick.Apergis@curtin.edu.au
First version: July 9, 2014
Abstract
This study explores the relationship between carbon dioxide (CO2) emissions, economic
growth, renewable energy consumption, the number of tourist arrivals and trade in Central and South America spanning the period 1995-2010. We apply panel cointegration techniques and panel Granger causality tests to investigate the relationship across the variables both in the short- and in the long-run. The empirical findings reveal the presence of a long-run relationship across the variables under investigation. Furthermore, short-run dynamics show a
unidirectional causality running from renewable energy consumption to CO2 emissions and
from renewable energy consumption to trade. In addition, there is a unidirectional short-run causal link without feedback effects from economic growth to trade and the number of tourist arrivals as well as a unidirectional causality running from the number of tourist arrivals to trade. In the long-run, there is evidence of bidirectional causality between emissions, renewable energy consumption and the number of tourist arrivals. Long-run estimates highlight that both the number of tourist arrivals and renewable energy consumption contribute to the reduction of emissions, while both real GDP and trade contribute to the increase of emissions.
Keywords: carbon dioxide emissions; renewable energy consumption; tourist arrivals; trade.
The Dynamic Linkage between CO
2emissions, Economic Growth,
Renewable Energy Consumption, Number of Tourist Arrivals and
Trade
1. Introduction
The causal relationship between an environmental indicator (CO2), economic growth,
renewable energy consumption, tourism variables and trade has recently started to be investigated in the literature of energy economics. The interdependence across these variables has not been discussed extensively in the relevant literatures. Therefore, the goal of this study is to explore the short- and long-run causality relationships across these variables and to investigate the role that tourism activities and trade can both play to mitigate climate changes when renewable energy is used for production purposes.
The dynamic causal link between economic growth and renewable energy consumption has been investigated in numerous econometric studies. In these papers, the role that renewable energy plays is vital and significant either in terms of decreasing greenhouse gas emissions or in terms of economic growth. According to these results, we deduct that the short- and long-run dynamic relationship between these two variables depends on the data set used, on the empirical methodologies employed, and on the selected samples and set of variables included in a model framework. In addition, the direction of causality between economic growth and renewable energy consumption is summarized in four hypotheses: i) the feedback hypothesis which suggests that there is a correlation between the two variables and which indicates that renewable energy consumption affects economic growth, while the development of economic activities will impact the progress of renewable energy consumption (Apergis and Payne, 2010a,b; Al-Mulali et al., 2014), ii) the neutrality hypothesis which reveals that no causality between these variables is present (Bowden and Payne, 2010; Ben Aïssa et al, 2014), iii) the conservation hypothesis which argues that there is a unidirectional causality running from economic growth to renewable energy consumption, implying that any increase in real GDP increases renewable energy consumption (Sadorsky, 2009b; Ocal and Aslan, 2013), and iv) the growth hypothesis, according to which there is unidirectional causality running from renewable energy consumption to economic growth. This hypothesis suggests that a policy of renewable energy consumption deceleration is expected to have a negative impact on economic growth (Payne, 2011).
The impact of both renewable energy consumption and economic growth on the environmental quality has been also investigated by a great number of studies. Their empirical findings document that renewable energy consumption can play a vital role in the reduction of pollution; however, the use of clean energy has not reached a share where it can substantially contribute to reduce emissions levels (Menyah and Wolde-Rufael, 2010). For a panel of OECD countries, Shafiei and Salim (2014) show that renewable energy consumption
decreases carbon dioxide (CO2) emissions, whereas non-renewable energy consumption
increases theseemissions. In another study, it is revealed that the major drivers of renewable
energy consumption are found to be real GDP and CO2 emissions (Sadorsky, 2009a).
between them. They recommend that authorities should encourage the use of renewable energies and trade in order to increase economic growth levels in these countries. Contrary to the finding of Ben Aïssa et al. (2014), for a panel including 18 Latin American countries, Al-Mulali et al. (2014) show the presence of a bidirectional causality relationship between renewable energy consumption and total trade in the long-run. They also suggest that renewable energy consumption is more significant than non-renewable energy consumption in increasing economic growth.
Searching for the nexus between CO2 emissions, economic growth and renewable energy
consumption is one of the most intrigues issues in the literature of energy economics. The current literature that investigates the causal link between these variables is not only very recent, but also highly limited. However, the relationship between emissions and renewable energy consumption merits further consideration, given that international tourism is one of the motivating factors that may have positively contributed to economic growth as well as to the reduction of environmental quality. In the case of Turkey, the long-run relationship between international tourism and real GDP has been investigated by Katircioglu (2009). Using bounds tests and the Johansen cointegration approach, he finds the absence of any long-run equilibrium between tourist variables and economic growth.
Unlike renewable energy, the previous studies have considered the causal link between
CO2 emissions, energy consumption and economic growth. Katircioglu (2014) investigates
the long-run equilibrium relationship between tourism, energy consumption and
environmental degradation (CO2) in the case of Turkey in two specification models. His
results highlight that there exists a long-run relationship between tourism, energy
consumption and CO2 emissions. In his modeling context, CO2 emissions converge to a
long-run equilibrium through their effect on tourism and energy consumption. He recommends that the expansion of tourist activities in Turkey has resulted in the increase in both energy consumption and climate changes. In the case of Cyprus, Katircioglu et al. (2014) investigate
the long-run relationship between international tourism, energy consumption and CO2
emissions. Their result from the ‘tourism-included’ modeling approach suggests that
international tourism is in long-run equilibrium with energy consumption and CO2 emissions.
They also demonstrate that international tourist arrivals have a positive and statistically
significant impact on both energy consumption and CO2 emissions.
The current literature has only explored the relationship between economic growth and
international tourism or that between international tourism, energy consumption and CO2
emissions, without including other deterministic factors, such as renewable energy consumption and/or trade. Katircioglu (2009) suggests that international tourism and international trade are two major factors that could have a long-run association with economic growth, mainly due to their contribution to revenues from foreign exchange. At the same time, the relationship between economic growth and international trade has been previously investigated in numerous studies, with their results being highly inconclusive (Gunduz and Hatemi-J, 2005). However, the relationship between international tourism and renewable energy consumption has not been previously investigated. Therefore, including both international trade and renewable energy consumption into the empirical analysis may have a substantial impact on environmental quality, and in this manner, the integration of these explanatory variables can provide more informative policy implications.
To our knowledge, this paper is the first study that examines the causal link between CO2
emissions, economic growth, renewable energy consumption, international tourist arrivals and
trade. In this context, this study will investigate the dynamic causality between CO2
the short- and long-run investigation. The rest of the study is organized as follows: Section 2 describes the data and the empirical methodology. Section 3 is designated for the empirical results, while Section 4 discusses the results. Finally, Section 5 concludes the paper.
2. Data and Empirical Methods
We obtain annual data, spanning the period 1995-2010 for a panel of 22 Central and South
American countries1. The variables included in the empirical analysis are carbon dioxide
emissions (CO2) measured in kilo tons (kt), real gross domestic product (Y), measured in constant 2005 prices, renewable energy consumption that involves all the available spectrum of renewable sources (RE), international tourism (TRS), defined as the total number of
arrivals, and merchandise trade (TR), measured as its share of GDP2. Data on CO2 emissions,
Y, TRS and TR are obtained from the Word Bank Development Indicators (WDI, 2014) online database, while data on RE are obtained from the U.S. Energy Information Administration (2014). The Central and South American countries are selected to include the maximum number of observations depending on data availability.
Theoretically, we follow the same specification model developed by Katircioglu et al. (2014). In particular, international tourism may be a driving factor of the environmental
indicator (CO2). In addition, we have considered that trade is also a driver for CO2 emissions.
Thus, our empirical model investigates the impact of economic growth, renewable energy
consumption, international tourism and trade on CO2 emissions. The functional link between
these variables yields:
2it ( it, it, it, it)
CO = f Y RE TRS TR (1)
The natural logarithmic transformation of Eq.(1) yields the following equation:
2it i i 1i it 2i it 3i it 4i it it
co = +α δt+β y +β re +β trs +β tr +ε (2)
where i=1,...,Nfor each country in the panel, t=1,...,Tdenotes the time period and ε denotes the stochastic error term. The parameter αi allows for the possibility of country-specific fixed effects.
To examine the dynamic causal relationship between CO2 emissions, economic growth,
renewable energy consumption, international tourism and trade, the empirical analysis will first test the integration order of each variable. Panel unit root tests of the first-generation can lead to spurious results (because of size distortions) if significant degrees of positive residual cross-section dependence exist and are ignored. Consequently, the implementation of second-generation panel unit root tests is desirable only when it has been established that the panel is subject to a significant degree of residual section dependence. In the cases where cross-section dependence is not sufficiently high, a loss of power might result if second-generation panel unit root tests that allow for cross-section dependence are employed. Therefore, before selecting the appropriate panel unit root test, it is crucial to provide some evidence on the degree of residual cross-section dependence.
The cross-sectional dependence (CD) statistic by Pesaran (2004) is based on a simple average of all pair-wise correlation coefficients of the OLS residuals obtained from standard
1
Selected countries: Argentina – Belize – Bolivia – Brazil – Chile – Costa Rica – Cuba – Dominica – Dominican Republic – Ecuador – El Salvador – Guatemala – Guyana – Honduras – Nicaragua – Panama –
Paraguay – Peru – St Vincent – Suriname – Uruguay – Venezuela.
2
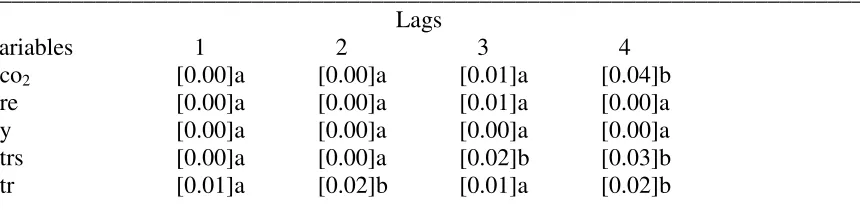
augmented Dickey-Fuller (1979) regressions for each variable in the panel. Under the null hypothesis of cross-sectional independence, the CD test statistic follows asymptotically a two-tailed standard normal distribution. The results reported in Table 1 uniformly reject the null hypothesis of cross-section independence, providing evidence of cross-sectional dependence in the data given the statistical significance of the CD statistics regardless of the number of lags (from 1 to 4) included in the ADF regressions.
Table 1. Cross-Section Dependence (CD) Test Cross-Section Correlations of the Residuals in ADF(p) Regressions
___________________________________________________________________________ Lags
Variables 1 2 3 4
co2 [0.00]a [0.00]a [0.01]a [0.04]b
re [0.00]a [0.00]a [0.01]a [0.00]a
y [0.00]a [0.00]a [0.00]a [0.00]a
trs [0.00]a [0.00]a [0.02]b [0.03]b
tr [0.01]a [0.02]b [0.01]a [0.02]b
___________________________________________________________________________ Notes: Under the null hypothesis of cross-sectional independence the CD statistic is distributed as a two-tailed standard normal. Results are based on the test of Pesaran (2004). Figures in parentheses denote p-values. Significance levels: a(1%) and b(5%).
Two second-generation panel unit root tests are employed to determine the degree of integration in the respective variables. The Pesaran (2007) panel unit root test does not require the estimation of factor loading to eliminate cross-sectional dependence. Specifically, the usual ADF regression is augmented to include the lagged cross-sectional mean and its first difference to capture the cross-sectional dependence that arises through a single-factor model. The null hypothesis is a unit root for the Pesaran (2007) test. The bootstrap panel unit root tests by Smith et al. (2004) utilize a sieve sampling scheme to account for both the time series and cross-sectional dependence in the data through bootstrap blocks. All four tests by Smith et al. (2004) are constructed with a unit root under the null hypothesis and heterogeneous autoregressive roots under the alternative hypothesis. The results of these panel unit root tests are reported in Table 2 and support of the presence of a unit root in all variables under consideration.
Table 2. Panel Unit Root Tests
_____________________________________________________________________
Variable Pesaran CIPS
Pesaran CIPS*
Smith et al. t-test
Smith et al.
LM-test
Smith et al.
max-test
Smith et al.
min-test
co2 -1.25 -1.31 -1.42 3.02 -1.25 1.35
co2 -5.52a -5.23a -5.32a 17.93a -6.62a 6.43a
Re -1.28 -1.26 -1.25 3.15 -1.29 1.28
re -5.59a -5.21a -6.24a 19.51a -7.75a 7.21a
Y 1.14 -1.22 -1.28 2.36 -1.33 1.25
y -6.34a -6.48a -5.63a 18.74a -8.64a 6.46a
trs -1.52 -1.42 -1.24 1.23 -1.29 1.18
tr -7.39a -6.32a -5.53a 17.98a -7.71a 6.65a
____________________________________________________________________________________________
[image:6.595.72.497.571.696.2]Given the unit root test results, we investigate the presence of cointegration within a heterogeneous panel context using Pedroni’s (2004) methodological approach. The null hypothesis is that there is no cointegration, while the alternative hypothesis is that there is cointegration between variables. Deviations from the long-run equilibrium relationship are
represented by the estimated residuals, εit. The null hypothesis of no cointegration, ρi =1 is
tested via the following unit root test on the residuals:
1
it i it it
ε =ρ ε − +ω (3)
If the long-run association across the variables under investigation is identified, then we proceed to estimate the long-term structural coefficients using various methodologies of panel estimation, which are more efficient than OLS. Pedroni (2001, 2004) proposed various techniques to estimate systems of cointegrated variables using the Fully Modified OLS (FMOLS). The dynamic OLS (DOLS) is another approach of panel estimation, recommended by Kao and Chiang (2000) and Mark and Sul (2003).
In the final stage, we can use Granger causality testing to examine the presence of any bidirectional causal link across the variables under study. To this end, we run the pairwise Granger causality tests and the vector error correction model for the short- and long-run relationships, respectively. Two stages are suggested by Engle and Granger (1987): the first stage recovers the estimated residuals from Equation (2), while the second stage estimates the parameters related to the short-run adjustment. The estimation of the dynamic vector error correction model is given as follows:
11 12 13 14 15
2 1
21 22 23 24 25 2
31 32 33 34 35 3
1
41 42 43 44 45 4
51 52 53 54 55 5
p p p p p
it
p p p p p
it q
p p p p p
it
p
p p p p p
it
p p p p p
it co y re trs tr
β β β β β
α
β β β β β
α
β β β β β
α
β β β β β
α
β β β β β
α − ∆ ∆ ∆ = + ∆ ∆
∑
2 1 1 1
1 2 2
1 3 1 3
1 4 4
1 5 5
it it
it it
it it it
it it it it co y re ect trs tr θ µ θ µ θ µ θ µ θ µ − − − − − − ∆ ∆ × ∆ + + ∆ ∆ (4)
where ∆ is the first difference operator; the autoregression lag length, q, is determined by the
Schwarz Information Criterion (SIC); µ is a random error term; ect is the error correction term derived from the long-run relationship of Eq.(2). We use the t-statistic tests (VECM) and F-statistic tests (pairwise Granger tests) for the significance of both the long- and the short-run dynamic relationships, respectively.
3. Cointegration results
When CO2 emissions are defined as the dependent variable, the results from panel
Table 3. Panel residual cointegration test results
Alternative hypothesis: common AR coefs. (within-dimension)
Weighted
Statistic Prob. Statistic Prob.
Panel v-Stat -0.939302 0.826 -3.157883 0.999
Panel rho-Stat 3.108884 0.999 3.721938 0.999
intercept Panel PP-Stat -8.168414 0.000*** -5.490795 0.000***
and Panel ADF-Stat -5.947938 0.000*** -3.767152 0.000***
Trend Alternative hypothesis: individual AR coefs. (between-dimension)
Group rho-Stat 5.461172 1.000
Group PP-Stat -12.66171 0.000***
Group ADF-Stat -4.246178 0.000***
Null hypothesis: No cointegration. “***” indicates statistical significance at 1% level. Trend assumption: we consider the cases: intercept and deterministic trend. Lag length selection based on SIC with a max lag of 2. Newey-West automatic bandwidth selection and Bartlett kernel.
The panel cointegration results document that both panel statistics reject the null of no cointegration at the 1% significance level and confirm that there is a long-run relationship across the variables under study. Given that the variables are cointegrated, we proceed to obtain the long-run estimates of Equation (2) using both the FMOLS and DOLS approaches. The results are reported in Table 4 with the estimates including both an intercept and a trend factor.
Table 4. FMOLS and DOLS long-run estimates
Variable FMOLS DMOLS
Coefficient t-Statistic Prob. Coefficient t-Statistic Prob.
y 1.328570 13.71356 0.0000*** 1.277276 13.00459 0.0000***
re -0.115628 -2.255053 0.0248** -0.107339 -2.064634 0.0397**
trs -0.380224 -3.652889 0.0003*** -0.307836 -2.917508 0.0038***
tr 0.338421 2.487614 0.0134** 0.271113 1.965782 0.0502*
Notes: “***”, “**” and “*” indicate statistical significance at the 1%, 5% and 10% level, respectively.
The results indicate that all estimated coefficients are statistically significant and have the expected sign. Based on these estimation results, we show that real GDP and trade are the two
major drivers in increasing CO2 emissions. Moreover, the DOLS estimates indicate that a 1%
increase in real GDP leads to higher CO2 emissions by 1.27%, while a 1% increase in trade
leads to higher CO2 emissions by 0.27%. In terms of the FMOLS estimates, a 1% increase in
real GDP leads to an increase in CO2 emissions by 1.32%, while a 1% increase in trade leads
to higher pollution by 0.33%. However, the impact of both the renewable energy consumption and the number of tourist arrivals on CO2 emissions is negative and may contribute to the
reduction of pollution in the long-run. Under DOLS estimates, a 1% increase in renewable energy consumption decreases emissions by 0.10%, while a 1% increase in the number of tourist arrivals decreases CO2 emissions by 0.3%. In terms of the FMOLS estimates, a 1%
increase in the consumption of renewable energy decreases emissions by 0.11%, while a 1%
[image:8.595.71.415.432.538.2]Overall, for the selected countries panel, the long-run results highlight that the use of both renewable energy and the increase in the number of tourist arrivals are the two major drivers
for a significant decline of CO2 emissions.
The results of the short- and long-run causality are reported in Table 5. Using the pairwise
Granger causality tests we obtain the short-run interaction between CO2 emissions, real GDP,
[image:9.595.69.538.205.419.2]renewable energy consumption, number of tourist arrivals and trade. The estimated coefficients of the error correction term indicate the adjustment of the dependent variable to its long-run equilibrium.
Table 5. Short- and long-run causality tests Dependent
variable Short-run Long-run
co2 y re trs tr ECT
co2 - 2.24074 5.84145 0.01027 0.41464 -0.04475
(0.1353) (0.0162)** (0.9193) (0.5200) [-2.29013]**
y 0.68536 - 2.65395 0.20082 0.14756 0.10257
(0.4083) (0.1042) (0.6543) (0.7011) [1.79850]
re 0.12732 0.00364 - 0.16155 0.09139 -0.06339
(0.7214) (0.9519) (0.6880) (0.7626) [-2.46375]**
trs 2.11131 4.57020 2.45320 - 2.71653 -0.19133
(0.1471) (0.0332)** (0.1182) (0.1002) [-4.43297]***
tr 2.06291 3.85331 3.07655 3.78798 -0.074586
(0.1518) (0.0504)* (0.0803)* (0.0524)* - [-3.12155]***
Notes: “***”, “**”, “*” indicates statistical significance at the 1%, 5% and 10% levels, respectively. P-value listed in parentheses.
The results from the pairwise Granger causality tests reveal a short-run unidirectional
causality running from renewable energy consumption to CO2 emissions at the 5%
significance level, a short-run unidirectional causality running from real GDP to the number of tourist arrivals at the 5% significance level, and a short-run unidirectional causality running from real GDP, renewable energy consumption and the number of tourist arrivals to trade at the 10% significance level. However, there is no short-run causality between economic growth and CO2 emissions, between the number of tourist arrivals and CO2 emissions, and
between trade and CO2 emissions in the short-run. Furthermore, no short-run causality links
between renewable energy consumption and economic growth and that between renewable energy consumption and the number of tourist arrivals is present either.
The error correction term is statistically significant for CO2 emissions, renewable
energy consumption, the number of tourist arrivals, and trade equations, but not statistically significant for the economic growth equation. In that sense, there is long-run causality running
from i) economic growth, renewable energy consumption, the number of tourist arrivals and
trade to CO2 emissions at the 5% significance level, ii) from CO2 emissions, economic
growth, the number of tourist arrivals and trade to renewable energy consumption at the 5%
significance level, iii) from CO2 emissions, economic growth, renewable energy consumption,
and trade to the number of tourist arrivals at the 1% significance level, and iv) from CO2
emissions, economic growth, renewable energy consumption and the number of tourist arrivals to trade at the 1% significance level.
The short-run Granger causality test results reveal the absence of any causal relationship between economic growth and renewable energy consumption. Our findings are similar to those by Menegaki (2011) for the case of 27 European countries, but opposite to those by Apergis and Payne (2010a) for a panel of OECD countries, while Apergis and Payne (2010b) for the case of Eurasia, and Apergis and Payne (2011) for Central America countries find a bidirectional dynamic causal link between renewable energy consumption and economic growth. Our findings indicate that in the short-run, the use of renewable energy is not expected to affect economic growth, while the expansion of economic activities in the selected region is not expected to impact the consumption of renewable energy, a result conducive to the neutrality hypothesis. In addition, we find the absence of short-run causality
link between CO2 emissions and economic growth, implying that increases in economic
growth are not expected to have any impact on the environmental quality, while increases in the pollution share may not affect the economic activities development either. This result is opposite to that provided by Apergis and Payne (2009) for a panel of six Central American countries and by Apergis et al. (2010) who find bidirectional causality between economic
growth and CO2 emissions. We additionally find the absence of any short-run dynamic causal
relationship between CO2 emissions and the number of tourist arrivals and between CO2
emissions and trade, indicating that any changes in the number of tourists arrivals in the case of the Central and South American countries are not expected to affect environmental quality, while any changes in the degree of pollution are not expected to impact the number of tourist arrivals either. Moreover, any increases in the degree of pollution are not expected to influence trade activities, while any increases in trade are not expected to increase CO2
emissions in this region.
By contrast, our short-run Granger causality tests document the presence of unidirectional
causality running from renewable energy consumption to CO2 emissions without any
feedback, implying that any renewable energy increases are expected to reduce the degree of
pollution, while efforts to reduce CO2 emissions are not expected to affect renewable energy
policies. Our results are in contrast with those provided by Apergis et al. (2010) who find a
bidirectional short-run causality between renewable energy consumption and CO2 emissions.
Regarding the interdependence between renewable energy consumption and trade, short-run Granger causality tests highlight the presence of unidirectional causality short-running from renewable energy consumption to trade. This result is not in line either with the findings by Al-Mulali et al. (2014) for a number of Latin American countries; they find a unidirectional causality running from trade to renewable energy consumption. Our results are not similar to those provided by Ben Aïssa et al. (2014) either for a panel of 11 African countries; they find no causal relationship between these two variables. Therefore, our results indicate that any conservation in the use of clean energy is expected to slow down exports or/and imports, but the reverse does not seem to hold.
to combat global warming as well as to encourage more green technology transfers across countries.
In the long-run, all error correction terms are statistically significant, with the exception of that in the real GDP equation. In other words, there is bidirectional long-run causality
between CO2 emissions, renewable energy consumption, the number of tourist arrivals and
trade. Interestingly, the finding of bidirectional causality between these variables suggests the presence of a long-run interaction between them. The long-run causality between renewable energy consumption and trade, suggests that higher levels renewable energy consumption are expected to accelerate the expansion of trade activities, while more trade is expected to have a stronger influence on the share of renewable energy use in total energy consumption.
The long-run dynamic causal relationship between the number of tourist arrivals and renewable energy consumption indicates that a policy designed for the development of the tourism sector could be a good supportive policy for the expansion of the share of renewable energy in the total energy mix, while the long-run bidirectional relationship between the number of tourist arrivals and trade denotes that increases in the number of tourist arrivals in the case of the Central and South American countries may substantially contribute to increases in international trade transactions. At the end of the day, the adoption of clean
technology for production purposes does not seem to be the only venue to reduce CO2
emissions. However, increasing the number of tourist arrivals can significantly assist the
Central and South American countries to decline their levels of CO2 emissions, while at the
same time they can increase their economic activity.
5. Conclusions and Policy Implications
This paper examined the dynamic causal linkages between CO2 emissions, economic
growth, renewable energy consumption, the number of tourist arrivals and trade for a panel of Central and South American countries spanning the period 1995-2010. The primary goal of this empirical study was to explore the impact of both the number of tourist arrivals and trade on the environmental quality, given that renewable energy is considered the primary energy source of production. Using panel cointegration tests, the empirical findings showed that the
long-run relationship across the above variables has been strongly supported when CO2
emissions turns to be the dependent variable.
Based on both FMOLS and DOLS estimates, the long-run results documented that both
economic growth and trade significantly contribute to more CO2 emissions. Indeed, any
increase in real GDP or in the share of merchandise trade exchanges increased the level of pollution in the regions under study. However, both renewable energy consumption and the
number of tourist arrivals are substantial drivers for the decline of CO2 emissions.
Short-run Granger causality tests highlighted unidirectional causality running from
renewable energy consumption to CO2 emissions, indicating the pivotal role of renewable
energy in the reduction of such emissions. Moreover, there was amble evidence for the presence of unidirectional causality running from economic growth, renewable energy consumption and the number of tourist arrivals to trade, as well as unidirectional causality running from trade to the number of tourist arrivals. In the long-run, the vector error correction model displayed the presence of bidirectional causality across all the relevant variables, except for the case of economic growth.
renewable energy for production purposes as well as the expansion of the number of tourism arrivals seem to be the two major drivers for significantly enhance environmental quality levels.
References
Al-mulali, U., Fereidouni, H.G., Lee, J.Y.M., 2014. Electricity consumption from renewable and non-renewable sources and economic growth: Evidence from Latin American countries. Renewable and Sustainable Energy Review, 30, 290-298.
Apergis, N., Payne, J.E., 2009. CO2 emissions, energy usage, and output in Central America.
Energy Policy 37, 3282–3286.
Apergis, N., Payne, J.E., 2010a. Renewable energy consumption and economic growth evidence from a panel of OECD countries. Energy Policy, 38, 656-660.
Apergis, N., Payne, J.E., 2010b. Renewable energy consumption and growth in Eurasia. Energy Economics, 32, 1392-1397.
Apergis, N., Payne, J.E., 2011. The renewable energy consumption-growth nexus in Central America. Applied Energy, 88, 343-347.
Apergis, N., Payne, J.E., Menyah, K., Wolde-Rufael, Y., 2010. On the causal dynamics between emissions, nuclear energy, renewable energy, and economic growth. Ecological Economics, 69, 2255-2260.
Ben Aïssa, M.S., Ben Jebli, M., Ben Youssef, S., 2014. Output, renewable energy consumption and trade in Africa. Energy Policy, 66, 11-18.
Dickey, D. and W. Fuller 1979. Distribution of the estimators for autoregressive time series with a unit root. Journal of the American Statistical Association 74, 427-431.
Engle, R.F., Granger C.W.J., 1987. Co-integration and error correction: Representation, estimation, and testing. Econometrica, 55, 251-276.
Gunduz, L., Hatemi-J, A., 2005. Is the tourism-led growth hypothesis valid for Turkey? Applied Economics Letters, 12, 499-504.
Katircioglu, S.T., 2009. Revisiting the tourism-led-growth hypothesis for Turkey using the bounds test and Johansen approach for cointegration. Tourism Management, 30, 17-20.
Katircioglu, S.T., 2014. International tourism, energy consumption, and environmental pollution: The case of Turkey. Renewable and Sustainable Energy Reviews, 36, 180-187.
Katircioglu, S.T., Feridun, M., Kilinc, C., 2014. Estimating tourism-induced energy
consumption and CO2 emissions: The case of Cyprus. Renewable and Sustainable
Energy Reviews, 29, 634-640.
Menegaki, A. N., 2011. Growth and renewable energy in Europe: a random effect model with evidence for neutrality hypothesis. Energy Economics, 33, 257–63.
Menyah, K., Wolde-Rufael, Y., 2010. CO2 emissions, nuclear energy, renewable energy and
economic growth in the US. Energy Policy, 38, 2911-2915.
Ocal, O., Aslan, A., 2013. Renewable energy consumption–economic growth nexus in Turkey. Renewable and Sustainable Energy Review, 28, 494-499.
Pedroni, P., 2001. Purchasing power parity tests in cointegrated panels. The Review of Economics and Statistics, 83, 727-731.
Pesaran, M. (2007) A simple panel unit root test in the presence of cross-section dependence. Journal of Applied Econometrics, 22, 265-312.
Pesaran, M. 2004. General diagnostic tests for cross section dependence in panels. Cambridge Working Papers in Economics 435, and CESifo Working Paper Series 1229.
Sadorsky, P., 2009a. Renewable energy consumption, CO2 emissions and oil prices in the G7
countries. Energy Economics, 31, 456-462.
Sadorsky, P., 2009b. Renewable energy consumption and income in emerging economies. Energy policy, 37, 4021-4028.
Shafiei, S., Salim, R.A., 2014. Non-renewable and renewable energy consumption and CO2
emissions in OECD countries: A comparative analysis. Energy Policy, 66, 547-556. Smith, V., S. Leybourne, and T.-H. Kim 2004. More powerful panel unit root tests with an
application to the mean reversion in real exchange rates. Journal of Applied Econometrics, 19, 147–170.
World Bank, 2014. World Development Indicators. Accessed at: