Beyond Income: A Study of
Multidimensional Poverty in Chile
Bronfman, Javier
Universidad Adolfo Ibáñez
31 November 2014
Online at
https://mpra.ub.uni-muenchen.de/63256/
Beyond Income: A Study of Multidimensional Poverty in Chile
Javier Bronfman1
Abstract
Using the latest nationally representative household survey for Chile, this paper empirically assesses multidimensional poverty both at the national and sub-national level. Based on the Alkire-Foster method and focusing on four dimensions of well-being –education, health, income and living standard– this study estimates the level and depth of multidimensional poverty for Chile in 2011. At national level, the results show that fewer individuals are subject to multidimensional poverty compared to the number of poor people estimated using the national income poverty line, however, large variance is found at the regional level, some regions present higher levels of multidimensional poverty than income poverty. Nonetheless, multidimensional poverty at the regional level appears to be varied, both in terms of prevalence and its nature. The multidimensional nature of this methodology provides a deeper understanding of poverty and deprivation, thus it complements income poverty estimates by informing policymakers about the joint distribution of several deprivations. This information can be used to better design and target poverty alleviation programs, as well as better allocate resources at the regional and local level.
Keywords: Poverty, Multidimensional Poverty, Capability Approach, Chile JEL Code: I31, I32
1
"To be poor is to be hungry, to lack shelter and to be sick and not cared for, to be illiterate and not schooled. But for poor people, living in poverty is more than this. Poor people are particularly vulnerable to adverse events outside their control. They are often treated badly by the institutions of state and society and excluded from voice and power in those institutions” (World Bank 2000, 15).
I. Introduction
During the last 25 years, Chile has experienced significant advances in poverty reduction and human development. Since 1990, it has gone through a long period of economic growth coupled with an expansion of social programs. As a result, income poverty has decreased
significantly–from 40% in 1990 to 14% in 2011. Nevertheless, well-being and poverty levels are determined by monetary and non-monetary factors. Although an increase in income permits individuals to expand the access to goods and services offered in the market, it is also true that there are important, basic needs of people that are not necessarily purchased, or whose markets are highly imperfect or missing. These include education, health care, sanitation, safe water, etc. which are better served through public or social provision. Therefore, income is inappropriate as a sole indicator of well-being and should be supplemented by other measures (Bourguignon and Chakravarty 2003).
In order to continue on the path toward development, enhanced social inclusion, and decreased inequality, Chile needs to complement its measurement of income poverty with a broader one that sheds light on the additional dimensions of well-being in which some might lag behind. By measuring multidimensional poverty, the government will be able to better design specific policies that address those dimensions where there are deficits, as well as better target resources to those areas with specific needs.
In contrast with traditional one-dimensional measures based on income or expenditure, a multidimensional poverty index is capable of distinguishing among poor and non-poor on the basis of different dimensions and forms of deprivation. Based on the capability approach
“reflecting the person’s freedom to lead one type of life or another” (Sen 1992, 40). In this sense, a multidimensional poverty measure is a composite index involving several indicators related to health, education, and living standards that account for the level of well-being.
These types of estimations have been on top of the research agenda in the last decade or so, and have caught the attention of many policymakers, including Chile’s Ministry of Social Development. In recent years, there has been a growing consensus on the fact that poverty is a multidimensional phenomenon. What remains unsettled is the manner of measuring it, which is crucial for monitoring and evaluating social policies. Some authors point to the problems that arise when one attempts to choose indicators, cut-off thresholds and weights (Bourguignon and Chakravarty, 2002; Atkinson, 2003 and Duclos et al. 2006). Others have raised issues regarding the process of aggregation and the strengths and weaknesses of a multidimensional poverty index (Alkire and Foster 2011b; Ravallion 2011; Lustig 2011; Ferreira and Lugo 2012).
The past decade has seen significant methodological developments of multidimensional poverty measures (Bourguignon and Chakravarty 2003; Chakravarty and Silber 2005; Chakravarty and D’Ambrosio 2006; Bossert, Chakravarty and D’Ambrosio 2009; Alkire and Foster 2011a). The work initiated by the Oxford Poverty and Human Development Initiative (OPHI), including its development of the Global Multidimensional Poverty Index (MPI), is particularly relevant.2 In fact, OPHI recently launched (in conjunction with the United Nations Human Development Report) the latest Global MPI report with 2014 estimations based on the
Alkire-Foster method.
The new set of multidimensional measures enhances the understanding of poverty and human deprivation by providing evidence of different aspects of well-being not captured by income or consumption expenditure, thus informing the design and implementation of social policy.
Outside of the OPHI-UNDP Global MPI initiative, two countries in Latin America, Mexico and Colombia, have adopted this methodology into their national poverty statistics and have developed their own national multidimensional poverty index to guide social policy and evaluate development progress over time. The MPI measure enables different programs such as
2
conditional cash transfers, housing and infrastructure projects to be targeted toward those households in need, and also focuses resources on the specific areas where the lags are most significant. In 2009 and 2011 respectively, Mexico and Colombia launched their new MPI measures; both were based on the Alkire-Foster estimation method, but each was tailored toward their own specific country settings. In the case of Mexico, the new methodology was based on a set of social rights stated in their 2004 General Social Development Act (Ley General de Desarrollo Social). Their MPI includes education, access to health and social security, quality of housing, basic services, access to food, income per capita and degree of social cohesion.3
Colombia also anchored its MPI to its Constitution and social rights principles. Additionally, the National Department of Statistics (DANE) designed the MPI using the household as the unit of analysis. This helps maintain consistency with Colombia’s largely family-oriented social policy design. The index incorporates five dimensions, namely: education, childhood and youth conditions, work, health, and housing and basic services.
This study proposes a multidimensional poverty index for Chile and estimates the degree and depth of multidimensional poverty in 2011 at both the national and regional level, and compares the multidimensional measure to the current unidimensional based on income alone. The choice of indicators for Chile is based on data availability, the usefulness of these indicators in designing and implementing poverty reduction strategies, and the potential for these indicators to improve social program targeting. As Sen (1976) argues, the choice of indicators and
dimensions that capture human capabilities is a value judgment rather than a technical exercise. It follows that measurement should not be based solely on the idea behind the project, but take into account knowledge of the specific case study at hand. Estimations will be conducted both at the national level and at the regional level, exploring possible differences between regions. Regional information, such as poverty maps, have been used in the past to design and better target social policy at the subnational level; in this case, a multidimensional poverty map could shed light on the most prevalent deprivations among regions, thus informing policymakers on how to better allocate resources. Although the government of Chile has been interested in this methodology for some time, to this date there has not been any systematic and up-to-date analysis of multidimensional poverty in Chile.
3
The rest of the chapter is organized as follows. The next section comparatively examines monetary versus multidimensional poverty measures and their theoretical frameworks; the third section provides a literature review focused on multidimensional poverty measurement and its previous applications in Latin America. Section IV is dedicated to explaining how poverty is currently measured in Chile. Section V presents the methodology used to estimate multidimensional poverty and describes the data used in this study. Section VI presents the results, and the final section concludes with reflections and policy implications.
II. Monetary versus Multidimensional Poverty Measures
The theoretical framework underlying the concept of poverty and its measure draws from three main normative approaches: the utilitarian approach (Bentham 1789; Mills 1863), Rawls’ theory of justice (Rawls 1971), and the capability approach advanced by Sen (1996, 1999),
Nussbaum and Sen (1993) and Nussbaum (2000).
Utilitarianism assumes that all that matters to individuals can be represented in their preferences (Larrañaga 2007). However, individual welfare cannot be observed or measured directly; rather, it is approximated by a utility function based on observable variables such as income. Monetary resources generate utility for an individual insofar as they represent the
means of national poverty lines (Bronfman 2010b). Likewise, the international poverty comparisons estimated by the World Bank use income per capita to estimate extreme poverty, using the international poverty line of $1.25 US dollars per person per day.
The theory of justice proposed by Rawls (1971) advocates moving toward a minimum set of primary goods, including constitutional rights, that could lead to a just society. Thus, poverty could be associated with the inability to meet this minimum set of living standards. Rawls (1971) argues that people orient their welfare based on their ability to comprehend a sense of right, generating an outline of basic individual freedoms. Justice then focuses on the distribution of primary goods4 that people want access to regardless of their life prospects (Rawls 1971). Based on Rawls’ conceptual framework, poverty can be understood as the lack of these primary goods.
Sen (1996) finds there is an intermediate category, called functionings, which forge a link between means (utilitarian approach) and achievements (Rawls). Under this view welfare is measured in terms of the capabilities that an individual has to carry out their life goals. Thus, the notion of poverty in this case is associated with an unacceptable denial of human freedoms (Sen 1996). Freedom and development not only depends on the characteristics of the individual, but also the social arrangements that are in place to achieve those functionings that promote freedom and development. Thus, the capability set represents the real freedom that a person has to choose between the alternative ways of life that he or she may lead (Sen 1996): "Poverty must be seen as the deprivation of basic capabilities rather than merely as lowness of incomes, which is the
standard criterion of identification of poverty"(Sen 1999, 87). Under Sen’s capability approach, deprivation, or poverty, is indeed connected to a lack of primary goods; however, it also incorporates the capacity of an individual to take advantage of and use the set of goods.
Since the writing of Sen (1976) on functionings and capabilities, coupled with the improvement of data collection on well-being indicators, the analysis of multidimensional poverty has increasingly gained the attention of economists and policymakers. Significant methodological advances in estimation methods and new frameworks, which take the multidimensional environment into account, have taken place over the past 5 years, analogously to the set of techniques being developed in the one-dimensional space.
This new approach corresponds to what is referred to in the literature as a direct method
4
of estimating poverty. It gauges whether an individual or a household is able to attain a minimum set of goods, services, rights, assets or capabilities (i.e., Rawls’ set of minimum living standards or constitutional rights, or the minimum set of capabilities conceptualized by Sen). Examples of these approaches are the unsatisfied basic needs approach (UBN)5, widely used in Latin America since the early 1980s by the United Nations Economic Commission for Latin America and the Caribbean (ECLAC), and the Human Poverty Index (HPI)6, which was developed by the United Nations Development Program (UNDP) in the 1990s (UNDP 1997). These methods evaluate whether or not a certain minimum level of attainment in different dimensions like health, education and standard of living are met.
Recent developments in estimation methods and increasing data availability permit us to gauge poverty in a multidimensional way, using the direct method based on Sen’s capability approach (Alkire and Foster 2011a). The main example of these advances is the work done by the OPHI, including their recent launch of the Global Multidimensional Poverty Index, which calculated poverty levels for over 100 countries.
III. Construction and Applications of Multidimensional Poverty Measures
The work of Bourguignon and Chakravarty (2003) is the first major attempt to
operationalize multidimensional poverty based on Sen’s axiomatic approach (Sen 1976). Their
paper presents a methodology that includes multiple dimensions with specific poverty lines,
identifying as poor those individuals or households who fail to achieve the minimum level in one
or more dimensions. This is referred to as the union approach. In addition to proposing a model
to identify the poor and aggregate their characteristics, they specify several functional forms to
account for different relationships of complementarity or substitution between the dimensions or
indicators. Their model differs from previous aggregated multiple-dimension indicators like the
5
The UBN approach used census data to evaluate the level of deprivation on: (i) housing (construction materials and overcrowding), (ii) access water and sanitation; (iii) school attendance and years of education of the household head; and (iv) rate of demographic dependency (Feres and Mancero 2001). This methodology utilized a union approach to determine poverty, meaning that if a person or household was deprived in one of the indicators, it was identified as poor. The UBN method has been criticized for its selection of indicators, implicit weights, and the way these indicators are aggregated. Thus estimates using UBN have traditionally been complemented (or replaced) with income poverty estimates.
6
Human Development Index and the Human Poverty Index (HPI) in two important ways. First,
their poverty index (headcount and poverty gaps) can be measured at the individual or household
level; second, their poverty index satisfies a set of desirable axioms and properties.7 To illustrate
their methodology, Bourguignon and Chakravarty calculated estimates for rural Brazil in 1981
and 1987 using income and education as their key dimensions. They find that the
multidimensional poverty headcount in rural Brazil reached 80% in 1981 and 76% in 1987,
compared to the standard headcount rate of 40% and 42% respectively.
Chakravarty and D’Ambrosio (2006) develop an axiomatic approach to measure social
exclusion. Following Sen’s capability approach, they focus on individual social exclusion in
terms of functioning deprivations of a person in a particular society. A set of decomposable and
non-decomposable social exclusion measures, such as the exclusion headcount ratio, the average
deprivation score, the Gini exclusion measure, and the symmetric mean of exclusion satisfy a
given set of axioms.8 This set is presented coupled with an application using the European Union
and Italian data.
Chakravarty, Deutsch and Silber (2008) provide a multidimensional index as an
extension of Watts’ (1968) poverty index and poverty gap. Their new index is expressed as a
function of the inequality among the poor, the headcount ratio, the weight of each dimension,
and the correlation between dimensions included in the model. This methodology allows for
causal factor decomposition, which clarifies the impact of each indicator on the overall index,
hence helping the formulation of poverty-reduction policies that are targeted to reach the most
important deprivations. Given the construction of the Watts index, unfortunately this method can
only use quantitative indicators, and does not allow for categorical or qualitative information that
could be dichotomized–as in the Alkire-Foster method.
Also based on the axiomatic approach, Alkire and Foster (2011a) propose a
Multidimensional Poverty Index consisting of a dual cutoff for identification and aggregation.
This method represents a generalization of the Foster-Greer-Thorbecke (FGT) family of poverty
measurements (Foster et al., 1984), where the first cutoff corresponds to the poverty line for each
7
The axioms and properties are as follows: strong and weak focus, symmetry, monotonicity, continuity, principle of population, scale invariance, subgroup decomposability, and transfer principle. For a full description of the axioms and principles, see the appendix on Bourguignion and Chakravarty (2003) pp. 46-47 and Sen (1976).
8
dimension or indicator (zi) and the second (k) determines the percentage of dimensions or
indicators that an individual has to be deprived of in order to be identified as multidimensionally
poor. They propose three main indicators: the multidimensional poverty headcount (H), the average deprivation for those identified as multidimensionally poor (A), and the multidimensional index Mα, which corresponds to the adjusted FGT class of multidimensional poverty measures.9 This methodology is the most widely used in empirical work today since it has several advantages over the other measurement approaches; namely, it has the potential to incorporate qualitative information, the ability to decompose the index by subgroups, and it satisfies the desired poverty-measurement axioms.10
Additionally, this methodology has gained traction because of the fact that the United Nations Development Program has adopted it. The OPHI and the UNDP calculated and launched the first Global MPI for over a hundred countries in 2010 (in conjunction with the 2010 UNDP Human Development Report). Its new version, released in 2014, includes 108 countries. The
Global MPI is a composite of indicators based on household survey data. The index has three
dimensions and ten components: two represent health (malnutrition, and child mortality), two
represent educational achievement (years of schooling and school enrolment), and six aim to
capture standard of living11 (including both access to services and proxies for household wealth).
The three broad categories–health, education, and living standards–are weighted equally
(one-third each) to form the composite index. The MPI, however, is estimated at the household level,
thus not providing any information on intra-household differences.
As noted in the introduction of this chapter, two Latin-American countries (Mexico12 and
Colombia13) have already developed their own national multidimensional poverty estimate based
9
The adjusted FGT class of multidimensional poverty corresponds to the known poverty gap, square poverty gap, and gap to a power>2, but under a multidimensional scenario.
10
The Alkire-Foster MPI (Mα) satisfies the following axioms: decomposability, replication invariance, symmetry,
poverty and deprivation focus, weak and dimensional monotonicity, nontriviality, normalisation, and weak rearrangement for α≥0; monotonicity for α>0; and weak transfer for α≥1 (Alkire and Foster 2011a, 481).
11
Indicators for standard of living are: access to electricity, sanitation services and water, the floor material of the dwelling, cooking fuel, and assets holdings by the family.
12
The Mexican national multidimensional poverty index is estimated at the individual level and incorporates two equally weighted dimensions, economic well-being and social rights. A person is identified as multidimensionally poor when they are income deprived plus experiencing deprivation in at least one of the social rights (educational gap, access to healthcare, access to social security, housing quality and spaces, basic services in homes and access to food).
13
on the Alkire-Foster method. Several others are discussing and preparing for the development of
a multidimensional measure adopting this methodology to complement their monetary poverty
measurements with the help of the Oxford Poverty and Human Development Initiative (OPHI
2013; Santos 2013).
Alongside the Global MPI, several papers have estimated multidimensional poverty for
different countries as a way to complement income poverty measures. Following the
methodology proposed by Bourguignon and Chakravarty (2003), Arim and Vigorito (2007) and
Amarante et al. (2008) estimate multidimensional poverty for Uruguay. Amarante et al. (2008)
compares the results of the initial model with fuzzy sets14 and stochastic dominance analysis
approaches.15 Their results shed light on how multidimensional poverty can provide additional
information for the analysis of well-being, particularly when including indicators that can change
over a longer period of time than income. They show how multidimensional poverty in Uruguay
has decreased at a lower rate over time than income poverty. Also following Bourguignon and Chakravarty’s methodology, Conconi and Ham (2007) estimates the trends of multidimensional poverty in Argentina during the 1998-2002 financial crisis. Their model includes four dimensions–work, housing, education, and income–and concludes that the increase in poverty is driven mainly by the increase in income and work deprivations during the period.
Using Bourguignon and Chakravarty’s method and the fuzzy sets approach, Lopez-Calva and Rodriguez-Chamussy (2005) study household multidimensional poverty in Mexico. Their
model includes ten indicators: education, children school attendance, child labor, housing characteristics, access to water and sanitation, overcrowding, having a refrigerator, and access to social security. They find that income poverty is highly correlated to multidimensional poverty when including this particular set of indicators. In a later paper, Lopez-Calva and Ortiz-Juarez (2009) include several indicators that are less correlated with income in their model (e.g., violence exposure and self-esteem). By including this set of indicators, the difference between the prevalence of income poverty and multidimensional poverty increases. Therefore, relying
33% of deprivations (Angulo, Salazar, Cuervo and Pinzon 2011).
14
The “fuzzy set” approach to poverty analysis is based on the idea that certain classes of objects may not be defined by very precise criteria of membership. In other words, there are cases where one is unable to determine which elements belong to a given set and which ones do not. Zadeh himself (1965) characterized a fuzzy set (class) as “a class with a continuum of grades of membership.” (Deutsch and Silber 2005, 146-47).
15
solely on income indicators for social program targeting could lead to high levels of exclusion errors.
Grounded on Alkire-Foster (2011a), Gallo and Roche (2011) estimate a set of four different multidimensional estimates for Venezuela between 1997 and 2010. Their model utilizes nine to eleven indicators under three dimensions (education, living standard and work) using different weights. The selection of indicators in this case was based on national law, including the Constitution, a comprehensive review of the literature on multidimensional poverty, and several consultations with national poverty experts and stakeholders involved in the design of social policies. According to their results, multidimensional poverty in Venezuela has decreased over time. The main drivers of poverty reduction were increase in assets and education, as well as more employment opportunities.
Using the Alkire-Foster method, Santos et al. (2010) estimate multidimensional poverty in six Latin American countries (Argentina, Brazil, Chile, El Salvador, Mexico, and Uruguay) for the 1992-2006 period. Their analysis included three dimensions (command over resources, education and housing) with six indicators (income per capita below $2 US dollars per day, children at school, education of the household head, access to water, access to sanitation, and housing characteristics). Their approach is intended to improve the Unsatisfied Basic Needs method widely used in Latin America by providing a deeper understanding of the level of deprivations households are subject to. They find significant improvements in all the countries
during the period studied. All countries experienced a decrease in multidimensional poverty, both as a reduction in the proportion of poor households as well as in the average number of deprivations households were subject to. They also find that multidimensional poverty in rural areas is much higher than in urban areas for all countries.
Battiston et al. (2013) perform a wider range of multidimensional poverty estimates for the same six Latin American countries and period as Santos et al. (2010). They incorporate a broader range of measures as a way to test the robustness of the previous results. They include Bourguignon and Chakravarty (2003) indices, exploring different weight structures. Their evidence is consistent with Santos et al. (2010) in terms of trends and differences in multidimensional poverty prevalence between urban and rural areas.
better reflect multidimensional poverty in Latin America. Moreover, Santos (2013) provides a thorough review of previous multidimensional studies, with particular emphasis on Latin American countries, as a way to put forward the need for a cross-country comparable multidimensional poverty index. The paper provides a list of requirements for this index, proposing five dimensions (basic consumption, education, health, housing, basic services, and work).
Aside from the inclusion of Chile in the cross-country examination of multidimensional poverty done by Santos et al. (2010) and Battiston et al. (2013), there are two other papers which provided some estimates of multidimensional poverty in Chile. Larrañaga (2007) proposes a measurement that includes several indicators and deprivation cutoffs as a way to complement the income dimension of poverty. He makes use of indicators in four dimensions (health, education, dwelling, and environment). Using the CASEN data for 2003, his study illustrates how the population suffers from different deprivations. The article does not provide a methodology to jointly analyze deprivations, but uses a dashboard approach to illustrate how income deprivation does not capture all dimensions of poverty.
Using nine CASEN data sets from 1990 to 2009, and following the Alkire-Foster methodology, Denis et al. (2010) estimates multidimensional poverty in Chile for three groups of individuals separately. They evaluate multidimensional poverty at the national level for: (i) the economically active population (ages 15 to 65), (ii) children (ages 14 and below), and (iii) the
elderly (ages 65 and over). Their model incorporates five dimensions (education, health, employment, housing, and income) with fourteen indicators within those dimensions.16 They report a significant decline of multidimensional poverty from 1990 to 2009 for all three groups. The paper presents the multidimensional headcount H and M0 for different dimensional cutoffs,
providing several estimations for each year. Based on a cutoff of two out of five deprived dimensions (k=40) the study reports a decline in multidimensional poverty from 52.8% to 27.3% for the economically active, 53.8% to 16.5% for children, and 41.8% to 22.4% for the elderly between 1990 and 2009.17 Unfortunately this study does not explain the weight structure used for each dimension and indicator in the model, making it difficult to interpret the results and
16
The indicators used are: access to preschool, school attendance, literacy, lagging behind in school, access to health insurance, experience of some health problem in the previous 30 days, unemployment, having a work contract, contribution to a pension system, living as an “allegado” (not a family member), toilet access, overcrowding, and income per capita. Some of the indicators used apply only to one of the groups studied (e.g. preschool attendance).
17
impossible to replicate. Additionally, the paper does not present nor discuss the depth of deprivation in each dimension.
Since there have only been a limited number of studies looking at multidimensional poverty in Chile, and the latest estimates are from 2009, this study aims to enrich the literature on multidimensional poverty by empirically assessing this phenomenon at both the national and regional level. All previous attempts to measure multidimensional poverty in Chile have been conducted at the national level, possibly missing important regional differences in the sources of poverty. By focusing the attention on regional differences, the government could better allocate resources to those areas where individuals need them the most within each region. Based on the Alkire-Foster method and focusing on four dimensions of well-being–education, health, income, and living standard–this study estimates the level and depth of multidimensional poverty for Chile in 2011, updating previous results and incorporating a new variable to capture income deprivation (i.e., relative income poverty) into the model. Additionally, it provides results of an interesting application by exploring the level and depth of multidimensional poverty among the indigenous population of the Araucanía Region.
IV. How is Poverty Measured in Chile?
The current official poverty measure in Chile dates back to the Pinochet military government (1973 to 1990). As part of the reforms to liberalize the economy and promote the private sector, the government reduced social spending and targeted social assistance toward those who were unable to meet the most basic needs (Ffrench-Davis 2003). As a way to identify those individuals eligible for government assistance, the first poverty map was created in 1974 and a set of subsidies were directed to the extreme poor. A second poverty map was developed in 1982 with the aim of updating this information and improving the targeting of social assistance (Denis et al. 2010).18
Later, in 1987, the Government developed the first socio-characterization scorecard (Ficha CAS). This scorecard aggregates information from material dimensions, education and
18
health variables to compute a final score that determines eligibility for subsidies and social assistance.19 The main objective of the scorecard was to identify those most in need, in order to better target public spending (Herrera et al. 2010).
In 1987, the United Nations Economic Commission for Latin America and the Caribbean (ECLAC) estimated the current poverty lines by determining the cost of a basic food basket allowing for the consumption of a minimal caloric intake of 2,176 Kcal per day plus a non-food component (CPMP 2014).20 These poverty lines are updated over time according to changes in prices. The extreme poverty line, or indigence line, is based on the cost of the basic food basket according to consumption patterns of a reference group; this reference group is defined as the group with lower income that is still able to satisfy the recommended caloric requirements. On the other hand, the standard poverty line (not the extreme poverty line) adds a non-food component cost to the food requirement’s monetary value. The value added is based on the Orshansky coefficient21 (CPMP 2014). Based on these poverty lines, the Government estimates the official poverty rate using income data from the CASEN.
Given Chile’s economic growth path and current development level, the official poverty measure and the methodology behind poverty estimations are acknowledged to be outdated by both academics and the government. In 2010 and 2012, the Government created two different presidential commissions to revise the poverty methodology and propose new methods of gauging poverty and well-being that could guide policies to more effectively eradicate poverty in
a high middle-income country setting.
Both commissions proposed the introduction of a national multidimensional poverty index to accompany the income-based poverty measure. While the first commission report (Comisión Medición Pobreza 2011) only mentions the need to develop a multidimensional poverty measure and cites the work done by Denis et al. (2010) on this issue, the second commission’s final report proposes the creation of a detailed multidimensional poverty measure for Chile. Following Alkire-Foster and the precedent set by Mexico, the final report of the
19
The first Ficha CAS grouped households in five categories, identifying those in the first three categories of the socio economic scale as poor. The second Ficha CAS (Ficha CAS-II) computed a score using data from 13 variables on housing, education, labor and income and assets.
20
Since the mid-eighties, Chile has measured poverty based on the indirect method using income and a poverty line (both poverty and extreme poverty lines are used to gauge poverty in Chile). Poor people are identified as such when their per-capita income lies below a predetermined absolute poverty line.
21
second presidential commission (Comisión para la Medición de la Pobreza 2014) proposes a multidimensional poverty measure based on five dimensions aligned with Chilean social policy and current law: education, health, labor and social security, housing and environment, and social capital. Unfortunately, some of the indicators22 in their proposed index are not currently available in the existing household survey data, making it difficult to operationalize it. Additionally, the commission proposes to estimate multidimensional poverty at the household level, using individual variables as well as household variables. This could create some problems with their poverty identification; for example, a household is identified as deprived in learning achievement if one or more students in the household score “insufficient” (as defined by the national agency for education quality, Agencia de Calidad de la Educación) in the national standardized test. This is clearly an individual deprivation that is difficult to extrapolate at the household level, particularly if several students in the household score above that threshold and only one is lagging behind.
V. Data and Methodology
a. Data
Since the mid eighties, the Government of Chile has conducted the CASEN. This survey aims at providing critical information, which can be used to design and evaluate social policies on a regular basis (in biennial or triennial intervals). Today, the Ministry of Social Development conducts the CASEN survey. This ministry is in charge of the evaluation of social programs and the estimation of the official poverty estimates.
This multipurpose survey was designed to study the living standards of the population with a special focus on poverty. The data help the government identify priorities for social policy and evaluate programs across time. In particular, this survey provides the data to estimate the extent of poverty and income distribution as well as help detect the needs and demands of the population. To estimate multidimensional poverty in Chile, this study uses the latest CASEN
22
(2011) data set, which aggregates information on demographics, education, health, labor, income, housing and assets for 200,302 individuals from all 15 regions of the country.
The design of the survey is based on two probabilistic independent samples that share the same sample design. The sample design corresponds to a probability sample, stratified geographically and by population size. The sample selection is done in two or three stages in both urban and rural areas. The primary sampling units (PSU) are selected with probability proportional to size, and final stage units (households) are selected with equal probability within each PSU. The target population of the survey is the people living in private homes throughout the country, excluding the areas of difficult access defined by National Institute of Statistics (INE). Within each selected household, all families and persons declaring residence were interviewed. The survey data are representative nationally and regionally, and embody statistical representativeness for urban and rural areas.
b. Methodology
This study makes use of the multidimensional poverty method proposed by Alkire and Foster (2011a). The estimator proposed by these authors represents a generalization of the Foster-Greer-Thorbecke (FGT) family of poverty measurements (Foster et al. 1984), which consist of a dual cutoff for identification and aggregation. The first cutoff corresponds to the
poverty line for each dimension or indicator (zi), and the second (k) determines the percentage of
multidimensional poverty identification).
The model uses the identification function proposed by Bourguignion and Chakravarty (2003) that serves as the base for the Alkire-Foster method followed in this study.
, where 𝜌! 𝑦!;𝑧 =
1 𝑖𝑓 𝜃 𝑦!;𝑧 ≥𝑘
0 𝑖𝑓 ∼ given 𝛼≥ 1, the n x m matrix 𝑔!(𝑘) takes the
following form:
𝑔!(𝑘)!" =
(1−!!"
!!)
!
𝑖𝑓 𝑦!" < 𝑧! 𝑎𝑛𝑑 𝜌! 𝑦!;𝑧 = 1
0 𝑖𝑓 ~
where the parameter k represents the
cutoff for identification of those multidimensionally poor. This matrix has a row of zeros for those individuals who are not multidimensionally poor and the poverty gap for each dimension
for those with achievements below the threshold.
This methodology proposes three main indicators: H, A and Mα. H is the multidimensional headcount ratio defined as H=q/n where q is the number of poor identified by the dual cutoff strategy and n is the total population. Similar to a one-dimensional head count
ratio, this index is easy to compute and understand; however, it provides little information on the depth of poverty. A or the intensity of poverty, provides information on the depth of deprivations that poor people experience, by calculating a censored vector of deprivations Ci(k), which counts
the deprivations for each person identified as multidimensionally poor under a k cutoff.23 Finally,
Mα is the multidimensional index that provides information on both the proportion of poor and their joint levels of deprivation.
𝑀! 𝑦;𝑧 =
!
!"
𝑤!( 𝑔! 𝑘 !")!
!
!!! !
!!! with α ≥ 0
Parallel to the FGT one-dimensional poverty measurements, and depending on α, the indicator Mα accounts not only for deprivation levels (when α = 0) but also the depth of deprivations (when α =1, adjusted poverty gap) and, when α =2 (adjusted square poverty gap), can also account for the inequality of deprivations among the poor.
23
A, or the intensity of poverty, is calculated as follows:𝐴= !"(!) ! !!!
! , andit represents the average percentage of
weighted indicators that multidimensional poor people are deprived.
)
;
(
y
iz
k
c. Structure of the multidimensional poverty measure
The construction of a multidimensional poverty index involves a set of decisions regarding the unit of analysis, the dimensions and indicators to be included, the way these indicators are weighted, and the different cutoffs or poverty lines to identify deprivation in each indicator.
While the Alkire-Foster approach does not provide clear guidance in terms of which dimensions and indicators should be included to gauge multidimensional poverty, a set of common indicators has been used in most multidimensional poverty measures regardless of their theoretical approach. These core indicators are nutrition, health, education, and housing. The way researchers have dealt with the dilemma of what to include in the multidimensional measure can be summarized in five approaches and their combinations, namely: (i) participatory exercises, (ii) use of a list of indicators that already have public consensus and are legitimized (e.g. the Millennium Development Goals (MDG)), (iii) normative judgments on what people value, (iv) empirical evidence from mathematical models like principal component and factor analysis, and finally (v) data availability.24
Despite efforts to objectify the choices of indicators, weights and deprivation thresholds, this exercise inevitably has some degree of arbitrariness–not so different from the way in which monetary poverty lines are set. Following Sen (1976), the choice of indicators and dimensions in
this chapter represent a normative value judgment rather than a pure technical exercise, and decisions over the indicators are based on the potential of these measures to inform poverty alleviation policymaking as well as to help with its monitoring and evaluation processes. Specifically, the construction of the multidimensional poverty measure presented here draws from previous efforts to measure multidimensional poverty in Latin America (Santos et al. 2010; Roche and Santos 2013; Santos 2013) and normative decisions aligned with Chilean law and current social policy. It also takes into account some of the results of the 2011 study Voices of the Poor.25 The choice of indicators and rationale is discussed in more detail in the next
24
The use of principal component and factor analysis to determine the indicators to measure multidimensional poverty have been abandoned in most recent literature due to its approach, which has been used often detached from the policy objective.
25
subsection.
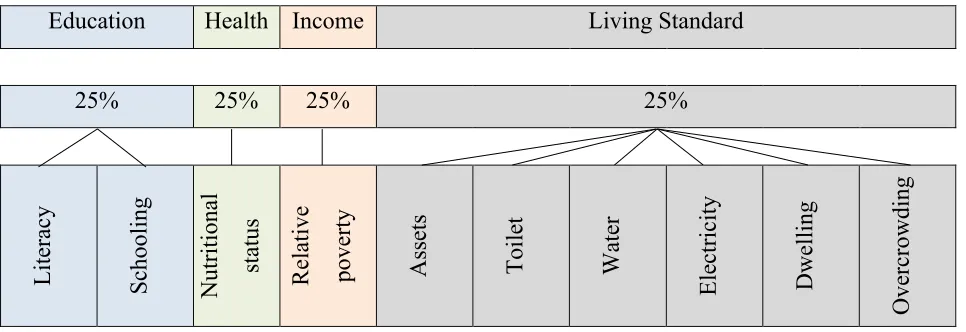
The proposed measure in this study includes four dimensions–education, health, income and living standards–and 10 indicators within these dimensions (see Figure 3.1). The methodology has some similarities to the Global MPI, because it also includes education, health and standard of living as dimensions. However, it differs on some of the indicators included and also incorporates relative income as a new dimension. Analogously to Denis et al. (2010), the unit of analysis in this study is the individual; however, estimates are not calculated separately by age group as they do. Rather, this study estimates a multidimensional index for the entire population, which is different from the one used in the Global MPI, where poverty is measured at the household level. Focusing on the individual versus the household as the unit of analysis has some advantages that are important for policy design. Knowledge of specific deprivations at the individual level could help the government better target programs toward individuals in those precise areas where they are deprived and need the most. Under a household analysis, it could be the case that a household is identified as multidimensionally poor due to health and education deprivations without any specific knowledge on who is deprived in that household being available. In this case the policy response for better access to education and health services is quite different if those deprived in the household are adults rather than children. Thus an analysis at the individual level can provide richer information to help identify specific policy responses.
The structure of the MPI in this study differs from Santos et al. (2010) in the sense that it
is not an attempt to rank or compare results across countries. Thus the issue of data availability and comparability across countries is not present and does not limit the choice of indicators as it does for Santos et al. (2010).
Figure 3.1 Composition of the multidimensional poverty measure
Education Health Income Living Standard
25% 25% 25% 25%
L it era cy S chool ing N ut ri ti ona l st at us Re la ti ve pove rt y
Assets Toi
le t Water E le ct ri ci ty D w el li ng O ve rc row di ng
d. Dimensions and indicators
Education: Education is one of the dimensions most prevalent in any multidimensional poverty measure, since it represents the main way for people to develop skills that allow them to participate in productive activities and enhance their economic autonomy. Furthermore, education enables individuals to participate in society, knowing their rights and obligations as citizens, and live the lives they choose to live. Thus, education provides individual freedom and enhances the possibility for human development. Additionally, education corresponds to the second MDG, which also helps legitimize the inclusion of this dimension in measurement.
Under the education dimension, two indicators are evaluated: literacy and schooling. Literacy corresponds to whether an individual is able read and write. This question is only asked to people above 15 years of age; thus individuals below age 15 cannot be identified as deprived with this indicator. Schooling sheds light on the education level of the individual, as measured by years of formal education. The deprivation cutoff for this indicator is directly linked to education
Health: The health dimension is also widely incorporated in multidimensional poverty and human development measures, and it is directly linked to goals 4, 5 and 6 of the MDG.26 Good health is fundamental for an adequate life; it allows proper physical and mental functioning and represents a basic condition for the development human beings. Poor health limits the ability to acquire knowledge, take advantage of work and social opportunities, and function adequately in almost all activities of daily life. As a way to gauge deprivation in health, several variables are used. For children under 7 years of age, health deprivation is identified in children who are malnourished, at risk of malnutrition, or obese. For the elderly (above 60 years old), health deprivation is determined based on whether individuals are either underweight or obese according to their senior citizen health card.27 For the rest of the population not captured by these two variables, a self-reported health status variable is used to determine health deprivation. The survey asks participants to rate their answer to the question “How would you rate your health status?” on a scale from 1 (very bad) to 7 (very good). Using this variable, deprivation is identified in cases where self-assessment is below 4.
Income: Incorporating income in the multidimensional poverty measure has been proposed by several authors (see the previous literature review section) as a way to incorporate material hardship and the ability to attain a minimum basket of goods and services (this basket is made up of food and non-food components). A straightforward way to identify income poverty is to use the national or extreme poverty line; however, this absolute poverty line fails to account
for social exclusion. Thus, for this study a relative poverty line is incorporated in the measure as
"relative poverty reflects better the cost of social inclusion and equality of opportunity in a
specific time and space" (Bradshaw et al. 2012). The use of a relative poverty line has been
particularly relevant in the case of Chile since it entered the Organization for Economic
Co-operation and Development (OECD) in 2010: "Once economic development has progressed
beyond a certain minimum level, the rub of the poverty problem – from the point of view of both
the poor individual and of the societies in which they live – is not so much the effects of poverty
in any absolute form but the effects of the contrast, daily perceived, between the lives of the poor
and the lives of those around them. For practical purposes, the problem of poverty in the
industrialized nations today is a problem of relative poverty” (UNICEF 2009, 9). Deprivation
26
MDG 4, 5 and 6 are: reduce child mortality rates; improve maternal health; and combat HIV/AIDS, malaria, and other diseases respectively.
27
below this relative poverty line is set to be at 50% below the median income, a common poverty
line used and reported by the OECD countries and most developed nations.
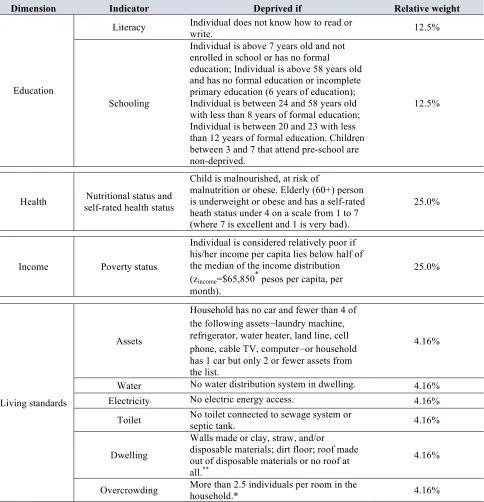
Living Standard: Similarly to what has been included in other multidimensional measures and the Global MPI, the proposed measure in this study contains a set of indicators under the Living Standard dimension. These indicators correspond to resources and measure basic housing adequacy, access to basic services and assets holdings–indicators identified as important both by the MDGs and the Chilean Government. Under this dimension, six indicators are included: assets, water, electricity and toilet access, dwelling characteristics, and overcrowding. Deprivation poverty lines (zi) for these indicators are presented in Table 3.1. Even
though some of these indicators are correlated with income, they provide information on access to basic services, and can shed light on individual behavior (choices) as well as the government’s capacity to provide the population with basic services in remote areas.
Table 3.1 Dimensions, indicators, cutoffs and weights28
Dimension Indicator Deprived if Relative weight
Education
Literacy Individual does not know how to read or
write. 12.5%
Schooling
Individual is above 7 years old and not enrolled in school or has no formal education; Individual is above 58 years old and has no formal education or incomplete primary education (6 years of education); Individual is between 24 and 58 years old with less than 8 years of formal education; Individual is between 20 and 23 with less than 12 years of formal education. Children between 3 and 7 that attend pre-school are non-deprived.
12.5%
Health Nutritional status and self-rated health status
Child is malnourished, at risk of
malnutrition or obese. Elderly (60+) person is underweight or obese and has a self-rated heath status under 4 on a scale from 1 to 7 (where 7 is excellent and 1 is very bad).
25.0%
Income Poverty status
Individual is considered relatively poor if his/her income per capita lies below half of the median of the income distribution (zincome=$65,850
*
pesos per capita, per month).
25.0%
Living standards
Assets
Household has no car and fewer than 4 of the following assets–laundry machine, refrigerator, water heater, land line, cell phone, cable TV, computer–or household has 1 car but only 2 or fewer assets from the list.
4.16%
Water No water distribution system in dwelling. 4.16%
Electricity No electric energy access. 4.16%
Toilet No toilet connected to sewage system or
septic tank. 4.16%
Dwelling
Walls made or clay, straw, and/or
disposable materials; dirt floor; roof made out of disposable materials or no roof at all.**
4.16%
Overcrowding More than 2.5 individuals per room in the
household.* 4.16%
Note: * This amount corresponds roughly to $115 dollars per capita, per month or to a $3.8 dollar a day poverty line.
**
The criteria used here is in line with the approach the Ministry of Housing, uses to determine housing deficiencies and overcrowding.
VI. Analysis of Results
28
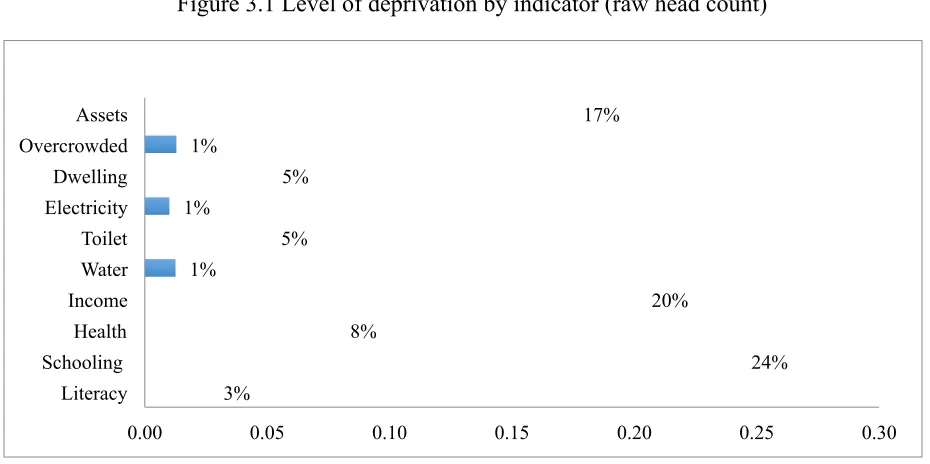
Before analyzing the joint distribution of deprivations using the Alkire-Foster method, an examination of each of the indicators included in the multidimensional poverty index provides a sense of raw (or uncensored) level of deprivation in each dimension in 2011. Figure 3.1 shows the uncensored headcount of deprived individuals using each indicator.29
[image:25.612.70.535.388.620.2]The highest level of deprivation is in schooling, with 24% of the population deprived in this indicator, followed by income, which has a 20% level of deprivation, and assets holdings with 17%. This analysis is what Ravallion (2011) referred to as a “dashboard approach,” or one in which governments or policymakers are able to track the development trend of a set of indicators over time as a way to follow progress in different areas. This approach, however, does not help us understand the relationship between these indicators; in other words, it does not provide any information on the joint distribution or connection between these indicators or achievements. Thus, a multidimensional index like the MPI is used to better understand how several deprivations simultaneously affect a person or a household (i.e., the level of joint deprivation).
Figure 3.1 Level of deprivation by indicator (raw head count)
Source: Author’s construction based on CASEN 2011 cross-section data.
Table 3.2 shows the multidimensional poverty headcount ratio (H), the average deprivation level of those identified as multidimensionally poor (A), and the M0 index for
29
Uncensored headcount refers to the deprivation level in each indicator before the multidimensional identification cutoff (k) is applied.
3%
24% 8%
20% 1%
5% 1%
5% 1%
17%
0.00 0.05 0.10 0.15 0.20 0.25 0.30 Literacy
different cutoffs (k). As k increases, the multidimensional poverty headcount decreases, as does
M0; however, the average deprivation level of those in poverty increases. It is worth noticing
that, at 70% or more, multidimensional poverty deprivation is negligible (that is, in 2011 almost no one in Chile was deprived in 70% or more of the weighted indicators at the same time). When the poverty cutoff (k) is set at 33.33% (or one third of the weighted indicators), 12% of the population is classified as multidimensionally poor, with an average level of deprivation of 45%.30 The main drivers of the national multidimensional poverty are the higher levels of deprivation in income, education and health. Indicators under the living standard dimension (access to water, electricity and toilet) appear to be more adequately covered when compared to the other three dimensions.
These results differ from those found for Chile in Santos et al. (2010), given the different composition of the MPI used as well as the different k set utilized for identification. Additionally, a direct comparison of their results is impossible due to the difference in years studied. Their latest results for Chile correspond to 2006 results, while this study explores multidimensional poverty for 2011. Some trends regarding the difference between urban and rural areas are similar, as explained below. The same is true when comparing the results of Denis et al. (2010) and their findings.
In terms of rural-urban31 disaggregation, the urban areas have fewer multidimensional poor individuals than the rural areas at all levels of k. The same is true for the average
deprivation levels. However, the difference in average deprivation is less pronounced than the difference in headcount ratio between urban and rural areas. At k=33, the headcount is 9% in urban areas and 27% in rural areas; this difference is mainly driven by the differences in access to water, inadequate housing, education attainment and income (see Figure 3.3).
30
The 33.33% cutoff is widely used in the literature as the identification cutoff. In fact, that cutoff is the one used to identify the multidimensional poor in the Global MPI. This study uses the same threshold for identification.
31
Table 3.2 Multidimensional poverty estimates under different identification cutoffs (k)
Total Urban Rural
k H A M0 H A M0 H A M0
10 0.41 0.27 0.11 0.38 0.26 0.10 0.62 0.32 0.20
20 0.28 0.34 0.09 0.25 0.33 0.08 0.46 0.38 0.17
30 0.12 0.45 0.05 0.09 0.44 0.04 0.27 0.46 0.12
33 0.12 0.45 0.05 0.09 0.44 0.04 0.27 0.46 0.12
40 0.07 0.51 0.03 0.05 0.50 0.03 0.17 0.52 0.09
50 0.03 0.58 0.02 0.03 0.57 0.02 0.07 0.61 0.04
60 0.01 0.69 0.01 0.01 0.68 0.01 0.03 0.71 0.02
70 0.00 0.77 0.00 0.00 0.77 0.00 0.02 0.78 0.01
80 0.00 0.85 0.00 0.00 0.85 0.00 0.00 0.86 0.00
90 0.00 0.92 0.00 0.00 0.92 0.00 0.00 0.92 0.00
100 0.00 0.00 0.00 0.00 0.00 0.00 0.00 0.00 0.00
[image:27.612.73.537.349.647.2]Source: Author’s construction based on CASEN 2011 cross-section data.
Figure 3.3 Urban versus rural censored deprivations at k=33
Source: Author’s construction based on CASEN 2011 cross-section data.
Table 3.3 provides a disaggregation by sex to evaluate whether there are any differences in multidimensional poverty between men and women. The results show that there are no major
0.00 0.05 0.10 0.15 0.20 0.25
Literacy
Schooling
Health
Income
Water
Toilet Electricity
Dwelling Overcrowding
Assets
Urban
Rural
differences between women and men: women are slightly more deprived than men (0.45 versus 0.44 average deprivations among the multidimensionally poor) and their headcount is one percentage point above the average headcount for men, a non-statistically significant difference. Figure 3.3 displays the different levels of deprivations in each indicator for women and men. Women identified as multidimensionally poor are worse off than men in terms of health, education, and income, and to a lesser extent, in access to water.
Table 3.3 Multidimensional poverty estimates by sex
Total Urban Rural
k=33 H A M0 H A M0 H A M0
Women 0.12 0.45 0.05 0.10 0.44 0.04 0.28 0.46 0.13
Men 0.11 0.44 0.05 0.08 0.44 0.04 0.26 0.46 0.12
[image:28.612.75.552.396.654.2]Source: Author’s construction based on CASEN 2011 cross-section data.
Figure 3.3 Level of censored deprivations by sex at k=33
Source: Author’s construction based on CASEN 2011 cross-section data.
0.0% 2.0% 4.0% 6.0% 8.0% 10.0%
Literacy
Schooling
Health
Income
Water
Toilet Electricity
Dwelling Overcrowding
Assets
Women censored deprivations
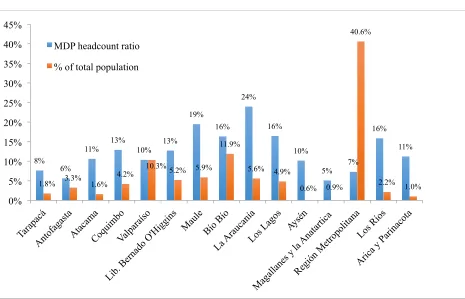
A sub-national level analysis can be useful from a regional development perspective. Chile is a highly centralized country where the regional government is an extension of the central government; sectoral ministries operate at the regional level through the Ministry Regional Bureaus (SEREMIS), deciding which projects and programs will be implemented in each region. Thus, evidence on multidimensional poverty at the regional level provides relevant information
that could improve the resource allocation process and help guide projects and program choices
by highlighting the development gaps in each region.
Chile is divided into 15 regions, 54 provinces and 346 municipalities. A regional
governor (Intendente Regional), directly appointed by the president, heads each region, while
each municipality is governed by a mayor directly elected by the community every four years
(see Appendix 1. for a map of Chile and its regions). At the local level, each municipality carries out several social programs like primary and secondary education (through municipal public schools), primary health care (through municipal primary care units), and the provision of monetary subsidies coupled with other administrative services, such as identification cards, business permits, and the collection of local taxes (e.g., car registrations and real-estate taxes). Resources for these functions come from local taxes and a redistributive fund (Fondo Común
Municipal)32 that reallocates some resources between richer and poorer municipalities as a way to ensure proper municipality functions.
On the other hand, regional governments’ budgets are defined each year in the National
Annual Budget Law. Each region has its own Regional Development Strategy (Estrategia de Desarrollo Regional) to guide development priorities for the next eight to ten years (SUBDERE, 2014). Large infrastructure projects like hospitals, housing projects, schools, and public works are negotiated with the central government through the SEREMIS. Projects must first be presented to the Ministry of Social Development to be approved as a viable project before applying for funds from the Regional Development Fund (Fondo Nacional de Desarrollo Regional).
Having a tool that provides regional level information on several deprivations could be an additional persuasive instrument to use in diagnostic reports to justify new services and projects. It could also provide grounds for the need for service expansion and reallocation of resources to
32
elevate the quality of life of individuals living in the regions.
Given the geography of the country and its diverse climates, the north, south and center regions are quite different from one another. Additionally, natural resources and industry development are not evenly distributed across Chile. The north of the country, where the Arica y Parinacota, Tarapacá, Antofagasta and Atacama regions are located, is characterized by a large desert (the driest in the world), which heavily limits agriculture activities; however, Antofagasta houses the largest copper mines in the country, thus giving it the highest Regional GDP per capita. Similarly, mining activities and related industry in Tarapacá and Atacamaaccount for the large share of total Chilean activity and employment in these regions (Consejo Minero 2014). Arica y Parinacota, on the other hand, has one of the lowest GDPs per capita; it is only slightly higher than that of La Araucanía, located in the south of Chile.
Chile’s central regions are characterized by their Mediterranean climate, making agriculture one of their most important economic activities. Agriculture is the main economic venture in Libertador Bernardo O´Higgins, Maule, and Bío Bío, regions located in the center of the country (see Appendix 6). The south is more sparsely populated and tends to lack proper connectivity due to its geography. However, its natural wonders attract visitors, and thus tourism represents a significant share of the south’s regional economy. Additionally, in the south of Chile, and particularly in the Lagosregion, fishing industries account for 40% of the total fishing GDP of the country (see Appendix 6). Given these wide differences between regions, in terms of
natural conditions as well as the main livelihood sources for the populations, it is important to clearly identify the particular dimensions where people in each region could be deprived in order to guide sub-national policies and the regional development strategies.
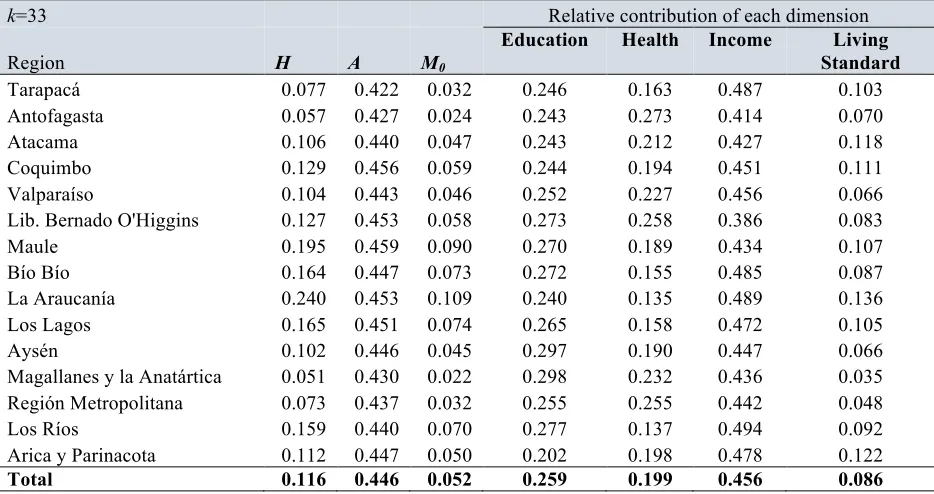
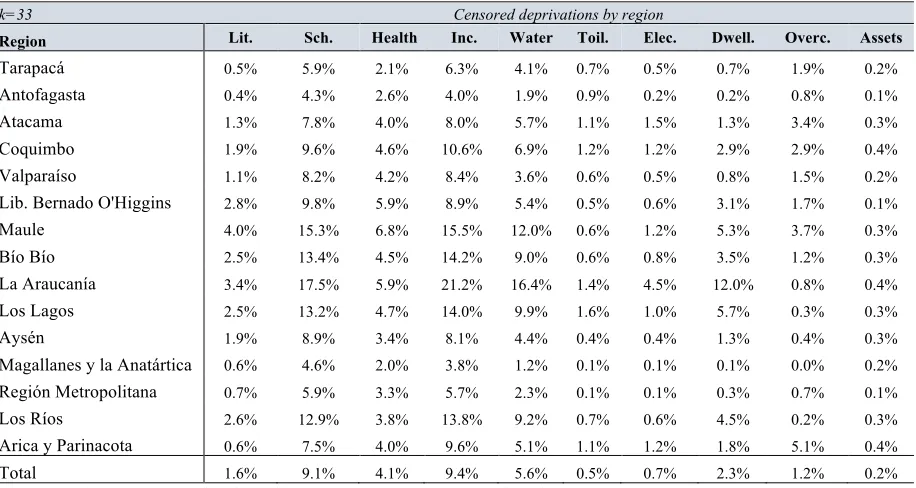
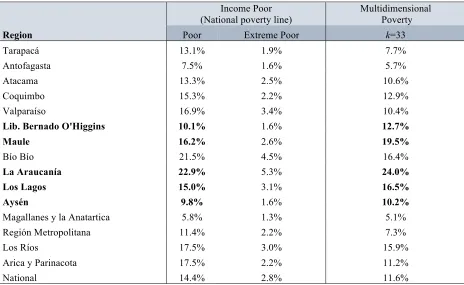
Tables 3.4 and 3.5 provide the results of multidimensional poverty estimations broken down by region, accompanied by the relative contribution of each dimension to M0 and the
censored deprivation level for each indicator by region.33 The region with the highest multidimensional poverty headcount is La Araucanía, followed by Región del Maule, with 24% and 20% head count ratios respectively–well above the 12% national average, as well as above
28
their own income poverty headcount. At the other end, Magallanes and Antofagasta34 show the lowest multidimensional poverty prevalence. Regardless of the headcount heterogeneity, it is worth noting that the average deprivation experienced by those identified as multidimensionally poor does not differ significantly between regions; the average deprivation (A) ranges from 42% in Tarapacá to 46% in Maule.
Table 3.4 Multidimensional poverty measures and relative contribution of each dimension by region
k=33 Relative contribution of each dimension
Region H A M0
Education Health Income Living Standard
Tarapacá 0.077 0.422 0.032 0.246 0.163 0.487 0.103
Antofagasta 0.057 0.427 0.024 0.243 0.273 0.414 0.070
Atacama 0.106 0.440 0.047 0.243 0.212 0.427 0.118
Coquimbo 0.129 0.456 0.059 0.244 0.194 0.451 0.111
Valparaíso 0.104 0.443 0.046 0.252 0.227 0.456 0.066
Lib. Bernado O'Higgins 0.127 0.453 0.058 0.273 0.258 0.386 0.083
Maule 0.195 0.459 0.090 0.270 0.189 0.434 0.107
Bío Bío 0.164 0.447 0.073 0.272 0.155 0.485 0.087
La Araucanía 0.240 0.453 0.109 0.240 0.135 0.489 0.136
Los Lagos 0.165 0.451 0.074 0.265 0.158 0.472 0.105
Aysén 0.102 0.446 0.045 0.297 0.190 0.447 0.066
Magallanes y la Anatártica 0.051 0.430 0.022 0.298 0.232 0.436 0.035 Región Metropolitana 0.073 0.437 0.032 0.255 0.255 0.442 0.048
Los Ríos 0.159 0.440 0.070 0.277 0.137 0.494 0.092
Arica y Parinacota 0.112 0.447 0.050 0.202 0.198 0.478 0.122
Total 0.116 0.446 0.052 0.259 0.199 0.456 0.086
Source: Author’s construction based on CASEN 2011 cross-section data.
Relative contributions show the level of deprivation in each dimension for those identified as multidimensionally poor; these results are directly related to the weight structure used. In the case of Chile as a whole, deprivation in income contributes to roughly 46%, while education contributes 26% and health 20%. Living standards, on the other hand, contribute much less to the overall MPI with only 9%; this also reflects the fact that this dimension has a higher
number of indicators and thus a lower nested weight for each. Table 3.4 also sheds light on the differences between regions in terms of each dimension’s contribution to M0. For example,
health dimension is relatively more important in Antofagasta that in La Araucanía, while income
34