Munich Personal RePEc Archive
Peer Effects and Students’ Self-Control
Buechel, Berno and Mechtenberg, Lydia and Petersen, Julia
University of Hamburg
28 January 2014
Online at
https://mpra.ub.uni-muenchen.de/53658/
1
Peer Effects and Students’ Self-Control
Berno Buechel
a, Lydia Mechtenberg
a,*, and Julia Petersen
aaDepartment of Economics, University of Hamburg
January 28, 2014
Abstract
We conducted a multi-wave field experiment to study the interaction of peer effects and self-control among undergraduate students. We use a behavioral measure of self-self-control based on whether students achieve study related goals they have set for themselves.
We find that both self-control and the number of talented friends increase students’ performance. We then set out to test the theoretical prediction of Battaglini, Bénabou and Tirole (2005) that (only) sufficiently self-controlled individuals profit from interactions with peers. We find that peers with high self-control are more likely to connect to others, have a higher overall number of friends and have a higher number of talented friends. Moreover, positive news about self-controlled behavior of their peers increases students’ own perseverance. Hence, our findings are consistent with the model of Battaglini, Bénabou and Tirole. In addition, we find that female students are more likely to have high self-control, but do not outperform male students. One reason for this is that female students have a lower number of talented friends than their male counterparts, thereby profiting less from positive peer effects.
Keywords: Self-control; Peer Influence; Social Networks; Goals; Time preferences;
Procrastination; Willpower; School Performance; Experiment
JEL-Classification: C93; D85; I21; J24
_________________________
2
1 Introduction
Successful performance, be it in school or at university, at the job or in leisure activities, depends both on persistence in what one is doing and on knowledge about how it is to be done. Persistence requires self-control, i.e., the ability to resist temptations to procrastinate; while knowledge of how to best achieve a goal can be acquired from more advanced peers. How self-control – or the lack thereof – can influence behavior and finally
performance is studied by the literature on present-biased preferences1; whereas a mostly
empirical literature on peer effects investigates how an individual’s achievement depends on
her relation to her peers.2 We contribute to both strands of the literature by providing the first
experimental study on how peer effects in social networks interact with individual self-control. Combining a field experiment with surveys, we show that more self-controlled students are better connected to their peers, have better access to highly talented peers and write better exam grades than students with low self-control.
Present-biased preferences lead to self-control problems that affect performance: For instance, a student might want to study hard in the evening in order to be well prepared for class the next day. However, when evening actually arrives, the now immediate psychological costs from studying become much more salient than the still relatively far-away benefit from being well prepared, and the student is severely tempted to go out instead. More generally, if a disproportionally high weight is attached to whatever costs or benefits would accrue immediately, then plans implying that investments precede benefits will be likely to fail due to the temptation to avoid immediate costs. Since performance plans typically are of this kind, a present bias can impede performance.
But performance also depends on the interaction with peers: Peers with high levels of human capital can improve the performance of their friends in multiple ways, for instance, by intentionally or unintentionally providing them with important information or acting as a role model. Importantly, individual self-control might mediate the access to peers with high levels of human capital. For instance, if connecting to peers and maintaining these links in the long run requires self-control, or if only sufficiently self-controlled individuals can profit from
1
For theoretical contributions see, e.g., Strotz (1955), Thaler and Shefrin (1981), Ainslie and Haslam (1992), Laibson (1997), O’Donoghue and Rabin (1999), Gul and Pesendorfer (2001), Bénabou and Pycia (2002), and Fudenberg and Levine (2006). Recent experimental contributions on time preferences include Ariely and Wertenbroch (2002), Andersen et al. (2008), Benhabib, Bisin and Schotter (2008) and Andreoni and Sprenger (2012).
2
3
friends with high levels of human capital, then self-control will not only have a direct but also an indirect effect on performance that is mediated by peer effects.
Despite this rather obvious possibility, the literatures on self-control and peer effects have hitherto remained separated. One notable exception is the contribution of Battaglini, Bénabou and Tirole (2005). Their theory of peer effects on self-control provides us with our main hypotheses. In their model, individuals have imperfect knowledge about their own self-control, but know that levels of self-control are positively correlated within their peer group. Hence, observing how peers react to temptations provides individuals with additional information about their own level of self-control. This, in turn, affects their self-confidence and consequently the degree to which they themselves exhibit self-controlled behavior in the future. Intuitively, observing how peers can handle similar challenges to their willpower can be encouraging or discouraging (“if he can do it, then so can I” or “if not even he can do it, then I do not even have to try”). The theory of Battaglini, Bénabou and Tirole (2005) can explain the existence and workings of self-help groups, but also applies more broadly, including our context of students’ learning groups. In our field experiment, we elicit both the individual self-control and the social network of our students and provide them with information about the self-control of some of their peers. Our findings are consistent with the theory provided by Battaglini, Bénabou and Tirole (2005). In particular, we find evidence for their prediction that individuals with low self-control remain unconnected to their peers while individuals with sufficiently high self-control connect to them. In addition, we find that connectedness improves performance, which is in line with both the theory and the empirical results of Calvó-Armengol, Patacchini and Zenou (2009). Specifically, we find that it is
connectedness to talented friends that matters in improving performance.
4
Our paper is also related to a literature that has studied whether commitment devices can help overcome self-control problems. Ariely and Wertenbroch (2002) study the effect of self-imposed and externally-imposed deadlines on performance in another field experiment. They show that both (evenly-spaced) externally-imposed and self-imposed deadlines have a positive effect on performance. However, as Burger, Charness and Lynham (2011) find in a related field experiment, externally-imposed deadlines do not always increase performance. Houser et al. (2010) conducted a laboratory experiment to elicit individuals’ willingness to pay for commitment in a game in which the participants repeatedly face temptations. The authors find that the average willingness to pay is positive and the choice of whether or not to buy commitment depends on the costs of the commitment device in question. Our contribution to this literature is mainly methodological and consists in the way we construct our behavioral measure of self-control: We categorize those individuals as possessing high levels of self-control who stick to their self-imposed deadlines and who, after buying costly partial commitment, do not violate it afterwards. In particular, students are classified as exhibiting low self-control if they do not manage to hand in their midterm homework before a non-binding deadline they had chosen at the beginning of the semester, or if they missed out a micro workshop in which they had previously enrolled. To our knowledge, we are the first to combine within one study the experimental measurement of self-control with the measurement of subjects’ social network.
The empirical literature on peer effects has proposed different methods to solve the standard identification problems as outlined by Manski (1993). Possible approaches to overcome these problems include random assignment to a group or to a treatment, the use of non-linear models or network models. All approaches incorporate the assumption that an
individual’s outcome is determined by the mean outcome and characteristics of her peers.3
Recent studies that find a positive relation between being observed by peers and individual performance are, e.g., Falk and Ichino (2006) and Mas and Moretti (2009). By contrast, our focus is not on how observability by peers affects performance. Rather, we study how
observing peers, in particular their self-control, affects individual goal-setting.4 We find that
goals are increasing in observed self-control of peers.
While our main focus is on self-control and peer effects, we also contribute to the experimental literature on gender differences. Surprisingly, we find that women profit less
3
Three notable exceptions are the empirical study of Calvó-Armengol, Patacchini and Zenou (2009), the field experiment by Falk and Ichino (2006) and the natural experiment by Sacerdote (2001).
4
5
from positive peer effects than men with comparable levels of human capital: Although women have more self-control than men, they do not outperform the latter.
The remainder of this paper is structured as follows. In section 2, we derive our hypotheses, mainly referring to the theory provided by Battaglini, Bénabou and Tirole (2005). Section 3 reports our experimental design and section 4 our main results, including our findings on the relation between the social network characteristics of (male and female) students and peer effects on performance. In section 5, we first describe our experimental intervention by which we inform students about highly self-controlled behavior of their peers and then report the results. We discuss our findings and conclude in section 6.
2 Hypotheses
Individuals who achieve their goals are typically more self-controlled than those who set the same goals but fail to achieve them. We use this insight to implement a behavioral measure of self-control in our experiment. In theory, individuals learn from their experience
and adjust their goal-setting behavior to their perceived level of self-control.5 Consequently, a
behavioral measure of self-control can best be obtained from goal achievement at early stages of this learning process, i.e., from observing how well individuals not yet fully informed about their own self-control relate to their early goals. Hence, we (behaviorally) equate high self-control with a high level of early goal achievement.
We are now in a position to formulate our first two hypotheses:
H1 Performance increases in self-control, i.e., in early goal achievement.
H2 Individuals with high self-control invest more effort into achieving their goals
than individuals with low self-control.
Our main question is how self-control interacts with one’s position in a social network and thereby with standard peer effects. The only existing theory that addresses this question is provided by Battaglini, Bénabou and Tirole (2005), henceforth BBT. Their results show that only sufficiently self-controlled individuals profit from the interaction with peers; but they profit more from peers who are similar to them in terms of self-control. When individuals can anticipate the benefits that arise from forming connections (cf. Jackson and Wolinsky, 1996), two testable predictions of the BBT model are, first, that only sufficiently self-controlled
5
6
individuals have a strictly positive number of links to others, and, second, that self-control is correlated among direct friends.
The BBT model does not account for human capital. However, it is easy to see how an extended reasoning along its lines can be used to bridge the gap between the literature on control and the literature on how human capital of peers can affect achievement: Since self-controlled people tend to persist in their performance plans, they tend to acquire more human capital. Consequently, they become more valuable peers with regard to the peer effects on achievement that can be expected from them. If indeed only sufficiently self-controlled individuals connect with others, as the BBT model suggests, then only sufficiently self-controlled individuals will enjoy positive peer effects on their performance. Hence, we hypothesize:
H3 Performance increases in the number of talented friends.
H4 People with high self-control (a) are more likely to connect to others, (b) have
a higher overall number of friends, and (c) have a higher number of talented
friends.
If we look deeper into the BBT model, an even subtler way emerges in which individual self-control and connections to peers affect each other: Not only does self-control affect the individuals’ social network (and thereby their access to positive peer effects on performance); but it does so because peers also affect self-control itself. Individuals profit from good news about the self-control of their peers: By increasing their prior about their own ability to retain self-control, observable self-controlled behavior of their peers increases individuals’ effort to resist temptations. By contrast, bad news about their peers’ self-control harms individuals by decreasing their confidence in their own ability to resist temptations, making them more likely to give in. For ethical reasons, we can only test the good-news prediction. In particular, we hypothesize that effort is increasing in the revealed effort of peers. Besides actual effort, also planned effort can be considered since goal-setting is one way to invest into self-control. Thus, we additionally conjecture that good news about the self-control of one’s peers increases self-set goals while bad news lowers them. Our last hypothesis is:
H5 Planned effort (a self-set goal) and actual effort both increase in revealed
7
3
Experimental Design and Implementation
3.1 Experimental Procedure
We conducted our experiment in an undergraduate microeconomics course at the University
of Hamburg in the summer semester of 2013.6 In total, 117 first-year students regularly
participated in the lecture and the tutorials.
Our experiment was conducted in the following five waves:
1. Survey on aspired course grades and current study time
2. Survey on intermediate goals and partial communication of others' study time
per week
3. Measurement of intermediate goal achievement
4. Elicitation of students’ social network and preferences
5. Exam
In the first two waves, we conducted surveys and implemented one experimental intervention in the tutorial classes. In the fourth wave, we conducted a paper-and-pencil experiment and the final survey in the lecture class. Students could never anticipate upcoming waves, and they were not told before the beginning of the fourth wave that they were part of an experiment. Rather, they were told that some faculty wanted to analyze students' learning conditions and study behavior. Moreover, the experimenters who actually entered classes
were not involved in teaching the lecture or tutorial courses.7 The teaching assistants were
informed about who would enter their classes on which days and were told that the
interventions they witnessed were part of a study on student behavior.8 They have never been
informed about the fourth wave of the experiment or about the purpose of the first three waves before the end of the semester. Furthermore, they were instructed not to provide possible interpretations of our study to the students. Apparently students accepted our
6
In Hamburg, like in most German cities, courses in the summer semester are taught from beginning of April to mid July.
7
The experimental team that actually entered the classes to conduct the experiment consisted of two of the three authors of this paper. The third author, Lydia Mechtenberg, committed both not to act as an experimenter in class and not to receive the data set in a non-anonymized form, since she was the lecturer of the microeconomics course. Exams were graded by the teaching assistants who did not know the purpose of the study and never received access to the data set.
8
8
explanation of the interventions in their classes and never approached an experimenter or teaching assistant on this issue. All material used for the experimental interventions and
surveys is collected in Appendix B.9
The first wave In the first wave, we conducted a survey in each tutorial, asking which grades students aspired to and how many minutes they on average studied per week for this specific course.
The second wave The second wave was mainly dedicated to induce students to set goals for themselves at a relatively early stage of the course, since their behavior with respect to these goals allows us to measure students’ self-control at a later point in time. This wave consists of three steps which were conducted in the tutorials. Each teaching assistant announced that several organizational issues were to be settled within the ongoing session of the tutorial course.
1st step: Planned effort We confronted students with a signal about the maximal time a peer in their tutorial has studied (the details of this intervention are described in section 5.1) and asked in a survey how much students planned to study per week for this course in the future. Hence, we elicited individual self-set goals.
2nd step: Intermediate goal with partial commitment Next, a senior student who was not informed about the purpose or content of our study entered the tutorial course and truthfully explained to the students that they could enroll in a non-compulsory one-day micro workshop. Moreover, he mentioned that enrolment was not obligatory for participants but that each student who, though enrolled, would not show up for the workshop would have to pay a fee of 3 EUR. By contrast, participation, both with and without enrolment, was free of charge.
It was also made clear that payment of the fee would be asserted.10 Hence, students were
offered a pre-designed goal (participating in the workshop) together with a commitment device (the fee). Then, the senior student distributed enrolment forms that again mentioned the fee and provided the link to a website where online enrolment for the workshop was possible. Finally, he collected the enrolment forms and left the class.
3rd step: Intermediate goal without commitment The teaching assistant truthfully explained to his students that they had to submit a compulsory midterm assignment in order to be eligible for the final exam. This assignment – a standard problem set – was identical for all students. The quality of the solution was not decisive for students’ admission to the final
9
The material was originally written in German. In Appendix B, we collect the English translations. Format and design of the original material are preserved.
10
9
exam; but their solution had to fulfill the minimum requirement of being a recognizable attempt to solve all problems of the problem set. The teaching assistant explained to his students that they had to choose between two submission deadlines, an early and a late one, which were neutrally framed. He distributed forms on which the two deadlines were specified and the students were asked to individually choose their preferred deadline. Hence, students were offered the possibility of regulating their own future learning behavior by choosing the goal of submitting early. Students were told that their choice was not binding but helpful for organizational purposes. They were also told that assignments handed in after the late deadline would not be considered and excluded the students from the possibility of taking the exam. This information was provided online, too, and was repeated several times in the lecture to make sure that all students enrolled would understand it. To provide a (weak) incentive for students to choose the early deadline, online feedback about the quality of their solution of the midterm assignment was promised to students who submitted prior to the early deadline. No feedback was provided to students who submitted prior to the late but after the early deadline. However, any category of students always had the opportunity to approach their teaching assistant after the tutorials or during the office hours to get any information about any exercise they needed help with. In addition, we instructed the teaching assistants not to provide the correct solutions of the midterm assignments in their online feedback. The online feedback did not provide any real advantage to the students who received it.
The third wave The organizing team of the workshop collected the data about students’ enrolments and their actual participation and passed them on to the experimental team. The workshop took place on a weekend day after the third wave of the experiment. In its course, additional exercises related to the content of the micro course and prepared by the organizing team were discussed. The teaching assistants collected all data about students’ choices of a submission deadline and registered whether students’ actually submitted before the chosen deadline. Again, all data were passed on to the experimental team.
The fourth wave The main purpose of the fourth wave was to elicit students’ networks. We conducted a final survey in which students were asked to name the peers with whom they had joined to prepare themselves for the exam (outside the official lectures and tutorials). These lists of names allow us to reconstruct the social network of learning
relationships within class.11 For each of the listed friends some further survey questions
11
10
specified the kind of relationship, e.g., since when they know each other. We also asked how
they perceived their own, their peers’, and other students’ degree of self-control.12 Moreover,
we elicited their risk preferences for different contexts (among others finance, job, leisure) using the risk module initially implemented in the German Socio-Economic Panel (SOEP) in 2004 (see Wagner, Frick and Schupp 2007). Before the survey, students participated in a paper-and-pencil experiment in which we elicited their time preferences in a context of choices between small short-term payoffs and larger payoffs that would be paid out at more far-away points in the future. To this purpose, we used ten incentivized decisions following the non-parametric method recently introduced by Takeuchi (2011). All payoffs were paid out by online delivery of Amazon vouchers.
The fifth wave Students wrote the final exam either at the beginning or at the
end of the semester break. Thereby they could score between 0 and 90 points.13
3.2 Key Measures
Measuring performance, talent and effort We use the score in the final exam to measure performance, since it fully determines the overall course grades. We also obtained the scores (and grades) from a previous math course as a control variable for talent since a proficiency in math was important both for solving the preparatory problem sets and for doing well in the exam. To account for effort, we use self-reported study times both from the first and the fourth wave.
Measuringself-control We constructed an indicator variable, self control, that measures whether a student behaved in a time-consistent way, i.e., achieved his own intermediate goals. A student’s two intermediate goals are to submit the midterm assignment prior to the deadline that she herself had previously chosen and to participate in the workshop in case that she had registered for participation. Among the 63 students who signed up for the micro workshop, a share of 73% (46 students) attended it. Early midterm assignment was planned by 107 students, but only a share of 73% (78 students) actually delivered early. The
binary variable self control becomes one if the student both submitted prior to her self-chosen
deadline and did not fail to attend the workshop if enrolled. This variable captures self-control well since it assigns low self-control to students who cannot resist the temptation to procrastinate when preparing the midterm assignment or the temptation to spend their
12
Students reported their perceived degree of self-control on a scale between 0 and 10. 13
11
end in a more agreeable way than by attending a workshop that they had planned to attend.14
The basic assumption underlying the construction of the indicator variable is that, as implied by economic theory, the economic concept of self-control can be equated with time-consistent behavior.
In order to test whether time-consistency is stable across different contexts, we used the method introduced by Takeuchi (2011) to construct a second self-control variable which measures individual time-preferences in the monetary context of our paper-and-pencil experiment (fourth wave).
Measuring students’ social network position We created two different variables:
friends and degree. The binary variable friends takes the value one if the student is at all
connected to others, i.e., is part of a study group, and zero otherwise. The variable degree
counts the student’s direct links to others, i.e. the number of learning partners.15 We computed
both variables from the undirected social network. In order to check for robustness of our results we also use variables derived from the directed network.
Differentiation of peers To further substantiate friends’ peer effects we categorize them as talented or untalented according to their math score. The count variable
talented friends counts the number of links to fellow students who have a math score weakly
above 58 points, while the count variable untalented friends counts the number of links to
fellow students who have a math score weakly below 55 points. The chosen threshold makes use of the fact that no student achieved a math score between 55 and 58; and it splits all friends in two categories of equal size.
Descriptive statistics of our most important variables are provided in Table 1.
4 Main
Results
4.1 Determinants of Performance
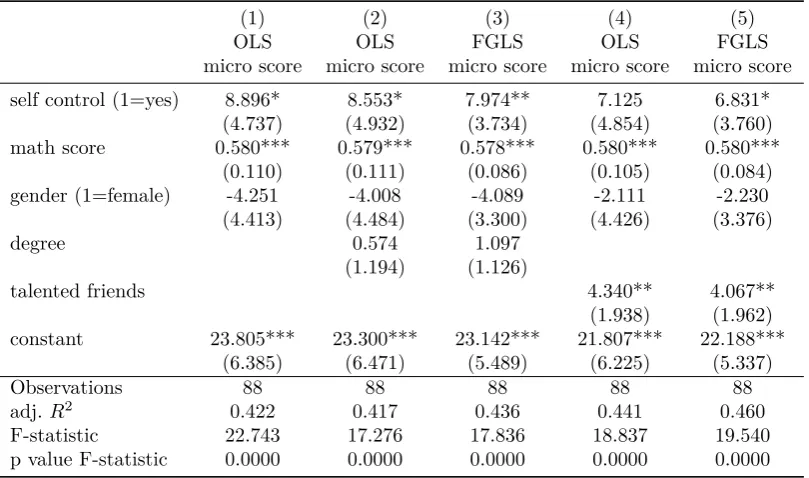
Table 2 displays the results on how individual characteristics, including self-control, general connectedness to other students and specific connectedness to highly talented students affect performance. In all models, we tested for the presence of omitted variables with a specification-error test as well as for multicollinearity and rejected both. Moreover, ordinary least square (OLS) estimates were calculated with robust standard errors. We additionally
14
In principle, we can also construct two separate indicator variables for time-consistent behavior concerning each of the two intermediate goals. While many of our results are qualitatively unaffected, there is simply less variation in these two measures.
15
12
used a two-step FGLS (feasible generalized least square) method to account for heteroskedasticity and thus to gain efficiency.
Self-control and talent Both individual self-control and talent have a positive effect on performance. Pairwise correlation of the dependent variable and these regressor variables yields a correlation coefficient of 0.66 (with a p-value smaller than 0.001) for talent and performance, while the correlation coefficient of self-control and performance is 0.30 (with a p-value of 0.003). The effect of talent is significant at the 1% level across all model specifications. Self-control is statistically significant, albeit to a lesser degree. Being highly self-controlled is associated roughly with an eight points higher micro score, which is substantial since the maximal score is 90 and the median score is 58. The standard deviation of math score is 21 (reported in Table 1); an increase of one standard deviation in math score
leads to a rise of 12 points in the micro score.
These results fully support our hypothesis H1 that self-control positively affects
performance. One important alternative suggestion would be that self control captures an
advantage in human capital of those students who attended the workshop and received feedback after an early submission of their midterm assignment. To test whether this is true, we conducted a Wilcoxon rank-sum test comparing the performance of those who attended the workshop and received the feedback with those who did not. The result is displayed in Table 3. There is no evidence that workshop attendance and feedback affected performance.
Hence, we can be confident that the positive coefficient of the variable self control in Table 2
does indeed measure a positive effect of actual self-control on performance.
Self-control and peer effects The number of friends in general, measured by
degree, has no significant effect on performance when controlling for talent and self-control
(see columns 2 and 3 in Table 2). However, increasing the number of talented friends, i.e.,
friends with a high math score, significantly improves performance, which is fully in line with our hypothesis H3. If we control for the number of talented friends, the effect of self-control becomes weaker. Within the OLS regression the effect of self-control is of the same dimension but insignificant. In the FGLS model, the effect of self-control remains significant when controlling for the number of talented friends. Since overall model diagnostic statistics favor the FGLS model, we conclude that both self-control and being connected to many talented peers significantly improve performance. Overall, we find strong evidence in support of our hypotheses H1 and H3.
13
effort, i.e., by the average number of minutes studied per week, as reported in the first wave of our experiment. On the other hand, late effort, i.e., the average number of minutes studied
in the last week prior to the exam, seems to positively affect performance to some extent.16
However, this result is not robust to controlling for other covariates, like talent.17 Hence, we
conclude that we do not find strong evidence for a positive relationship between effort and performance. This might be due to the fact that effort and talent can be substitutes as well as complements, which might vary across students. Alternatively, learning methods, e.g., how the material is structured and whether students acquire problem-solving skills rather than memorize prespecified results, might matter more than the pure amount of time spent studying.
Our hypothesis H2 predicts that effort is increasing in control such that more self-controlled students would study more than their peers. On average, early effort of students with low self-control amounts to 57 minutes per week, while students with high self-control
study 78 minutes per week. However, this difference is not significant.18 By contrast, highly
self-controlled students invest significantly more effort in the week prior to the exam. Figure 2 displays kernel density estimates for late effort per level of self-control, i.e. students’ effort one week prior to the microeconomics exam, separated according to the level of self-control. Indeed, highly self-controlled students seem to work harder in the week prior to the exam than their less controlled counterparts. Specifically, median effort for highly (lowly) controlled students is 240 (80) minutes per week; and average effort for highly (lowly) self-controlled students is 290 (210) minutes per week. A Wilcoxon test rejects the hypothesis that both groups are not statistically different with regard to late effort with a p-value of 0.078. In sum, we find only weak support for our hypothesis H2.
Self-control and monetary time-preferences Considering the students’ monetary time preferences, we do not find any effect on performance or on any other behavioral variable such as effort or goal-setting behavior. Importantly, we also do not find any correlation between these time-preferences and our behavioral self-control measure. Similarly to the data reported by Takeuchi (2011) whose method we adopted, most participants appear to be future-biased in the monetary context, while only few seem to have a present bias or to be time-consistent. At least in our setting, time preferences do not seem to be correlated across the monetary context and the context of studying.
16
Results on the relationship between effort and performance are not reported in the tables. 17
Controlling for other covariates creates heteroskedasticity. We control for heteroskedasticity by applying the bootstrapped method using 400 resamples.
18
14
4.2 The Interaction of Self-Control and Peer Effects
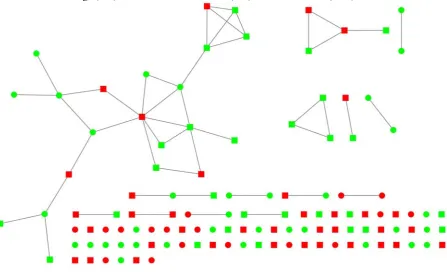
[image:15.595.76.524.329.601.2]Self-control and students’ social network Figure 1 displays the social network of our students and provides a first impression of the relationship between self-control and connectedness. Importantly, most students who have at least one friend also have a high level of self-control, whereas the majority of those who are unconnected to any friends also exhibit low control. To be more precise, only 39% of the many isolates have a high level of control. In contrast, 71% of the students who have at least one friend also exhibit high self-control. This observation already suggests that network formation among students could well be fully in line with the BBT model, i.e., that only sufficiently self-controlled individuals profit from teaming up with similarly self-controlled peers.
Figure 1: Students’ learning network and their self-control. Light-green (dark-red) stands for a high (low) level of self-control. Circle (box) indicates a female (male) student.
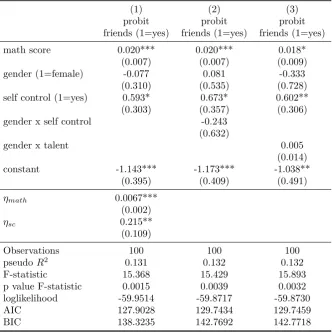
To test this hypothesis we first consider the variable friends, i.e., the binary variable
measuring whether a student is connected to any friends at all (friends = 1). Indeed, students
with high self-control are much more likely to have connections to peers (Pearson Chi2 =
12.159 with p-value < 0.001 and Fisher’s exact test yields p-value = 0.001).19 To control for
other individual characteristics, we run a probit regression with friends as a dependent
variable, using self-control and further individual characteristics as covariates. A
19
15
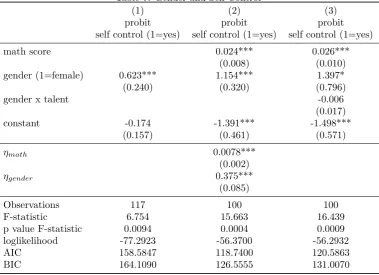
Lemeshow specification test shows that all the models are well specified. Table 4 displays the results. Self-control and talent both have a statistically significant positive impact on the likelihood of being connected in different model specifications. Indeed, the predicted probability of being connected is 21% higher for individuals with high self-control than for those with low self-control, holding all other covariates constant.
We also tested whether self-control tends to increase the number of friends a student is
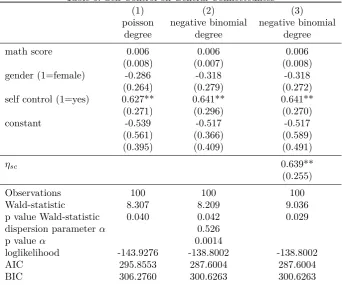
connected to. Since the dependent variable degree, the number of friends, is a nonnegative
integer, we use Poisson and negative binomial models. Results are shown in Table 5. Since overdispersion is present, negative binomial models provide the best fit. Our results support our findings from the previous binary outcome model. Highly self-controlled students have a higher number of friends; and this effect is significant at the 5% level in both models. Specifically, a discrete change from having low self-control to having high self-control is associated with 0.64 additional friends. To check for robustness, we use the directed network and estimate the effect of self-control on outdegree and indegree, i.e. the number of friends a student nominated in the survey, respectively how often the student was nominated. Both
measures from the directed network show a significant effect of similar size.20 Overall, our
estimates consistently show that highly self-controlled students are more likely to have friends and also tend to have more friends than students with low self-control. This is clear evidence for parts (a) and (b) of our hypothesis H4.
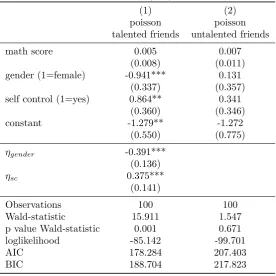
To test whether highly self-controlled students are also more likely to have highly
talented friends, we ran two Poisson regressions with talented friends and untalented friends
as response variables. Since the equidispersion property is not violated, models fitting the Poisson distribution are used. Results are reported in column 1 of Table 6. On average, the number of highly talented friends is increasing in self-control. This effect is positive and statistically significant, which supports part (c) of our hypothesis H4. The size of the effect is also substantial: Being highly self-controlled is associated with 0.35 additional talented friends.
We also tested whether self-control affects the number of lowly talented friends, i.e., the number of friends with a low math score. As can be seen from the second column of Table 6, we do not find any effect of self-control on the number of lowly talented friends. Hence, while a highly self-controlled student is more likely than a student with low self-control to have friends at all, the former also seems to be more selective in choosing his or her friends than the latter. Since students with more talented friends perform better in the exam, these
20
16
results imply that control facilitates positive peer effects on performance: More self-controlled students have better access to highly talented peers and thereby accomplish more than their less well-connected peers. This is another channel through which self-control affects performance. Overall, we conclude that there is supportive evidence for all parts of our hypothesis H4 showing a strong link between a student’s connectedness and her self-control. By contrast, we do not find any evidence in favor of our hypothesis H5, i.e., that self-control is correlated among direct friends. This, however, seems due to the fact that testing this hypothesis requires a dramatic reduction in sample size since a significant part of our students does not have any friends at all. Hence, we conclude that our results are sufficiently in line with the BBT model to provide support for it.
Note that a very specific prediction of the BBT model is the claim that only
sufficiently self-controlled individuals profit from connecting to others at all. This prediction
could not be generated by a theory of homophile network formation, other than the prediction that self-control be correlated among friends. Hence, since we validate the former claim, we provide evidence in support of the BBT model.
4.3 Gender Differences in Self-Control and Peer Effects
Since we conducted our field study in an educational setting where gender differences typically play an important role, we also investigate whether and how female students differ from male students in self-control, peer effects and performance.
Table 7 and Figure 3 display the results regarding self-control. Female students are significantly more self-controlled than their male counterparts: females’ likelihood of being highly self-controlled is 37,5 % higher than males’, holding the other covariates constant. Moreover, comparing the probabilities of being highly self-controlled between female and male students for different levels of talent, as we do in Figure 3, reveals, first, that the predicted values of being highly self-controlled are higher for female students for all levels of talent. Second, men’s fitted probability of being highly self-controlled increases much more strongly in talent than women’s, i.e. the men’s slope is steeper. One possible explanation could be that women partly use self-control as a substitute for talent while men’s self-control and talent are complements.
17
indicate that women outperform men. If anything, men perform better than women. Hence, we conclude that the advantage of female students in terms of self-control must be counterbalanced by some disadvantage either in other determinants of performance or in the way in which self-control is used to increase performance. A second Wilcoxon rank-sum test which is displayed in Table 3 reveals that women seem to scribe somewhat lower math scores than men, but this is not significant. Hence, we cannot conclude that women have a disadvantage in talent. Regarding their social network, neither are female students significantly less likely to have friends, nor do numbers of friends differ significantly between the sexes, as can be seen from Tables 4 and 5. This is already an interesting observation, since one could expect the (more self-controlled) female students to be more likely than the male students to be connected to friends at all, given that self-control turned out to be an important determinant of connectedness. However, if we look deeper into the way in which female and male students form their social network, an interesting gender difference emerges that possibly counteracts the women’s advantage in self-control: We find a compositional difference in how female and male students have formed their network. Female students seem less selective than male students in choosing their friends since there is a strong negative impact of being female on the number of talented friends which is significant at the 1% level (cf. Table 6). In particular, female students have 0.4 fewer highly talented friends compared to male students.
Hence, female students, although more self-controlled on average than male students, seem to use their self-control less efficiently to get access to highly talented peers and hence
profit less from positive peer effects on performance.21 This might be at least one possible
reason why women, albeit more self-controlled than men, do not outperform the latter in the exam.22
5 Self-Control and “Good News” about Peers
5.1 Experimental Intervention
In the BBT model, a specific mechanism makes sufficiently self-controlled individuals want to team up with peers who have similar levels of self-control. This mechanism is part of the
21
This finding seems to be very much in line with the empirical results of Lalanne and Seabright (2013) and the experimental findings of Friebel et al. (2013). Lalanne and Seabright (2013) find that the presence of influential individuals in a cohort of employees improves men’s wages much more strongly than women’s. Friebel et al. find that men’s network formation is more reactive to short-term benefits (i.e., payoffs) than women’s.
22
18
so-called “good news” equilibrium: Individuals correctly expect to learn more often than not that their peers have resisted temptations. This increases their confidence in their own self-control and finally enhances their future resistance against temptations. To address the question whether a similar cognitive mechanism makes our students appreciate highly self-controlled peers, we implemented an experimental intervention in the second wave of our study, where we communicate “good news” about their peers’ self-control.
In each tutorial group, we informed the students about the current study time (elicited in wave 1) of the most hard-working peers within their tutorial. Since students with low ambitions might not respond to information about the effort of extremely ambitious students, we communicated two signals in each tutorial: the current study time of the most working non-ambitious peer (low stimulus) and the current study time of the most hard-working ambitious peer (high stimulus), where students are categorized as ambitious if they
aspired to a grade better or equal to 2.3.23 Thus, the variable stimulus assigns to each student
the maximal early effort of the peer in the tutorial with the same ambition, which in each tutorial is lower for non-ambitious students than for ambitious students.
After receiving the stimulus, all students in the tutorial group were required to define how many minutes per week (on average) they planned to study from then on until the
exam.24 We used this survey to test whether students’ goal setting behavior (their planned
effort) and their actual late effort depended on the stimulus. Those students whose early effort was used as stimulus are excluded from the analysis.
To see how this relates to theory, note that the stimulus provided to our students was “good news” about an anonymous peer in their group who studied harder than they did while exhibiting a similar ambition. Hence, the stimulus suggested that this peer was better than the others in the group in resisting the usual temptations that divert students from work. According to the BBT model, this good news should enhance a student’s confidence in her own self-control and thereby her willingness to persevere. Hence, we conjectured that late effort increases in the stimulus, i.e., that students studied harder in the week prior to the exam if the student of their tutorial group whose early effort was used as stimulus had studied hard in the early weeks of the course. Moreover, note that according to Koch and Nafziger (2011), setting oneself a goal works as partial commitment since it creates psychological costs of falling short of the goal. Hence, the more confident a student is that she has self-control, the higher the goals are that she can optimally set for herself. Therefore, we also conjectured that
23
The grade 2.7 in the German grading system would correspond to A- in the US grading system. 24
19
planned effort increases in the effort that we revealed as stimulus. Taken together, our conjectures are equivalent to our hypothesis H5.
5.2 Empirical Strategy
A peer effect is prevalent if a students’ current effort affects the goal setting behavior of the other students in her tutorial group. The clean and causal identification of peer effects on individual behavior is subject to numerous challenges. In his seminal contribution, Manski (1993) mentions two effects that cannot easily be separated from the true (endogenous) peer effect: contextual (exogenous) effects and correlated effects. In our setting, contextual effects would occur if a student’s planned effort varied with the exogenous characteristics of her tutorial group, e.g., with characteristics of the tutor or the time when the tutorial was scheduled. By contrast, a correlated effect would be present if students’ effort plans were more strongly correlated within a tutorial group than within the whole sample, because students with similar characteristics, such as talent or ambition, selected themselves into the same tutorial group. Both the contextual and the correlated effects differ from the true peer effects with respect to causality: Individual behavior is directly influenced by a peer’s behavior if the relationship between the two is a peer effect, but not if it is a contextual or correlated effect.
Note that by our experimental design, the relationship between the stimulus and planned effort is directed: While students reacted to the stimulus when reporting their planned effort, the students whose early effort was used as stimulus had no information about the future effort plans of other students in her group when reporting her current effort. Hence, if the relation between the stimulus and individual planned effort can be interpreted as causal, the plausible interpretation is that the stimulus had a causal impact on planned effort, rather than vice versa.
20
The model, estimated via OLS, includes a tutorial-specific fixed effect and allows for correlations between the responses of students in the same tutorial.
Moreover, we test whether students self-selected into tutorial groups based on effort or talent. Simple bivariate distribution plots do not reveal any initial self-selection, neither with
regard to effort, not with regard to talent.25 Students with higher current study time or with a
higher level of talent do not seem to have selected themselves into a particular tutorial group. We confirm these preliminary indications with a Kruskal-Wallis equality-of population rank test and simultaneously test the equality of the early effort (respectively math) distribution across all tutorials. The null hypothesis that effort (math) is equal across all tutorials cannot be rejected. Overall, we are confident that we are able to separate peer effects from contextual and correlated effects.
5.3 Results
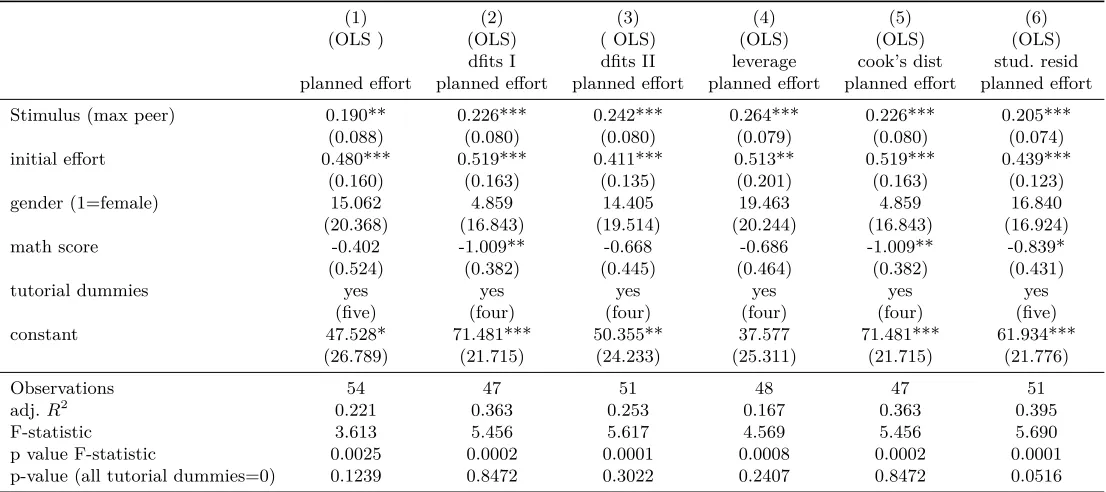
Table 8 reports the results from OLS regressions with included tutorial dummies. Our estimates are robust to five different outlier measures: dfits based on Welsch and Kuh (1977), a less restrictive dfits to exclude less extreme outliers, leverage, Cook’s D influence statistic and studentized (jackknifed) residuals. The minimum number of outliers removed is three, the maximum is seven. The effect of the stimulus is highly significant and positively affects student’s planned effort regardless of the calculated outlier statistic. These results indicate that students indeed adapt their goals upward in reaction to “good news” about the self-control of their peers. However, although tutorial dummies are jointly significant only when the jackknifed residual statistic is used (column 6), tutorial dependencies exist because standard errors are smaller in regressions when tutorial dummies are excluded. Hence, we find both peer effects and correlated effects on planned effort.
6 Discussion
We have conducted a field study to shed light on the interaction between self-control and peer effects. Our main contribution is to show that there exists a significant and sizable relation between connectedness to peers and self-controlled behavior. More self-controlled students are more likely to be connected and tend to have both more friends in total and more highly talented friends than their less self-controlled counterparts. Moreover, the connection to highly talented peers is an additional channel through which self-control positively affects performance. We also find gender differences: Female students are more self-controlled than
25
21
their male counterparts, but do not outperform the latter although they seem to be equally talented. One possible reason is that female students seem to be less selective in their connections to peers. Although they have roughly the same number of friends as male students, they have fewer highly talented friends.
Our main finding of a positive relation between connectedness to peers and self-controlled behavior is in line with the theory provided by Battaglini, Bénabou and Tirole (2005). This theory predicts that only individuals with a sufficiently high prior probability of being self-controlled profit from teaming up with each other. This is because teaming up is helpful only if “good news” about the level of self-control of the other team members is sufficiently likely. Hence, if social network formation is endogenous and individuals link strategically (cf. Jackson and Wolinski, 1996), then the individuals with higher levels of prior self-control will choose to team up with each other whereas those with low levels of prior self-control will stay alone. Our findings are fully consistent with this prediction.
22
7 References
Ainslie, G., and N. Haslam (1992): Hyperbolic Discounting. In: Choice over Time, ed. by G. Loewenstein and J. Elster, 57-92. Russell Sage Foundation, New York.
Ali, S. (2011): Learning Self-Control. Quarterly Journal of Economics 126(2), 857-893.
Ameriks, J., Caplin, A., Leahy, J., and T. Tyler (2007): Measuring Self-Control Problems.
American Economic Review 97(3), 966-972.
Andersen, S., Harrison, G., Lau, M. and E. Rutström (2008): Eliciting Risk and Time
Preferences. Econometrica 76(3), 583-618.
Andreoni , J., and C. Sprenger (2012): Risk Preferences are not Time Preferences. American
Economic Review 102 (7), 3333-3356.
Ariely, D., and K. Wertenbroch (2002): Procastination, deadlines, and performance:
self-control by pre-commitment. Psychological Science 13(3), 219-224.
Ashraf, N., Karlan, D., and W. Yin (2006): Tying Odysseus to the Mast: Evidence from a
Commitment Savings Product in the Philippines. Quarterly Journal of Economics 121(2),
673-697.
Battaglini, M., Bénabou, R., and J. Tirole (2005): Self-control in peer groups. Journal of
Economic Theory 123, 105-134.
Bénabou, R., and M. Pycia (2002): Dynamic Inconsistency and Self-Control: a Planner-Doer
Interpretation. Economics Letters 77 (3), 419-424.
Benhabib, J., Bisin, A., and A. Schotter (2010): Present Bias, Quasi Hyperbolic Discounting,
and Fixed Costs. Games and Economic Behaviour 69(2), 205-223.
Bryan, G., Karlan, D., and S. Nelson (2010): Commitment Devices. Annual Review of
23
Bucciol, A., Houser, D., and M. Piovesan (2011): Temptation at work. Harvard Business School Working Papers 11-090, Harvard Business School.
Burger, N., Charness, G., and J. Lynham (2011): Field and Online Experiments on
Self-Control. Journal of Economic Behavior and Organization 77(3), 393-404.
Calvo-Armengol, A., Patacchini, E., and Y. Zenou (2009): Peer Effects and Social Networks
in Education. Review of Economic Studies 76, 1239-1267.
Cameron, A., and P. Trivedi (2005): Microeconometrics: Methods and Applications, Cambridge University Press, New York.
DellaVigna, S., and U. Malmendier (2006): Paying Not to Go to the Gym. American
Economic Review 96(3), 694-719.
Falk, A., and A. Ichino (2006): Clean Evidence on Peer Effects. Journal of Labor Economics,
24(1), 39-58.
Friebel, G., Lalanne, M., Richter, B., Schwardmann, P., and P. Seabright (2013): Selectivity and opportunism: two dimensions in trust games and network formation. Mimeo, Goethe University Frankfurt.
Fudenberg, D., and D. Levine (2006): A Dual-Self Model of Impulse Control. American
Economic Review 96(5), 1449-1476.
Gneezy, U., Niederle, M., and A. Rustichini (2003): Performance in competitive
environments: Gender differences. Quarterly Journal of Economics 118(3), 1049-1074.
Gul, F., and W. Pesendorfer (2001): Temptation and Self-Control. Econometrica 69(6),
24
Houser, D., Schunk, D., Winter, J., and E. Xiao (2010): Temptation and Commitment in the Laboratory. IEW Working Papers 488, Institute for Empirical Research in Economics – University of Zurich.
Hoxby, C. (2000): Peer Effects in the Classroom: Learning from Gender and Race Variation. National Bureau of Economic Research Working Paper 7867.
Hoxby, C., andG. Weingarth(2005):Taking Race Out of the Equation: School Reassignment
and the Structure of Peer Effects. Mimeo, Harvard University.
Jackson, M., and Wolinsky, A. (1996): A strategic model of social and economic networks.
Journal of Economic Theory 71(1), 44-74.
Jurajda, S., and D. Münich (2011): Gender Gap in Performance under Competitive Pressure:
Admissions to Czech Universities. American Economic Review 101(3), 514-518.
Koch, A., and J. Nafziger (2011): Self-Regulation through Goal-Setting. Scandinavian
Journal of Economics 113(1), 212–227.
Laibson, D. (1997): Golden Eggs and Hyperbolic Discounting. Quarterly Journal of
Economics 112(2), 443-478.
Lalanne, L., and P. Seabright (2013): The Old Boy Network: Gender Differences in the Impact of Social Networks of Remuneration on Top Executive Jobs. Centre for Economic Policy Research Discussion Paper 8367.
Manski, C. (1993): Identification of Endogenous Social Effects: The Reflection Problem.
Review of Economic Studies 60(3), 531 -542.
Mas, A., and E. Moretti (2009): Peers at Work. American Economic Review 99(1), 112-145.
Niederle, M., and L. Vesterlund (2007): Do women shy away from competition? Do men
25
Noor, J. (2011): Temptation and Revealed Preference. Econometrica 79(2), 601-633.
O’Donoghue, T., and M. Rabin (1999): Doing it now or later. American Economic Review
93(2), 186-191.
Sacerdote, B. (2001): Peer Effects with Random Assignment: Results for Dartmouth
Room-mates. Quarterly Journal of Economics 116 (2), 681-704.
Strotz, R. (1955): Myopia and Inconsistency in Dynamic Utility Maximization. Review of
Economic Studies 23(2), 165-180.
Suvorov, A., and J. Van de Ven (2008): Goal-Setting as a Self-Regulation Mechanism. CEFIR/NES Working Paper 122.
Takeuchi, K. (2011): Non-parametric test of time consistency: Present bias and future bias.
Games and Economic Behavior 71(2), 456-478.
Thaler, R., and H. Shefrin (1981): An economic theory of self-control. Journal of Political
Economy 89(2), 392-406.
Wagner, G., Frick, J., and J. Schupp (2007): The German Socio-Economic Panel (SOEP): -
Scope, Evolution and Enhancements. Schmollers Jahrbuch : Journal of Applied Social
Science Studies / Zeitschrift für Wirtschafts- und Sozialwissenschaften 127(1), 139-169.
Welsch, R., and E. Kuh (1977): Linear Regression Diagnostics. Technical Report 923-977, Massachusetts Institute of, Technology, Cambridge, MA.
Wong, W. (2008): How much time-inconsistency is there and does it matter? Evidence on
self-awareness, size, and effects. Journal of Economic Behavior 68(3), 645-656.
Zimmerman, D. (2003): Peer Effects in Academic Outcomes: Evidence from a Natural
Appendix A
Table 1: Summary Statistics
Variable # of obs. # of obs. if var =1 Mean Std. dev. p50 Min Max
micro score (performance) 96 - 56.59 20.70 58 0 88
math score (talent) 100 - 48.19 20.80 51 0 82
effort (minutes per week) 70 - 70.28 67.20 60 0 360
self control (1=yes) 117 63 0.54 0.50 1 0 1
gender (1=female) 117 52 0.44 0.50 0 0 1
friends (1= at least one friend) 117 55 0.47 0.50 0 0 1
degree 117 23 0.94 1.33 0 0 7
Notes: Calculation based on data collected in spring and summer 2013. Sample includes first year economics students. Variables
micro score,math scoreandeffortare metric. The construction ofself controlis described in detail in section 3.2. The variable
gender is binary and 44% of the students are female. The variablefriends is binary as well. 55 students reported to have studied with at least one friend for the micro course. The count variabledegreegives the number of friends a student has.
Table 2: Self control, Talented Peers and Performance
(1) (2) (3) (4) (5)
OLS OLS FGLS OLS FGLS
micro score micro score micro score micro score micro score
self control (1=yes) 8.896* 8.553* 7.974** 7.125 6.831* (4.737) (4.932) (3.734) (4.854) (3.760) math score 0.580*** 0.579*** 0.578*** 0.580*** 0.580***
(0.110) (0.111) (0.086) (0.105) (0.084) gender (1=female) -4.251 -4.008 -4.089 -2.111 -2.230
(4.413) (4.484) (3.300) (4.426) (3.376)
degree 0.574 1.097
(1.194) (1.126)
talented friends 4.340** 4.067**
(1.938) (1.962) constant 23.805*** 23.300*** 23.142*** 21.807*** 22.188***
(6.385) (6.471) (5.489) (6.225) (5.337)
Observations 88 88 88 88 88
adj.R2 0.422 0.417 0.436 0.441 0.460
F-statistic 22.743 17.276 17.836 18.837 19.540
p value F-statistic 0.0000 0.0000 0.0000 0.0000 0.0000
Notes: Dependant variable is the score obtained in microeconomics I exam. Robust standard errors are reported in parentheses. *, **, *** indicate significance at the 10%, 5% and 1% level. Feasible generalized least square (FGLS) is calculated with a skedasticity function that includes math score and self control.
[image:27.595.104.509.433.672.2]Table 3: Wilcoxon Rank-Sum (Mann-Whitney) Tests
performance by gender observations rank sum expected
male 55 2915.5 2667.5
female 41 1740.5 1988.5
combined 96 4656 4656
z value 1.838
p value of z 0.0661
talent by gender
male 61 3310.5 3080.5
female 39 1739.5 1969.5
combined 100 5050 5050
z value 1.626
p value of z 0.1040
performance by early submission+ workshop attendance
yes (both criteria fulfilled) 31 1980 1829
no (only one or none criterion fulfilled) 86 4923 5074
combined 117 6903 6903
z value -0.933
p value of z 0.3509
Notes: Performance is measured with the score obtained in Microeconomics I exam. Talent is measured with score obtained in Math exam. Results on performance and talent indicate, if anything, higher levels for men. There is no difference in performance with regard to workshop attendance+early submission of midterm assignment.
0
.0005
.001
.0015
.002
Kernel density
0 100 200 300 400 500 600 700 800 900 Effort in Minutes per week
Not being self-controlled Being self-controlled
Effort prior to micro exam and self control
Figure 2: Effort (week before exam) and Self control
Notes: The figure gives kernel density estimates for effort (minutes studied per week one week before the exam took place) for the self-controlled and not self-controlled cohorts. One outlier is excluded. The bandwidth is 90. Dashed vertical lines give the average effort, dotted lines give the median effort. A Wilcoxon testrejectsthe hypothesis that both groups arenot statistically differentwith regard to effort with a p-value of 0.078.
[image:29.595.88.524.72.385.2]Table 4: Self-Control on General Connectedness
(1) (2) (3)
probit probit probit
friends (1=yes) friends (1=yes) friends (1=yes)
math score 0.020*** 0.020*** 0.018*
(0.007) (0.007) (0.009)
gender (1=female) -0.077 0.081 -0.333
(0.310) (0.535) (0.728)
self control (1=yes) 0.593* 0.673* 0.602**
(0.303) (0.357) (0.306)
gender x self control -0.243
(0.632)
gender x talent 0.005
(0.014)
constant -1.143*** -1.173*** -1.038**
(0.395) (0.409) (0.491)
ηmath 0.0067***
(0.002)
ηsc 0.215**
(0.109)
Observations 100 100 100
pseudoR2 0.131 0.132 0.132
F-statistic 15.368 15.429 15.893
p value F-statistic 0.0015 0.0039 0.0032
loglikelihood -59.9514 -59.8717 -59.8730
AIC 127.9028 129.7434 129.7459
BIC 138.3235 142.7692 142.7718
Notes: Dependant variable friends is binary and equal to 1 if the student named at least one learning partner; zero otherwise. Robust standard errors in parentheses. ηmath/ηsc: average
marginal effect of friends w.r.t. math score/ self control. *, **, *** indicate significance at the 10%, 5% and 1% level.
Table 5: Self-Control on General Connectedness
(1) (2) (3)
poisson negative binomial negative binomial
degree degree degree
math score 0.006 0.006 0.006
(0.008) (0.007) (0.008)
gender (1=female) -0.286 -0.318 -0.318
(0.264) (0.279) (0.272)
self control (1=yes) 0.627** 0.641** 0.641**
(0.271) (0.296) (0.270)
constant -0.539 -0.517 -0.517
(0.561) (0.366) (0.589)
(0.395) (0.409) (0.491)
ηsc 0.639**
(0.255)
Observations 100 100 100
Wald-statistic 8.307 8.209 9.036
p value Wald-statistic 0.040 0.042 0.029
dispersion parameterα 0.526
p valueα 0.0014
loglikelihood -143.9276 -138.8002 -138.8002
AIC 295.8553 287.6004 287.6004
BIC 306.2760 300.6263 300.6263
Notes: Dependant count variable degree is defined as number of friends.Robust standard errors are in parentheses for the first and third model. The second model was calculated without robust standard errors to retrieve the dispersion parameterα. Overdispersion is present. ηsc: average marginal effect
of degree with respect to self control. *, **, *** indicate significance at the 10%, 5% and 1% level.
Table 6: Self-Control and (Un-)talented friends
(1) (2)
poisson poisson
talented friends untalented friends
math score 0.005 0.007
(0.008) (0.011)
gender (1=female) -0.941*** 0.131
(0.337) (0.357)
self control (1=yes) 0.864** 0.341
(0.360) (0.346)
constant -1.279** -1.272
(0.550) (0.775)
ηgender -0.391***
(0.136)
ηsc 0.375***
(0.141)
Observations 100 100
Wald-statistic 15.911 1.547
p value Wald-statistic 0.001 0.671
loglikelihood -85.142 -99.701
AIC 178.284 207.403
BIC 188.704 217.823
Notes: Dependant variable is the number of (un-)talented friends and is a count variable. Talented friends are friends that have a math score weakly above the median of the cohort, untalented friends have a math score below the median of the cohort. Robust standard errors in parentheses. Overdis-persion is not present and both models are fitted using Poisson distribution. ηgender / ηsc: average marginal effect of dependent variables w.r.t. gender
and self control. *, **, *** indicate significance at the 10%, 5% and 1% level.
Table 7: Gender and Self-Control
(1) (2) (3)
probit probit probit
self control (1=yes) self control (1=yes) self control (1=yes)
math score 0.024*** 0.026***
(0.008) (0.010)
gender (1=female) 0.623*** 1.154*** 1.397*
(0.240) (0.320) (0.796)
gender x talent -0.006
(0.017)
constant -0.174 -1.391*** -1.498***
(0.157) (0.461) (0.571)
ηmath 0.0078***
(0.002)
ηgender 0.375***
(0.085)
Observations 117 100 100
F-statistic 6.754 15.663 16.439
p value F-statistic 0.0094 0.0004 0.0009
loglikelihood -77.2923 -56.3700 -56.2932
AIC 158.5847 118.7400 120.5863
BIC 164.1090 126.5555 131.0070
Notes: Dependant variable self control is binary and equal to 1 if the student behaved in a time consistent manner concerning early goal achievement; zero otherwise. Calculation based on data collected in spring and summer 2013. Sample includes first year economics students. Robust standard errors in parentheses. *, **, *** indicate significance at the 10%, 5% and 1% level.ηmath/ηgender:
average marginal effect of self control w.r.t. math score and gender.
0
.2
.4
.6
.8
1
Probability of being self-controlled
10 15 20 25 30 35 40 45 50 55 60 65 70 75 80 85 Math Score
Predicted probability, females 95% confidence interval, females Predicted probability, males 95% confidence interval, males
By Gender
[image:34.595.91.526.71.385.2]Being self-controlled at different talent levels
Figure 3: Self-control by gender
Table 8: Peer effect and Goal Setting
(1) (2) (3) (4) (5) (6)
(OLS ) (OLS) ( OLS) (OLS) (OLS) (OLS) dfits I dfits II leverage cook’s dist stud. resid planned effort planned effort planned effort planned effort planned effort planned effort Stimulus (max peer) 0.190** 0.226*** 0.242*** 0.264*** 0.226*** 0.205***
(0.088) (0.080) (0.080) (0.079) (0.080) (0.074) initial effort 0.480*** 0.519*** 0.411*** 0.513** 0.519*** 0.439***
(0.160) (0.163) (0.135) (0.201) (0.163) (0.123) gender (1=female) 15.062 4.859 14.405 19.463 4.859 16.840 (20.368) (16.843) (19.514) (20.244) (16.843) (16.924) math score -0.402 -1.009** -0.668 -0.686 -1.009** -0.839*
(0.524) (0.382) (0.445) (0.464) (0.382) (0.431)
tutorial dummies yes yes yes yes yes yes
(five) (four) (four) (four) (four) (five) constant 47.528* 71.481*** 50.355** 37.577 71.481*** 61.934***
(26.789) (21.715) (24.233) (25.311) (21.715) (21.776)
Observations 54 47 51 48 47 51
adj.R2 0.221 0.363 0.253 0.167 0.363 0.395
F-statistic 3.613 5.456 5.617 4.569 5.456 5.690 p value F-statistic 0.0025 0.0002 0.0001 0.0008 0.0002 0.0001 p-value (all tutorial dummies=0) 0.1239 0.8472 0.3022 0.2407 0.8472 0.0516
Notes: Dependant variable is planned effort (in minutes per week) the student intends to study after he receives the signal, i.e. the current study time of the most hard-working (non-)ambitious peer. Following outlier statistics are calculated: dfits based on Welsch and Kuh (1977) in column 2, a less restrictive dfits statistics in column 3, data points that are high in leverage in column 4, Cook’s distance that combines leverage and residual in column 5, and studentized (jackknifed) residuals in column 6. Robust standard errors are reported in parentheses. *, **, *** indicate significance at the 10%, 5% and 1% level.
35
Appendix B
Instructions and Additional Material
Wave 1
current study time and aspired grades
Wave 2
Step 1: goals and stimulus
Step 2: workshop registration
Step 3: midterm assignment
Wave 4
Part 1: paper‐and‐pencil‐experiment
Part 2: social network
Part 3: preferences
36
SURVEY ON STUDY SITUATION Part A
Dear student,
the teacher, Prof. Dr. Dr. Lydia Mechtenberg, has given me the permission to conduct a short survey on the overall study situation in the Bachelor’s program in economics. I kindly ask you
to take
3
minutes
time to participate in this part of thesurvey
. I will later completely anonymize your data; until then they will be treated strictly confidential.
A1. Name: ________________________________
A2. Student ID: ________________________________
A3. How often did you attend this tutorial (or another tutorial for this course) so far?
□ almost always □ sometimes □ almost never
A4. How often did you attend the lecture (Microeconomics I) so far?
□ almost always □ sometimes □ almost never
A5. Apart from the lecture and the official tutorials, how much time per week did you on average study for this course (Microeconomics I) so far?
__________ minutes
A6. Do you have any engagements besides your study program that take a substantial part of your time, e.g. occupation, volunteer work, care, parenting?
If yes, please state how many hours per week on average you devote to these engagements:______________