Modeling and Predicting Quality in Spoken Human-Computer Interaction
Alexander Schmitt, Benjamin Schatz and Wolfgang Minker Dialogue Systems Research Group
Institute for Information Technology Ulm University, Germany
{alexander.schmitt, benjamin.schatz, wolfgang.minker}@uni-ulm.de
Abstract
In this work we describe the modeling and prediction of Interaction Quality (IQ) in Spo-ken Dialogue Systems (SDS) using Support Vector Machines. The model can be employed to estimate the quality of the ongoing inter-action at arbitrary points in a spoken human-computer interaction. We show that the use of 52 completely automatic features character-izing the system-user exchange significantly outperforms state-of-the-art approaches. The model is evaluated on publically available data from the CMU Let’s Go Bus Information sys-tem. It reaches a performance of 61.6% un-weighted average recall when discriminating between 5 classes (good to very poor). It can be further shown that incorporating knowl-edge about the user’s emotional state does hardly improve the performance.
1 Introduction
For years, the research community has been trying to model quality of Spoken Dialogue Systems (SDS) with statistical approaches. Most vividly discussed has been the PARADISE approach which tries to map objective performance metrics of an SDS to subjective user ratings (Walker et al., 2000). The paradigm assumes that task success and dialogue costs contribute to user satisfaction which is the tar-get variable in the model. By that, an automatic eval-uation of an SDS should be enabled. While the in-tention of PARADISE is to evaluate and compare SDS or different system versions among each other, it is not suited to evaluate a spoken dialogue at ar-bitrary points during an interaction. Such a model
can be helpful for a number of reasons: Firstly, it allows for a prediction of critical dialogue sit-uations. These predictions could be employed to adapt the dialogue strategy or - in telephone appli-cations with human assistance - escalate to human operators. Secondly, it could help to uncover poten-tially weak dialogue design and point out problem-atic turns that need a re-design. Thirdly, user sat-isfaction models help understand the satsat-isfaction of the users. In this study we present such a statisti-cal model that is trained with a large set of domain-independent features taken from system logs and use additional manually created features, such as emo-tional state and dialogue acts, to create an upper baseline.
This paper is organized as follows: In Section 2 we present related work and discuss afterwards in Section 3 further issues that need to be addressed in this field. There, we also disambiguate the term user satisfaction from Interaction Quality. After that, we describe the annotation scheme as well as the rating process for modeling IQ and present, how we derive a generic label from the different raters’ opinions in Section 4. The input feature groups along with their features are presented in Section 5. We anticipate that the problem is best modeled with Support Vec-tor Machines (SVM), which is addressed in Section 6. Ensuing, the performance of the model is evalu-ated. In the first place, we analyze the impact of dif-ferent feature groups on the SVM classifier in Sec-tion 7 and secondly, we optimize the model and de-termine the most relevant features for predicting the IQ score in Section 8. A linear modeling approach of IQ by use of multivariate linear regression will be
presented and discussed in Section 9 to obtain com-parability with PARADISE. This study closes with a conclusion and a discussion in Section 10.
2 Related Work
Models predicting user satisfaction at any point in an SDS have only been deficiently explored to date. (Engelbrecht et al., 2009) modeled user satisfac-tion as process evolving over time with Hidden Markov Models (HMM). In the experiment, users were asked to interact with a Wizard-of-Oz restau-rant information system. Each participant followed dialogues which have previously been defined fol-lowing predefined scripts, i.e. specific scenarios. This resulted in equally long dialogue transcripts for each scenario. The users were constrained to rate their satisfaction on a 5-point scale with “bad”, “poor”, “fair”, “good” and “excellent” after each di-alogue step. The interaction was halted while the user voted.
In a similar spirit, (Higashinaka et al., 2010a) developed a model for predicting turn-wise rat-ings, which was evaluated on human-machine and human-human dialogues. The data employed was not spoken dialogue but text dialogues from a chat system and a transcribed conversation between hu-mans. The labels in the model originated from two expert raters that listened to the recorded in-teractions and provided turn-wise scores from 1-7 on smoothness (“Smoothness of the conversation”), closeness (“Closeness perceived by the user towards the system”) and willingness (“Willingness to con-tinue the conversation”). Rater-independent perfor-mance scores of the model reached about 0.2-0.24 unweighted average recall, which is about 0.1 points above the baseline of app. 0.14.
(Hara et al., 2010) created n-gram models from dialogue acts (DA) to predict user satisfaction based on dialogues from real users interacting with a music retrieval system. The model is based onoverall rat-ings from the users measuring their satisfaction on a five point scaleafterthe interaction. The best result could be achieved with a 3-gram model that reached 34% accuracy in distinguishing between six classes at any point in the dialogue. It seems that the predic-tion of turn-level user satisfacpredic-tion scores given only one overall dialogue-level score seems hardly
possi-ble and is close to random: The prediction of the five user satisfaction classes reach an average F-score as low as 0.252, which is only 0.052 score points above the baseline of 0.20. A similar result as (Hara et al., 2010) was obtained by (Higashinaka et al., 2010b). Using HMMs they derived turn-level ratings from dialogue-wide ratings. The model’s performance when trained on dialogue-level ratings was closer to random than when trained on turn-level ratings. The open issues that arise from the cited work are ad-dressed in the following.
3 Issues
Our aim is to create a general model that may be used to predict the quality of the interaction - or ideally the actual satisfaction of the user - at arbi-trary system-user exchanges in an SDS. It has be-come obvious from the cited work that current mod-els are not suited for deployment due to low predic-tion accuracy. Crucial for a successful recognipredic-tion of user satisfaction is the choice and appropriateness of the input variables. (Higashinaka et al., 2010a), (Higashinaka et al., 2010b) and (Hara et al., 2010) employ a - mostly hand annotated - “dialogue act” feature to predict the target variable. Dialogue acts are frequently highly system-dependent and do not model the full bandwidth of the interaction. (Engel-brecht et al., 2009) additionally employed contex-tual appropriateness, confirmation strategy and task success, of which many require hand annotation. Yet it is mandatory for an automatic prediction of user satisfaction to design and derive completely auto-matic features that do not require manual interven-tion. It is further easy to comprehend that the mod-eling of user satisfaction in ongoing dialogues starts with a dilemma: tracking user satisfaction from real users in real environments performing real tasks is virtually impracticable. Consequently data for de-riving models can either be obtained under labora-tory conditions with real users performing fake tasks in an artificial environment, cf. (Engelbrecht et al., 2009), or by manual annotation of real-life data from experts that pretend to be the users.
satisfaction - and not expert annotators. Accord-ing to (Doll and Torkzadeh, 1991) “user satisfac-tion” is the opinion of users about a specific com-puter application, which they use. Other terms for “user satisfaction” are common, such as “user infor-mation satisfaction”, which is defined as “the extent to which users believe the information system avail-able to them meets their information requirements” (Ives et al., 1983). User satisfaction and usability are closely interwoven. (ISO, 1998) subsumes under the definition “usability” a compound of efficiency, ef-fectiveness and satisfaction. Yet satisfaction is often seen as a by-product of great usability in HCI lit-erature (Lindgaard and Dudek, 2003). They could also show that user satisfaction ratings are subject to large fluctuations among different users and it can be further assumed that those fluctuations do also occur within a single dialogue of a user. As a result, gen-eral prediction models that mirror a universal, un-biased understanding of satisfaction can presumably hardly be derived from user’s impressions. Large influence of subjectivity - and also randomness in assigning the scores - would prevent such a general model. Consequently, it seems unavoidable to em-ploy expert annotations. In the proper meaning of the word, the scores then do not exactly mirror the subjective impression of users but the more objec-tive impression of expert raters.
Thus we decide against the use of the term user satisfaction in the course of this work in contrast to (Higashinaka et al., 2010a) and instead opt for the expression Interaction Quality. It can be assumed that basic attitudes towards dialogue systems in gen-eral, opinions about the TTS voice, environmental factors etc. that would typically influence user satis-faction scores, and which are not of interest for our prediction, are not dominant in expert satisfaction scores in a series of annotated dialogues. Experts are expected to fade out such system-dependent and environment-dependent influences and instead focus on the dialogue behavior (i.e. the Interaction Qual-ity) only.
As a result, two key issues are addressed in this work: First of all, the input feature set has to be de-signed as a generic, domain-independent set that can be derived from any spoken dialogue system log and that takes into account a maximum of available in-formation about the interaction. Secondly, the
tar-get variable, i.e. the IQ score, needs to be deter-mined in a guided rating process in order to be re-producible in future work and has to be empirically derived from several expert annotators that provide scores for each single system-user turn of an inter-action.
4 Corpus Annotation
For our study we employ data from the Let’s Go Bus information system (Raux et al., 2006). Three raters, advanced students of computer science and engineering, annotated respectively 200 dialogues comprising 4885 system-user exchanges from the 2006 corpus. The raters were asked to annotate the quality of the interaction at each system-user ex-change with the scores 5 (very good), 4 (good), 3 (fair), 2 (poor) and 1 (very poor). Every dialogue is initially rated with a score of 5 since every inter-action at the beginning can be considered as good until the opposite eventuates. Our model assumes that users are initially interacting with an SDS with-out bias, i.e. the basic attitude towards a dialogue system is positive. Other assumptions would not be statistically predictable. An example dialogue is de-picted in Table 5 along with the ratings (cf. Figure 2 in the Appendix). (Higashinaka et al., 2010b) and (Higashinaka et al., 2010a) report low correlation among the ratings (Spearman’sρ0.04-0.32), which motivated us to develop a set of basic guidelines that should be used by the raters (cf. Table 6 in the Ap-pendix). The guidelines have been designed in such a way that the raters still have sufficient level of free-dom when choosing the labels but preventing them from too strong variations among the neighboring system-user exchanges.
The distribution of the labels provided by the sin-gle raters is depicted in Figure 3. As expected, the distribution is skew towards label “5” since every di-alogue initially is assumed to have a good IQ.
The inter-rater agreement shows that Interaction Quality is still a subjective metric, although guide-lines seem to synchronize the labels to a certain ex-tent. The overall mean agreement can be reported with Cohen’s κ = 0.31and the correlation among the raters can be reported with Spearman’sρ= 0.72
aim to model a general opinion on Interaction Qual-ity, i.e. the model should mirror the IQ score other raters - and in the last instance users - agree with, we determine the final label empirically. A major-ity voting for the distinction of the final label can-not be used since in 21% of the exchanges all three raters opted for different scores. Thus we consider the mean of all rater opinions as possible candidates for the final class label:
ratingmean=b 1
R
R X
r=1
IQr !
+ 0.5c
where IQ is the Interaction Quality score pro-vided by rater r. byc denotes the biggest integer value smaller than y. Every value IQr contributes
equally to the result that is finally rounded half up to an integer value. Furthermore we consider the me-dian, which we define as
ratingmedian =select(sort(IQR),
R+ 1
2 )
for an odd number of ratersR, wheresortis a func-tion that orders the ratings of all raters ascending and
select(X = [x1, ..., xn], i)chooses the item with
in-dexifromX.
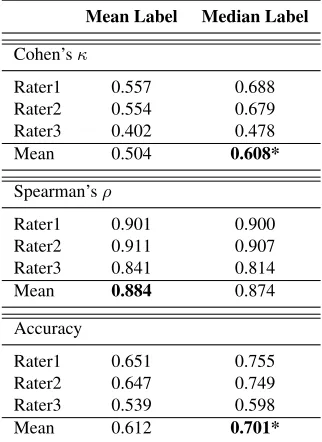
The compliance of the single user ratings with the final label (calculated on mean and median) is de-picted in Table 1. As can be seen, the agreement of the three raters with the median label is significantly higher than with the mean label. Consequently the median label represents the most objective measure-ment of Interaction Quality and commends itself for creating the model.
5 Input Features
The system-user interaction is modeled on exchange level. Each system-user exchange consists of a set of fully automatic features that can be derived from system logs. We used parameters similar to the ones described in (Schmitt et al., 2008; Schmitt et al., 2010b). In the first place, we modeled each system-user exchange with a number of Speech Recognition (ASR), Spoken Language Understanding (SLU) and Dialog Manager (DM)-related features:
Mean Label Median Label
Cohen’sκ
Rater1 0.557 0.688
Rater2 0.554 0.679
Rater3 0.402 0.478
Mean 0.504 0.608*
Spearman’sρ
Rater1 0.901 0.900
Rater2 0.911 0.907
Rater3 0.841 0.814
Mean 0.884 0.874
Accuracy
Rater1 0.651 0.755
Rater2 0.647 0.749
Rater3 0.539 0.598
[image:4.612.346.507.70.291.2]Mean 0.612 0.701*
Table 1: Agreement of single rater opinions to the merged label when determined by mean and median, measured in
κ,ρand accuracy. (*)=significantly higher (α <0.05)
ASR ASRRECOGNITIONSTATUS: one of
’suc-cess’, ’reject’, ’timeout’; ASRCONFIDENCE: confidence of the ASR; BARGED-IN?: did the user barge-in?, MODALITY: one of ’speech’,
’DTMF’; EXMO: the modality expected from the system (’speech’, ’DTMF’, ’both’); UN -EXMO?: did the user employ another modal-ity than expected?; GRAMMARNAMES: names of the active grammars; TRIGGEREDGRAM
-MAR: name of grammar that matched; UTTER
-ANCE: raw ASR transcription; WPUT: num-ber of words per user turn; UTD: utterance turn duration;
SLU SEMANTICPARSE: semantic interpretation of caller utterance; HELPREQUEST?: is the current turn a help request?; OPERATORRE
-QUEST?: is the current turn an operator re-quest?;
current system prompt is a confirmation to elicit common ground between user and system due to low ASR confidence; TURNNUMBER: current turn; DD: dialog duration up to this point in seconds.
To account for the overall history of important system events we added running tallies, percentages and mean values for certain features symbolized with the suffixes ’#’, ’%’ and ’MEAN’. They are: MEANASRCONFIDENCE, the average of
ASR confidence scores from all user utterances so far in the dialog, and #ASRSUCCESS, the number of succesfully parsed user utterances so far. Further we calculate #ASRREJECTIONS, #TIME -OUTPROMPTS, #BARGEINS, #UNEXMO and the respective normalized equivalents with the prefix ’%’ instead of ’#’. We consider the immediate context within the previous 3 turns of the current turn as particularly relevant for the Interaction Qual-ity. Hence, derived from the basic parameters we created further parameters that emphasize specific user behavior prior to the classification point. They are symbolized with the prefix{#}for a number and
{Mean}for the mean value. A number of successive barge-ins or recognition problems might indicate a low IQ. Thus we add{MEAN}ASRCONFIDENCE, the mean confidence of the ASR within the win-dow, {#}ASRSUCCESS, {#}ASRREJECTIONS
and {#}TIME-OUTPROMPTS, i.e. the number of successfully and unsuccessfully parsed ut-terances within the window and the number of time-outs. The other counters are calcu-lated likewise: {#}BARGEINS; {#}UNEXMO,
{#}HELPREQUESTS, {#}OPERATORREQUESTS,
{#}REPROMPT, {#}CONFIRMATIONS,
{#}SYSTEMQUESTIONS.
To provide comparability to previous work (Hi-gashinaka et al., 2010a), we further introduce a dialogue act feature group that we create semi-automatically:
DAct SYSTEMDIALOGUEACT: one of 28 dis-tinct dialogue acts, such asgreeting,offer help, ask bus, confirm departure, deliver result, etc.
USERDIALOGUEACT: one of 22 distinct DAs, such as confirm departure, place information, polite, reject time, request help, etc.
To create an upper baseline of our model we fur-ther introduce the negative emotional state of the user that is manually annotated by a human rater who chooses one of the labelsgarbage, non-angry, slightly angry, very angryfor each single user turn:
Emo EMOTIONALSTATE: emotional state of the caller in the current exchange. One ofgarbage, non-angry, slightly angry, very angry.
The same annotation scheme as in our previous work on anger detection has been applied, see e.g. (Schmitt et al., 2009). From all 4,832 user turns, 68.5% were non-angry, 14.3% slightly angry, 5.0% very angry and 12.2% contained garbage, i.e. non-speech events. In total, the number of interaction parameters servings as input variables for the model amounts to 52.
6 Non-Linear Modeling with Support Vector Machines
The IQ scores are classified with Support Vector Machines (Bennett and Campbell, 2000). In short, an SVM uses a set of training examples
(x1, y1). . .(xn, yn)|xi ∈ X, yi ∈ {−1,1}
to create a hyperplane that separates two classes
{−1,1} in such a manner that the smallest margin between all training samples is maximized. The hy-perplane is described by a normal vector w and a so-called biasb. To classify an unknown sample the following decision rule is applied:
Y =sgn[wTx+b >0] =
+1, wTx+b >0
−1, wTx+b≤0
Depending on the position of the training sample in relation to the hyperplane, the class1 or−1is as-signed to the unknown sample. Multi-class prob-lems are solved by reducing the problem to several binary classification problems where usually a one-versus-alldecision is applied.
The model is constructed with an SVM with lin-ear kernel that uses the fast Sequential Minimal Op-timization (SMO) algorithm (Platt, 1999). Input variables are features from the described groups, i.e.
7 Feature Group Evaluation
The skew distribution of the five classes requires the employment of an evaluation metric that weights the prediction of all classes equally. Hence, a perfor-mance metric, such asaccuracy, would not be a re-liable measurement. We select theunweighted aver-age recall(UAR) to assess the model performance. Although it does not consider the severity of the er-ror, i.e. predicting “1” for an IQ of “5” is considered as fatal as predicting “4”, it has been proven to be su-perior to other evaluation metrics, see (Higashinaka et al., 2010a), where the UAR is calledMatch Rate per Rating(MR/R). It is defined as follows:
M R/R(R,H) = 1
K
K X
r=1 P
i∈{i|Ri=r}
match(Ri, Hi)
P
i∈{i|Ri=r}
1
,
where K is the number of classes, here “5”, and ’match’ is either ’1’ or ’0’ depending on whether the classifier’s hypothesisHifor the classrmatches
the reference label Ri. In the course of this work
we will stick to the expression MR/R by reason of clearness. We further list Cohen’sκand Spearman’s
ρto make our work comparable to other studies but will use MR/R as central evaluation criterion and for feature selection.
We have split all available data into two disjoint subsets consisting of 60% of the dialogues for train-ing and testtrain-ing via 10-fold cross-validation and the remaining 40% of the dialogues for optimization. The dialogues have been selected randomly.
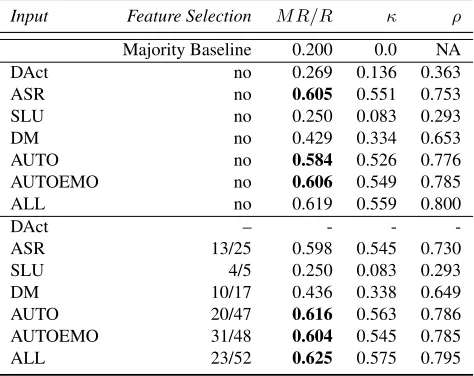
In order to assess the performance contribution of the single feature groups, we trained the SVM re-spectively with all features from theDAct, ASR, SLU
andDM groups. Further, we subsumed the groups ASR, SLU and DM asAUTOfeatures since they can automatically be derived from logs without manual intervention. In addition, theAUTOEMOgroup con-tains allAUTOfeatures plus the emotion label. Fi-nally, the ALL group contains the AUTOEMO fea-tures plus theDActfeatures. For all groups, the sup-port vector classifier has been trained and evaluated in 10-fold cross validation with the 3110 exchanges from the 118 training/testing dialogues. The first turn of each dialogue has been excluded from the
evaluation since each dialogue starts with a score of “5”. Results are depicted in thefirst half of Table 2.
Input Feature Selection M R/R κ ρ
Majority Baseline 0.200 0.0 NA
DAct no 0.269 0.136 0.363
ASR no 0.605 0.551 0.753
SLU no 0.250 0.083 0.293
DM no 0.429 0.334 0.653
AUTO no 0.584 0.526 0.776
AUTOEMO no 0.606 0.549 0.785
ALL no 0.619 0.559 0.800
DAct – - -
-ASR 13/25 0.598 0.545 0.730
SLU 4/5 0.250 0.083 0.293
DM 10/17 0.436 0.338 0.649
AUTO 20/47 0.616 0.563 0.786
AUTOEMO 31/48 0.604 0.545 0.785
[image:6.612.314.551.109.297.2]ALL 23/52 0.625 0.575 0.795
Table 2: Model performance after 10-fold cross valida-tion on training/test set. The first half comprises results when all features of a group are employed. The second half contains results after feature selection on the opti-mization set ((x/y)=wherex is the number of features used from allyavailable features.)
performance values a significant contribution of the emotion feature cannot be observed. We also have to bear in mind that we employed hand-annotated emotions. Emotion recognition itself is error-prone and a distinction of the emotional state of the caller with the employed annotation scheme can be ex-pected with approximately 70%-80% UAR, see e.g. (Schmitt et al., 2010a). The influence of emotion recognition on the IQ distinction can be considered as limited and is insofar not surprising as the occur-rence of strong anger in the data is not dominant (5.0%). The contribution of the single features to the classification result (across the groups they are assigned to) is analyzed in the following.
8 Optimizing the Model by Feature Selection
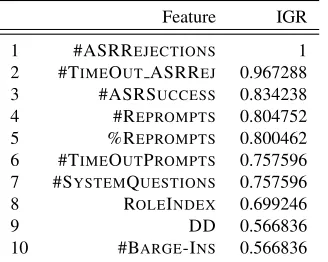
Since too many (potentially irrelevant) features might harm the classifier’s performance we perform feature selection with the optimization set. First, the features are ordered according to an Informa-tion Gain Ratio (IGR) ranking. The 10 most rele-vant features according to IGR for predicting IQ are depicted in Table 3.
Feature IGR
1 #ASRREJECTIONS 1
2 #TIMEOUTASRREJ 0.967288 3 #ASRSUCCESS 0.834238
4 #REPROMPTS 0.804752
5 %REPROMPTS 0.800462
6 #TIMEOUTPROMPTS 0.757596 7 #SYSTEMQUESTIONS 0.757596 8 ROLEINDEX 0.699246
9 DD 0.566836
[image:7.612.319.545.197.313.2]10 #BARGE-INS 0.566836
Table 3: Top 10 features on optimization set according to IGR.
As can be seen the Interaction Quality is obvi-ously heavily influenced by the performance of the ASR. In other words, it can be assumed that the raters themselves are influenced by the ASR’s per-formance when assigning the IQ scores. All features belong to the group AUTO, i.e. they can be deter-mined automatically during runtime. Furthermore, nearly all features are related to the overall interac-tion, i.e. features related to the current exchange,
such as UTTERANCE, ASRSUCCESS? etc. do not even occur. It can also be noted that the emotional state and the dialogue acts are not listed as most rel-evant features. To determine the global maximum of the classifier, i.e. the best performing feature set, we incrementally select thektopmost features from the list and perform 10-fold cross validation on the opti-mization set. A plot of the iterative feature selection is depicted in Figure 1.
8.2 Prediction Results 53
Rapidminer GUI Missing
figure
Figure 8.2: The Graphical User Interface of RapidMiner 4.6
Table 8.1: Baseline perfomances.
Configurations Performance
Corpus Input Target MR/R κ ρ
LetsGo DAct IQ-Med - -
-AUTO IQ-Med - -
-ALL IQ-Med - -
-LetsGoUser DAct IQ - -
-AUTO IQ - -
-ALL-U IQ - -
-DAct US - -
-AUTO US - -
-ALL-U US - -
-5 10 15 20 25 30 35 40 45
0.45 0.5 0.55 0.6
0.65 max
#P arameters
M
R
/R
IGR Parameter Selection
Figure 8.3: Parameter selection performance on the LetsGo Corpus for the optimization
set using set AUTO for prediction of IQ-Med.Figure 1: Performance of the SVM when iteratively
in-creasing the size of the feature vector with thektopmost features according to IGR.
Several observations can be made: the best per-forming feature set consists of 20 features with an absolute performance of 65 % MR/R on the op-timization set. However, a similar performance can already be gained with the 7 top-most fea-tures. All other features obviously neither signif-icantly decrease nor increase the performance and can be considered irrelevant for predicting the IQ score. The impact of feature selection on the model when evaluated on the single feature groups from the test/training set using only the most relevant fea-tures from the optimization set can be seen in the lower part of Table 2. Again, 10-fold cross vali-dation has been applied. TheAUTOgroup benefits from the selection and delivers the highest perfor-mance with 20 features with an MR/R of 61.6%, which is an increase of 3.2%. The upper baseline with hand annotated features (ALL group) amounts to 62.5%. The fact that theAUTOEMOset underper-forms with 60.4% - in comparison to theAUTOset - can be explained due to the potentially too small size of the optimization set.
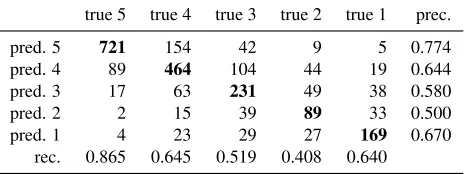
[image:7.612.106.270.416.547.2]performance in predicting the scores at the edge, i.e. “5” and “1”. In between, the confusion is slightly higher and the model performance lower.
Table 4: Confusion matrix including class-wise preci-sion and recall values after 10-fold cross validation (train-ing/test set) using the AUTO set. A (weighted average) accuracy of 67.5% can be derived.
true 5 true 4 true 3 true 2 true 1 prec.
pred. 5 721 154 42 9 5 0.774
pred. 4 89 464 104 44 19 0.644
pred. 3 17 63 231 49 38 0.580
pred. 2 2 15 39 89 33 0.500
pred. 1 4 23 29 27 169 0.670
rec. 0.865 0.645 0.519 0.408 0.640
9 Linear Regression Modeling
Models from the initially mentioned PARADISE ap-proach presume a linear relationship between input variables - quantifying the dialogue - and the target variable U S, the user satisfaction. Assuming lin-earity, such linear models allow inferences such as “The longer the dialogue duration, the lower the sat-isfaction”. While linear modeling is descriptive and easy to read it delivers poor performance when ap-plied on non-linear problems. Such non-linear prob-lems reach a better predictability using Support Vec-tor Machines (SVM). Although we anticipate that a relationship between IQ and the interaction param-eters is not given, we list a multivariate linear re-gression model for comparison reasons with PAR-ADISE.
The linear regression model of Interaction Quality is calculated as follows:
IQ= n X
i=1
wi· N(pi)
where wi is the weight for the interaction
parame-ters pi, and N the z-score normalization function.
N normalizes the input variables to a mean of zero and a standard deviation of one. This eliminates the variying scales of the input variables.
From the CMU Let’s Go dataset we obtained the following IQ function using theALLfeature set:
IQ= 0.7797· N(TURNNUMBER) + 0.7797· N(#SYSTEMTURNS) −0.7386· N(#ASRSuccess) −0.7175· N(#USERTURNS) −0.3019· N(%RePrompts) −0.2371· N(EMOTIONALSTATE) −0.2224· N(#ASRRejections) −0.1961· N(#TIMEOUTS ASRREJ) + 0.1912· N(ASRRECOGNITIONSTATUS) + 0.1648· N(ASRCONFIDENCE) −0.1592· N(#ASRSUCCESS) −0.1466· N(ACTIVITY) + 0.1388· N(ACTIVITYTYPE)
+ 0.1231· N(MEANASRCONFIDENCE) −0.0981· N(#SYSTEMQUESTIONS) + 0.0948· N(%ASRREJECTIONS) −0.0918· N(#TIMEOUTS ASRREJ) + 0.0835· N(#Reprompts)
+ 0.0812· N(%BARGE-INS) −0.0567· N(%TIME-OUTPROMPTS) −0.0555· N(#TIMEOUTS˙ASRREJ) −0.0467· N(#Time-OutPrompts) + 0.0461· N(WPST)
+ 0.0432· N(HANDTRANSCRIPTION) −0.0425· N(LOOPNAME)
+ 0.0375· N(#SystemQuestions) + 0.0374· N(SEMANTICPARSE) −0.0345· N(BARGED-IN?) + 0.0338· N(RoleIndex) −0.0335· N(#REPROMPTS) −0.0316· N(#ASRREJECTIONS) + 0.0302· N(REPROMPT?) + 0.0249· N(WPUT) + 0.0225· N(ROLENAME)
Table 5). However, many inconsistencies remain unexplained, e.g. the negative sign in “−0.7175· N(#USERTURNS)” contradicting the positive sign in “+0.7797· N(#SYSTEMTURNS)”. The nega-tive sign in “−0.7386· N(#ASRSUCCESS)” would further imply that the more successful the ASR, the lower the IQ score. This corroborates our suspicion that IQ is not a linear problem.
To assess the performance of linear regression for predicting IQ we employed 10-fold cross validation, again with all 200 annotated dialogues. We obtained a root mean squared error of 0.594 andR2 = 0.646. Mapping the continuous values to discrete score classes from 1-5, we obtain M R/R = 45.5%
(62.5% using SVM), κ = 0.352 (0.575) and ρ = 0.46 (0.795). All values finally suggest that IQ is better modeled with non-linear classifiers such as SVMs or Multilayer Perceptrons (MLP).
10 Conclusion and Discussion
In this work we have developed a statistical model that predicts Interaction Quality, an objective mea-sure of user satisfaction, at arbitrary points in an SDS. The model targets on predicting critical situ-ations on exchange level in ongoing dialogues. The classifier, an SVM, reaches a performance of 61.6% MR/R (κ = 0.563, ρ = 0.786) by use of an opti-mized feature set that can be automatically derived during the interaction. It could be further shown that linear modeling with multivariate linear regres-sion is not appropriate for predicting IQ and reaches merely 45.5.% MR/R. Among all five feature groups comprising altogether 52 features, the ASR and DM groups contribute the most, while the EMOTIONAL
-STATE underperforms. We could further show that features requiring manual annotation, such as dia-logue acts, do not significantly improve the model’s performance. The model has been evaluated with 200 dialogues from the CMU Let’s Go corpus com-prising 4885 system-user exchanges where three an-notators labeled the Interaction Quality on a score from 1-5. We could show that the median of all three opinions depicts the most generic view on the IQ and is thus chosen as final score for the model.
Some issues have to be addressed in future work: In the current study we assume that Interaction Quality is an objective metric for determining the
satisfaction of users during the interaction. How far this assumption is justified has to be empirically proven in a laboratory study with real users. A cor-responding study is in preparation and the results will be published in a follow-up work. Although the model’s performance can be considered as sat-isfying, the direct deployment in dialogue systems cannot be recommended at this stage. For enabling a dialogue system to react on poor interaction qual-ity, a correct prediction of the low IQ scores 1,2 and 3 is urgent, i.e. the classifier has to be optimized to deliver a very highprecisionon such low scores rather than towards a high generalMR/Rvalue. We assume that the performance can be further driven up by extending the feature space to the lastn ex-changes, which would take into account a larger dialogue history for the decision (cf. (Schmitt et al., 2010b)). The presented model can principally be trained on data from any dialogue system; how-ever, we did not yet deliver the proof that the present model trained on Let’s Go data is general enough for cross-domain and cross-system application with-out significant performance loss. Due to the general character of the ten most relevant features (cf. Table 3), portability can at least be assumed - without the need for domain-dependent and system-dependent re-training.
11 Acknowledgements
We would like to thank Maxine Eskenazi, Alan Black, Lori Levin, Rita Singh, Antoine Raux and Brian Langner from the Let’s Go Lab at Carnegie Mellon University, Pittsburgh, for providing the Let’s Go Sample Corpus. Further we would like to thank the reviewers for their constructive advices.
References
K. P. Bennett and C. Campbell. 2000. Support vector machines: Hype or hallelujah? Journal of SIGKDD Explorations, 2(2):1–13.
W. J. Doll and G. Torkzadeh. 1991. The measure-ment of end-user computing satisfaction: theoretical and methodological issues. MIS Q., 15:5–10, March. K.-P. Engelbrecht, F. G¨odde, F. Hartard, H. Ketabdar, and
S. M¨oller. 2009. Modeling user satisfaction with hid-den markov model. In Proc. of SIGDIAL 2009 Con-ference, pages 170–177. ACL.
S. Hara, N. Kitaoka, and K. Takeda. 2010. Estimation method of user satisfaction using n-gram-based dialog history model for spoken dialog system. InProc. of the Seventh conference on International Language Re-sources and Evaluation (LREC’10), Valletta, Malta. R. Higashinaka, Y. Minami, K. Dohsaka, and T. Meguro.
2010a. Issues in predicting user satisfaction transi-tions in dialogues: Individual differences, evaluation criteria, and prediction models. InSpoken Dialogue Systems for Ambient Environments, Lecture Notes in Computer Science, pages 48–60. Springer Berlin / Heidelberg.
R. Higashinaka, Y. Minami, K. Dohsaka, and T. Meguro. 2010b. Modeling user satisfaction transitions in dia-logues from overall ratings. InProceedings of the SIG-DIAL 2010 Conference, pages 18–27, Tokyo, Japan, September. ACL.
ISO. 1998.Ergonomic requirements for office work with visual display terminals (VDTs), Part 11: Guidance on usability. International Standardization Organization (ISO).
B. Ives, M. H. Olson, and J. J. Baroudi. 1983. The mea-surement of user information satisfaction. Commun. ACM, 26:785–793.
D. Larcker and V. P. Lessig. 1980. Perceived usefulness of information: A psychometric examination. Deci-sion Sciences, pages 121–134, November.
G. Lindgaard and C. Dudek. 2003. What is this evasive beast we call user satisfaction? Interacting with Com-puters, 15(3):429–452.
J. C. Platt, 1999. Fast training of support vector ma-chines using sequential minimal optimization, pages 185–208. MIT Press, Cambridge, MA, USA.
A. Raux, D. Bohus, B. Langner, A. W. Black, and M. Es-kenazi. 2006. Doing research on a deployed spoken dialogue system: One year of lets go! experience. In
Proc. of the International Conference on Speech and Language Processing (ICSLP).
A. Schmitt, C. Hank, and J. Liscombe. 2008. Detecting problematic calls with automated agents. In4th IEEE Tutorial and Research Workshop Perception and Inter-active Technologies for Speech-Based Systems, Irsee (Germany), June.
Alexander Schmitt, Tobias Heinroth, and Jackson Lis-combe. 2009. On nomatchs, noinputs and bargeins: Do non-acoustic features support anger detection? In
Proceedings of the 10th Annual SIGDIAL Meeting on Discourse and Dialogue, SigDial Conference 2009, London (UK), September. Association for Computa-tional Linguistics.
Alexander Schmitt, Tim Polzehl, and Wolfgang Minker. 2010a. Facing reality: Simulating deployment of anger recognition in ivr systems. In Second In-ternational Workshop on Spoken Dialogue Systems (IWSDS), September.
Alexander Schmitt, Michael Scholz, Wolfgang Minker, Jackson Liscombe, and David S¨undermann. 2010b. Is it possible to predict task completion in automated troubleshooters? InProc. of the International Confer-ence on Speech and Language Processing (ICSLP). Marilyn Walker, Candace Kamm, and Diane Litman.
Appendix
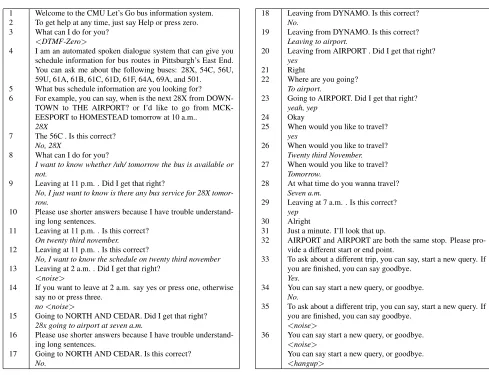
1 Welcome to the CMU Let’s Go bus information system. 2 To get help at any time, just say Help or press zero. 3 What can I do for you?
<DTMF-Zero>
4 I am an automated spoken dialogue system that can give you schedule information for bus routes in Pittsburgh’s East End. You can ask me about the following buses: 28X, 54C, 56U, 59U, 61A, 61B, 61C, 61D, 61F, 64A, 69A, and 501. 5 What bus schedule information are you looking for? 6 For example, you can say, when is the next 28X from
DOWN-TOWN to THE AIRPORT? or I’d like to go from MCK-EESPORT to HOMESTEAD tomorrow at 10 a.m..
28X
7 The 56C . Is this correct? No, 28X
8 What can I do for you?
I want to know whether /uh/ tomorrow the bus is available or not.
9 Leaving at 11 p.m. . Did I get that right?
No, I just want to know is there any bus service for 28X tomor-row.
10 Please use shorter answers because I have trouble understand-ing long sentences.
11 Leaving at 11 p.m. . Is this correct? On twenty third november. 12 Leaving at 11 p.m. . Is this correct?
No, I want to know the schedule on twenty third november 13 Leaving at 2 a.m. . Did I get that right?
<noise>
14 If you want to leave at 2 a.m. say yes or press one, otherwise say no or press three.
no<noise>
15 Going to NORTH AND CEDAR. Did I get that right? 28x going to airport at seven a.m.
16 Please use shorter answers because I have trouble understand-ing long sentences.
17 Going to NORTH AND CEDAR. Is this correct? No.
18 Leaving from DYNAMO. Is this correct? No.
19 Leaving from DYNAMO. Is this correct? Leaving to airport.
20 Leaving from AIRPORT . Did I get that right? yes
21 Right
22 Where are you going? To airport.
23 Going to AIRPORT. Did I get that right? yeah, yep
24 Okay
25 When would you like to travel? yes
26 When would you like to travel? Twenty third November. 27 When would you like to travel?
Tomorrow.
28 At what time do you wanna travel? Seven a.m.
29 Leaving at 7 a.m. . Is this correct? yep
30 Alright
31 Just a minute. I’ll look that up.
32 AIRPORT and AIRPORT are both the same stop. Please pro-vide a different start or end point.
33 To ask about a different trip, you can say, start a new query. If you are finished, you can say goodbye.
Yes.
34 You can say start a new query, or goodbye. No.
35 To ask about a different trip, you can say, start a new query. If you are finished, you can say goodbye.
<noise>
36 You can say start a new query, or goodbye. <noise>
[image:11.612.69.558.82.457.2]You can say start a new query, or goodbye. <hangup>
Table 5: Example dialogue (ID: 2061122025) from the CMU Let’s Go System (2006 corpus) with low Interaction Quality. The user utterances are printed in italic.
5
1 6 11 16 21 26 31 36
u
ality
Exchanges
median rater1
1 2 3 4
Interaction
Q
u
rater2 rater3
1
3 4 5
tion
Quality
median model hypothesis
1 2
Interac
[image:11.612.78.543.497.658.2]1 2 3 4 5 0
500 1,000 1,500
1294 1220
792 595 983
Rating
Frequenc
y
Rater1
1 2 3 4 5
0 500 1,000
1,500 1417
1043
797
555 1072
Rating
Frequenc
y
Rater2
1 2 3 4 5
0 500 1,000 1,500
1656
1416
927
442 443
Rating
Frequenc
y
[image:12.612.101.511.65.172.2]Rater3
Figure 3: Rating distribution for Interaction Quality within the Let’s Go Corpus for each rater.
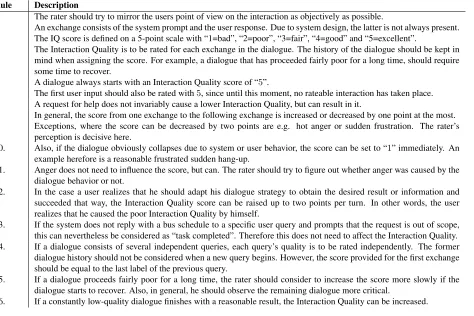
Table 6: Rater guidelines for annotating Interaction Quality.
Rule Description
1. The rater should try to mirror the users point of view on the interaction as objectively as possible.
2. An exchange consists of the system prompt and the user response. Due to system design, the latter is not always present. 3. The IQ score is defined on a 5-point scale with “1=bad”, “2=poor”, “3=fair”, “4=good” and “5=excellent”.
4. The Interaction Quality is to be rated for each exchange in the dialogue. The history of the dialogue should be kept in mind when assigning the score. For example, a dialogue that has proceeded fairly poor for a long time, should require some time to recover.
5. A dialogue always starts with an Interaction Quality score of “5”.
6. The first user input should also be rated with5, since until this moment, no rateable interaction has taken place. 7. A request for help does not invariably cause a lower Interaction Quality, but can result in it.
8. In general, the score from one exchange to the following exchange is increased or decreased by one point at the most. 9. Exceptions, where the score can be decreased by two points are e.g. hot anger or sudden frustration. The rater’s
perception is decisive here.
10. Also, if the dialogue obviously collapses due to system or user behavior, the score can be set to “1” immediately. An example herefore is a reasonable frustrated sudden hang-up.
11. Anger does not need to influence the score, but can. The rater should try to figure out whether anger was caused by the dialogue behavior or not.
12. In the case a user realizes that he should adapt his dialogue strategy to obtain the desired result or information and succeeded that way, the Interaction Quality score can be raised up to two points per turn. In other words, the user realizes that he caused the poor Interaction Quality by himself.
13. If the system does not reply with a bus schedule to a specific user query and prompts that the request is out of scope, this can nevertheless be considered as “task completed”. Therefore this does not need to affect the Interaction Quality. 14. If a dialogue consists of several independent queries, each query’s quality is to be rated independently. The former
dialogue history should not be considered when a new query begins. However, the score provided for the first exchange should be equal to the last label of the previous query.
15. If a dialogue proceeds fairly poor for a long time, the rater should consider to increase the score more slowly if the dialogue starts to recover. Also, in general, he should observe the remaining dialogue more critical.
[image:12.612.84.558.248.564.2]