Who wrote What Where: Analyzing the content of human and automatic
summaries
Karolina Owczarzak and Hoa Trang Dang
Information Access Division
National Institute of Standards and Technology Gaithersburg, MD 20899
[email protected] [email protected]
Abstract
Abstractive summarization has been a long-standing and long-term goal in automatic sum-marization, because systems that can generate abstracts demonstrate a deeper understanding of language and the meaning of documents than systems that merely extract sentences from those documents. Genest (2009) showed that summaries from the top automatic sum-marizers are judged as comparable to manual extractive summaries, and both are judged to be far less responsive than manual abstracts, As the state of the art approaches the limits of extractive summarization, it becomes even more pressing to advance abstractive summa-rization. However, abstractive summarization has been sidetracked by questions of what qualifies as important information, and how do we find it? The Guided Summarization task introduced at the Text Analysis Conference 2010 attempts to neutralize both of these prob-lems by introducing topic categories and lists of aspects that a responsive summary should address. This design results in more similar human models, giving the automatic summa-rizers a more focused target to pursue, and also provides detailed diagnostics of summary con-tent, which can can help build better meaning-oriented summarization systems.
1 Introduction
What qualifies as important information and how do we find it? These questions have been leading re-search in automatic summarization since its begin-nings, and we are still nowhere near a definitive answer. Worse, experiments with humans subjects
suggest a definitive answer might not even exist. With all their near-perfect language understanding and world knowledge, two human summarizers will still produce two different summaries of the same text, simply because they will disagree on what’s important. Fortunately, usually some of this infor-mation will overlap. This is represented by the idea behind the Pyramid evaluation framework (Nenkova and Passonneau, 2004; Passonneau et al., 2005), where different levels of the pyramid represent the proportion of concepts (“Summary Content Units”, or SCUs) mentioned by 1 tonsummarizers in sum-maries of the same text. Usually, there are very few SCUs that are mentioned by all summarizers, a few more that are mentioned by some of them, and the greatest proportion are the SCUs that are mentioned by individual summarizers only.
This variance in what should be a “gold standard” makes research in automatic summarization meth-ods particularly difficult. How can we reach a goal so vague and under-defined? Using term frequency to determine important concepts in a text has proven to be very successful, largely because of its simplic-ity and universal applicabilsimplic-ity, but statistical meth-ods can only provide the most basic level of perfor-mance. On the other hand, there is no real motiva-tion to use any deeper meaning-oriented text anal-ysis if we are not even certain what information to look for in order to produce a responsive summary.
To address these concerns, the Summarization track at the 2010 Text Analysis Conference1 (TAC) introduced a new summarization task – Guided Summarization – in which topics are divided into
1All datasets available at http://www.nist.gov/tac/
narrow categories and a list of required aspects is provided for each category. This serves two pur-poses: first, it creates a more focused target for au-tomatic summarizers, neutralizing human variance and pointing to concrete types of information the reader requires, and second, it provides a detailed diagnostic tool to analyze the content of automatic summaries, which can help build more meaning-oriented systems. This paper shows how these ob-jectives were achieved in TAC 2010, looking at the similarity of human-crafted models, and then using the category and aspect information to look in depth at the differences between human and top automatic summarizers, discovering strengths and weaknesses of automatic systems and areas for improvement.
2 Topic-specific summarization
The idea that different types of stories might require different approaches is not new, although the classi-fication varies from task to task. Topic categories were present in Document Understanding Confer-ence2(DUC) 2001, where topics were divided into: single-event, single-subject, biographical, multiple events of same type, and opinion. In their analy-sis of these results, Nenkova and Louis (2008) find that summaries of articles in what they call topic-cohesivecategories (single-event, single-subject, bi-ography) are of higher quality than those in non-cohesivecategories (opinion, multiple event).
In essence, categorizing topics into types is based on the assumption that stories of the same type fol-low a specific template and include the same kinds of facts, and this predictability might be employed to improve the summarization process, since we at least knowwhat kinds of informationare important and what to look for. This was shown, among others, by Bagga (1997), who analyzed source articles used in the Message Understanding Conference (MUC) and graphed the distribution of facts in articles on air vehicle launches, terrorist attacks, joint ventures, and corporate personnel changes, finding that the same kinds of facts appeared repeatedly. A nat-ural conclusion is that Information Extraction (IE) methods might be helpful here, and in fact, White et al. (2001) presented an IE-based summarization system for natural disasters, where they first filled
2http://www-nlpir.nist.gov/projects/duc/
an IE template with slots related to date, location, type of disaster, damage (people, physical effects), etc. Similarly, Radev and McKeown (1998) used IE combined with Natural Language Generation (NLG) in their SUMMON system.
There are two ways to classify stories: according to their level of cohesiveness (to use the distinction made by Nenkova and Louis (2008)), and accord-ing to subject. The first classification could help us determine which topics would be easier for au-tomatic summarization, but the difficulty is related purely to lexical characteristics of the text; as shown in Louis and Nenkova (2009), source document sim-ilarity in terms of word overlap is one of the pre-dictive features of multi-document summary qual-ity. The second classification, according to subject matter, is what enables us to utilize more meaning-oriented approaches such as IE and attempt a deeper semantic analysis of the source text, and is what we describe in this paper.
3 Guided summarization at TAC
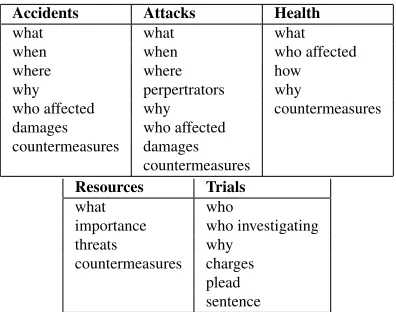
The new guided summarization task in 2010 was designed with the second classification in mind, in order to afford the participants a chance to explore deeper linguistic methods of text analy-sis. There were five topic categories: (1) Acci-dents and Natural Disasters, (2) Attacks (Crimi-nal/Terrorist), (3) Health and Safety, (4) Endangered Resources, and (5) Trials and Investigations (Crim-inal/Legal/Other).3 In contrast to previous topic-specific summarization tasks, the Guided Summa-rization task also provided a list of required aspects, which described the type of information that should be included in the summary (if such information could be found in source documents). Summariz-ers also had the option of including any other in-formation they deemed important to the topic. The categories and their aspects, shown in Table 1, were developed on the basis of past DUC and TAC topics and model summaries from years 2001-2009.
Each topic came with 20 chronologically ordered
3In the remainder of this paper, the following short forms are
Accidents Attacks Health
what what what
when when who affected
where where how
why perpertrators why
who affected why countermeasures damages who affected
countermeasures damages countermeasures
Resources Trials
what who
importance who investigating
threats why
[image:3.612.87.285.53.209.2]countermeasures charges plead sentence
Table 1: Categories and aspects in TAC 2010 Guided Summarization task.
news articles. Theinitialsummaries were to be pro-duced on the basis of the first 10 documents. As in TAC 2008 and 2009, the 2010 Summarization task had an update component: using the second 10 documents, summarizers were to produce anupdate summary under the assumption that the user had al-ready read the first set of source documents. This means that for the update part, there were two in-teracting conditions, with the requirement for non-redundancy taking priority over the requirement to address all category aspects.
For each topic, four model summaries were writ-ten by human assessors. All summaries were eval-uated with respect to linguistic quality (Overall Readability), content (Pyramid), and general quality (Overall Responsiveness). Readability and Respon-siveness were judged by human assessors on a scale from 1 (very poor) to 5 (very good), while Pyramid is a score between 0 and 1 (in very rare cases, it exceeds 1, if the candidate summary contains more SCUs than theaveragereference summary).
Since this was the first year of Guided Summa-rization, only about half of the 43 participating sys-tems made some use of the provided categories and aspects, mostly using them and their synonyms as query terms.
3.1 Model summaries across years
The introduction of categories, which implies tem-plate story types, and aspects, which further nar-rows content selection, resulted in the parallel model summaries being much more similar to each other than in previous years, as represented by the
Pyra-human automatic initial update initial update
Pyramid
2008 0.66 0.63 0.26 0.20 2009 0.68 0.60 0.26 0.20 2010 0.78 0.67 0.30 0.20
Respons.
2008 4.62 4.62 2.32 2.02 2009 4.66 4.48 2.32 2.17 2010 4.76 4.71 2.56 2.10
Table 2: Macro-average Pyramid and Responsiveness scores for initial and update summaries for years 2008-2010. Responsiveness scores for 2009 were scaled from a ten-point to a five-point scale.
mid score, which measures information overlap be-tween a candidate summary and a set of refer-ence summaries. Table 2 shows the macro-averaged Pyramid and Responsiveness scores for years 2008-2010. Both initial and update human summaries score higher for Pyramid in 2010, and also gain a lit-tle in Responsiveness. The macro-averages for auto-matic summarizers, on the other hand, increase only for initial summaries, which we will discuss further in Section 3.4. The similarity effect among model summaries can be more clearly seen in Table 3, which shows the percentage of Summary Content Units (SCUs, information “nuggets”or simple facts) with different weights in Pyramids across the years between 2008-2010. The weight of an SCU is sim-ply the number of model summaries in which this information unit appears. Pyramids in 2010 have greater percentage of SCUs with weight >1, and their proportion of weight-1 SCUs is below half of all SCUs. The difference is much more pronounced for the initial summaries, since the update compo-nent is restricted by the non-redundancy require-ment, resulting in more variance in content selection after the required aspects have been covered.4
3.2 Content coverage in TAC 2010
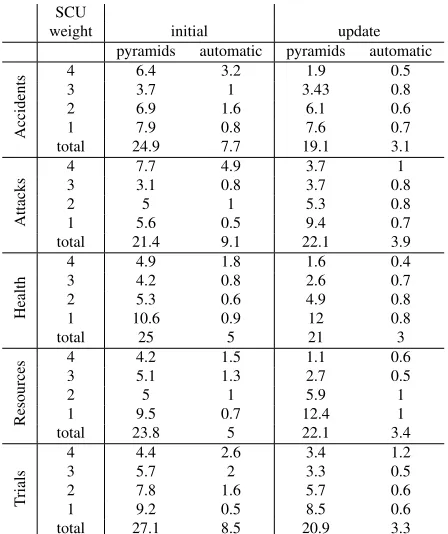
During the Pyramid creation process, assessors ex-tracting SCUs from model summaries were asked to mark the aspect(s) relevant to each SCU. This lets us examine and compare the distribution of infor-mation in human and automatic summaries. Table 4 shows macro-average SCU counts in Pyramids
com-4
[image:3.612.338.514.54.132.2]SCU
weight 2008 2009 2010
initial
4 9% 12% 22%
3 14% 13% 18%
2 22% 23% 24%
1 55% 52% 36%
update
4 8% 7% 11%
3 12% 12% 14%
2 21% 20% 26%
[image:4.612.315.539.53.320.2]1 59% 62% 49%
Table 3: Percentage of SCUs with weights 1–4 in pyra-mids for initial and update summaries for years 2008-2010.
posed of four human summaries, and macro-average counts of matching SCUs in the summaries of the 15 top-performing automatic summarizers (as deter-mined by their Responsiveness rank on initial sum-maries).5 Although automatic summaries find only a small percentage of all available information (as represented by the number of Pyramid SCUs), the SCUs they find for the initial summaries are usually those of the highest weight, i.e. encoding informa-tion that is the most essential to the topic.
SCU distribution in human summaries is also in-teresting: Health, Resources, and Trials all have the expected pyramid shape, with many low-weight SCUs at the base and few high-weight SCUs on top, but for Attacks and Accidents, the usual pattern is broken and we see an hourglass shape instead, re-flecting the presence of many weight-4 SCUs. The most likely explanation is that these two categories are guided by a relatively long list of aspects (cf. Table 1), many of which have unique answers in the source text.
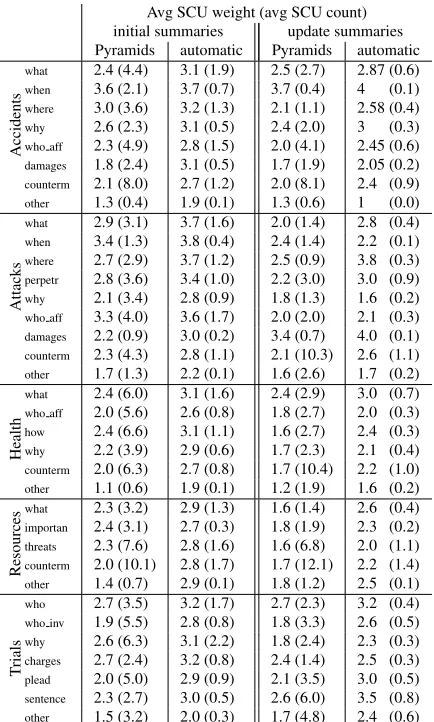
This is shown in more detail in Table 5, which presents aspect coverage by Pyramids and top 15 automatic summarizers in terms of an average num-ber of SCUs relevant to a given aspect and an aver-age weight of an aspect-related SCU. Only Attack and Accidents have aspects that tend to generate the same answers from almost all human summarizers: when, where in Accidents and what, when, where, perpetrators, and who affected in Attacks all have average weight of around 3. The patterns hold for update summaries; although all values decrease and
5
We chose to use the top 15 out of 43 participating systems in order to exclude outliers like systems that returned empty summaries, and to measure the state-of-the-art in the summa-rization field.
SCU
weight initial update
pyramids automatic pyramids automatic
Accidents
4 6.4 3.2 1.9 0.5
3 3.7 1 3.43 0.8
2 6.9 1.6 6.1 0.6
1 7.9 0.8 7.6 0.7
total 24.9 7.7 19.1 3.1
Attacks
4 7.7 4.9 3.7 1
3 3.1 0.8 3.7 0.8
2 5 1 5.3 0.8
1 5.6 0.5 9.4 0.7
total 21.4 9.1 22.1 3.9
Health
4 4.9 1.8 1.6 0.4
3 4.2 0.8 2.6 0.7
2 5.3 0.6 4.9 0.8
1 10.6 0.9 12 0.8
total 25 5 21 3
Resources
4 4.2 1.5 1.1 0.6
3 5.1 1.3 2.7 0.5
2 5 1 5.9 1
1 9.5 0.7 12.4 1
total 23.8 5 22.1 3.4
T
rials
4 4.4 2.6 3.4 1.2
3 5.7 2 3.3 0.5
2 7.8 1.6 5.7 0.6
1 9.2 0.5 8.5 0.6
total 27.1 8.5 20.9 3.3
Table 4: Macro-average SCU counts with weights 1–4 in pyramids and matching SCU counts in automatic sum-maries, for initial and update summaries.
there is less overlap between models, answers to these aspects are the most likely to occur in multi-ple summaries.
[image:4.612.117.253.53.150.2]Avg SCU weight (avg SCU count) initial summaries update summaries Pyramids automatic Pyramids automatic
Accidents
what 2.4 (4.4) 3.1 (1.9) 2.5 (2.7) 2.87 (0.6)
when 3.6 (2.1) 3.7 (0.7) 3.7 (0.4) 4 (0.1)
where 3.0 (3.6) 3.2 (1.3) 2.1 (1.1) 2.58 (0.4)
why 2.6 (2.3) 3.1 (0.5) 2.4 (2.0) 3 (0.3)
who aff 2.3 (4.9) 2.8 (1.5) 2.0 (4.1) 2.45 (0.6)
damages 1.8 (2.4) 3.1 (0.5) 1.7 (1.9) 2.05 (0.2) counterm 2.1 (8.0) 2.7 (1.2) 2.0 (8.1) 2.4 (0.9)
other 1.3 (0.4) 1.9 (0.1) 1.3 (0.6) 1 (0.0)
Attacks
what 2.9 (3.1) 3.7 (1.6) 2.0 (1.4) 2.8 (0.4)
when 3.4 (1.3) 3.8 (0.4) 2.4 (1.4) 2.2 (0.1)
where 2.7 (2.9) 3.7 (1.2) 2.5 (0.9) 3.8 (0.3)
perpetr 2.8 (3.6) 3.4 (1.0) 2.2 (3.0) 3.0 (0.9)
why 2.1 (3.4) 2.8 (0.9) 1.8 (1.3) 1.6 (0.2)
who aff 3.3 (4.0) 3.6 (1.7) 2.0 (2.0) 2.1 (0.3)
damages 2.2 (0.9) 3.0 (0.2) 3.4 (0.7) 4.0 (0.1)
counterm 2.3 (4.3) 2.8 (1.1) 2.1 (10.3) 2.6 (1.1)
other 1.7 (1.3) 2.2 (0.1) 1.6 (2.6) 1.7 (0.2)
Health
what 2.4 (6.0) 3.1 (1.6) 2.4 (2.9) 3.0 (0.7)
who aff 2.0 (5.6) 2.6 (0.8) 1.8 (2.7) 2.0 (0.3)
how 2.4 (6.6) 3.1 (1.1) 1.6 (2.7) 2.4 (0.3)
why 2.2 (3.9) 2.9 (0.6) 1.7 (2.3) 2.1 (0.4)
counterm 2.0 (6.3) 2.7 (0.8) 1.7 (10.4) 2.2 (1.0)
other 1.1 (0.6) 1.9 (0.1) 1.2 (1.9) 1.6 (0.2)
Resources
what 2.3 (3.2) 2.9 (1.3) 1.6 (1.4) 2.6 (0.4)
importan 2.4 (3.1) 2.7 (0.3) 1.8 (1.9) 2.3 (0.2)
threats 2.3 (7.6) 2.8 (1.6) 1.6 (6.8) 2.0 (1.1)
counterm 2.0 (10.1) 2.8 (1.7) 1.7 (12.1) 2.2 (1.4)
other 1.4 (0.7) 2.9 (0.1) 1.8 (1.2) 2.5 (0.1)
T
rials
who 2.7 (3.5) 3.2 (1.7) 2.7 (2.3) 3.2 (0.4)
who inv 1.9 (5.5) 2.8 (0.8) 1.8 (3.3) 2.6 (0.5)
why 2.6 (6.3) 3.1 (2.2) 1.8 (2.4) 2.3 (0.3)
charges 2.7 (2.4) 3.2 (0.8) 2.4 (1.4) 2.5 (0.3)
plead 2.0 (5.0) 2.9 (0.9) 2.1 (3.5) 3.0 (0.5)
sentence 2.3 (2.7) 3.0 (0.5) 2.6 (6.0) 3.5 (0.8)
[image:5.612.78.295.53.414.2]other 1.5 (3.2) 2.0 (0.3) 1.7 (4.8) 2.4 (0.6)
Table 5: Aspect coverage for Pyramids and top 15 auto-matic summarizers in TAC 2010.
3.3 Effect of categories and aspects
Some categories in the Guided Summarization task are defined in more detail than others, depending on types of stories they represent. Stories about at-tacks and accidents (and, to some extent, trials) tend to follow more predictable and detailed templates, which results in more similar models and better re-sults for automatic summarizers. Figure 1 gives a graphic representation of the macro-average Pyra-mid and Responsiveness scores for human and top 15 automatic summarizers, with exact scores in Ta-bles 6 and 7, where the first score marked with a letter is not statistically significant from any subse-quent score marked with the same letter, according to ANOVA (p>0.05). Lack of significant difference between human Responsiveness scores in Table 6 suggests that, for all categories, human summaries
are highly and equally responsive, but a look at their Pyramid scores confirms that Attacks and Accidents models tend to have more overlapping information.
For automatic summaries, their Pyramid and Re-sponsiveness patterns are parallel. Here Attacks, Accidents, and Trials contain on average more matching SCUs than Health and Resources, making these summaries more responsive. One reason for these differences might be that many systems rely on sentence positon in the extraction process, and first sentences in these template stories often are a short description of event including date, location, persons involved, in effect giving systems the unique-answer aspects mentioned in Section 3.2. Table 5 shows this distribution of matching information in more de-tail: for Attacks and Accidents, automatic summa-rizers match relatively more SCUs forwhat,where, when,who affectedthan forcountermeasures, dam-ages, or other. For Trials, again the easier aspects are those that tend to appear at the beginning of documents: who [is under investigation] and why. Stories in Health and Resources, the weakest cate-gories overall for automatic summarizers and with the greatest amount of variance for human summa-rizers, are non-events, instead being closer to what in past DUC tasks was described as a “multi-event” or “single subject” story type. Individual documents within the source set might sometimes follow the typical event template (e.g. describing individual instances of coral reef destruction), but in general these categories require much more abstraction and render the opening-sentence extraction strategy less effective.
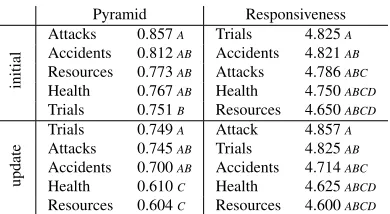
coun-Pyramid Responsiveness
initial
Attacks 0.857A Trials 4.825A
Accidents 0.812AB Accidents 4.821AB
Resources 0.773AB Attacks 4.786ABC
Health 0.767AB Health 4.750ABCD
Trials 0.751B Resources 4.650ABCD
update
Trials 0.749A Attack 4.857A
Attacks 0.745AB Trials 4.825AB
Accidents 0.700AB Accidents 4.714ABC
Health 0.610C Health 4.625ABCD
[image:6.612.326.527.51.224.2]Resources 0.604C Resources 4.600ABCD
Table 6: Macro-average Pyramid and Responsiveness scores per category for human summaries, comparison across categories.
Pyramid Responsiveness
initial
Attacks 0.524A Attacks 3.400A
Trials 0.446B Accidents 3.362AB
Accidents 0.418B Trials 3.167ABC
Resources 0.323C Resources 2.893CD
Health 0.290C Health 2.617D
update
Resources 0.286A Resources 2.520A
Trials 0.261AB Health 2.417AB
Attacks 0.251ABC Trials 2.380ABC
Health 0.236BCD Attacks 2.286ABCD
Accidents 0.228BCD Accidents 2.248ABCD
Table 7: Macro-average Pyramid and Responsiveness scores per category for top 15 automatic summaries, com-parison across categories.
termeasures, andother. We can conclude that early sentence position is not a good predictor of such in-formation, and that automatic summarizers might do well to diversify their methods of content identifi-cation based on what type of information they are looking for.
3.4 Initial and update summaries
While the initial component is only guided by the categories and aspects, the update component is placed under an overarching condition of non-redundancy. Update summaries should not repeat
Highest Lowest
Category Aspect score Category Aspect score (Accidents Other 1) Resources other 0
Attacks WHERE 0.66 Health other 0
Attacks WHAT 0.66 Attacks COUNTERM 0
Trials WHO 0.6 Attacks other 0
Attacks WHO AFF 0.56 Accidents WHY 0 Accidents WHERE 0.44 Health WHO AFF 0 Accidents WHAT 0.41 Trials SENTENCE 0.06
Trials WHY 0.38 Health WHY 0.06
[image:6.612.89.284.52.159.2]Attacks PERP 0.34 Accidents DAMAGES 0.07 Trials WHO INV 0.33 Health HOW 0.08 Trials CHARGES 0.33 Resources IMPORTAN 0.09
[image:6.612.84.288.216.323.2]Table 8: Top Pyramid scores for Baseline 1, per aspect, for initial summaries.
Figure 1: Macro-average Pyramid and Responsiveness scores in initial and update summaries, for humans and top 15 automatic systems. In each group, columns from left: Accidents, Attacks, Health, Resources, Trials. As-terisk indicates significant drop from initial score.
[image:6.612.79.291.582.674.2]Fig-ure 1).
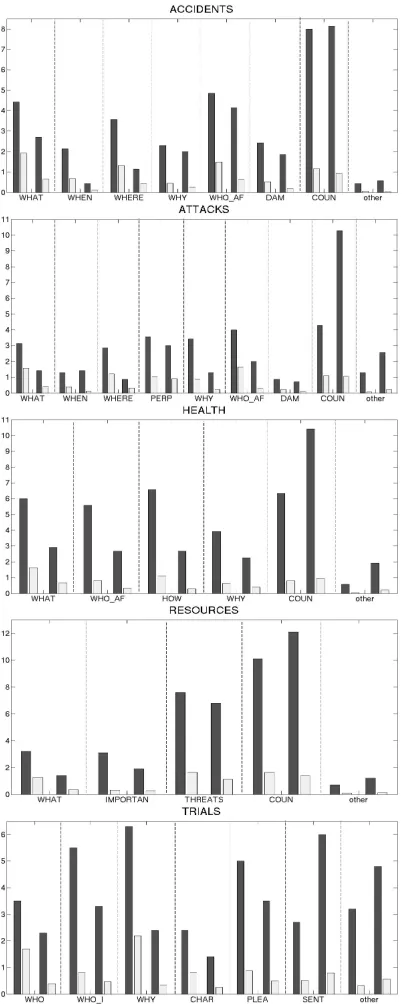
A closer look at the aspect coverage in initial and update components confirms the differences in as-pect distribution. Figure 2 gives four columns for each aspect: the first two columns represent initial summaries, the second two represent update maries. Dark columns in each pair are human marizers, light columns are top 15 automatic sum-marizers. For almost all aspects, humans find fewer relevant (and new!) facts in the update documents, with the exception ofsentence in Trials, and coun-termeasures andotherin all categories. Logically, once all the anchoring information has been given (date, time, location, event), the only remaining rel-evant content to focus on are consequences of the event (countermeasures,sentence), and possibly up-dates in victims and damages (who affected, dam-ages) as well as anyotherinformation that might be relevant. A similar (though less consistent) pattern holds for automatic summarizers.
4 Summary and conclusions
Initial attempts at more complex treatments of any subject often fail when faced with unrestricted, “real world” input. This is why almost all research in summarization remains centered around relatively simple extractive methods. Few developers try to incorporate syntactic parsing to compress summary sentences, and almost none want to venture into se-mantic decompositon of source text, since the com-plexity of these methods is the cause of potential errors. Also, the tools might not deal particularly well with different types of stories in the “newswire” genre. However, Genest (2009) showed the limits of purely extractive summarization: their manual, extractive summarizer (HexTac) performed much worse than human abstractors, and comparably to the top automatic summarizers in TAC 2009.
But if we want to see significant progress in ab-stractive summarization, it’s important to provide a more controlled environment for such experiments. TAC 2010 results show that, first of all, by guid-ing summary creation we end up with more similar human abstracts than in previous tasks (partly due to the choice of template-like categories, and partly due to the further guiding role of aspects). Narrow-ing down possible summary content, while
[image:7.612.327.529.91.593.2]ing variance due to subjective opinions among hu-man writers, creates in effect a more concrete in-formation model, and a single, unified inin-formation model is an easier goal to emulate than relying on vague and subjective goals like “importance”. Out of five categories, Attacks and Accidents generated the most similar models, mostly because they re-quired concrete, unique-answer aspects like where orwhen. In Health and Resources, the aspects were more subjective in nature, and the resulting variance was greater.
Moreover, the Guided Task provides a very valu-able and detailed diagnostic tool for system devel-opers: by looking at the system performance within each aspect, we can find out which types of infor-mation it is better able to identify. While the top au-tomatic summarizers managed to retrieve less than half of relevant information at the best of times, the facts they did retrieve were highly-weighted. Their better performance for certain aspects of Attacks, Accidents, and Trials could be ascribed to the fact that most of them rely on sentence position to deter-mine important information in the source document. A comparison of covered aspects suggests that sen-tence position might be a better indicator for some types of information than others.
Since it was the first year of the Guided Task, only some of the teams used the provided category/aspect information; as the task continues, we hope to see more participants adopting categories and aspects to guide their summarization. The predictable el-ements of each category invite the use of differ-ent techniques depending on the type of informa-tion sought, perhaps suggesting the use of Infor-mation Extraction methods. Some categories might be easier to process than others, but even if the information-mining approach cannot be extended to all types of stories, at worst we will end up with better summarization for event-type stories, like at-tacks, accidents, or trials, which together comprise a large part of reported news.
References
Amit Bagga and Alan W. Biermann. 1997. Analyzing the Complexity of a Domain With Respect To An In-formation Extraction Task. Proceedings of the tenth
International Conference on Research on Computa-tional Linguistics (ROCLING X), 175–194.
Pierre-Etienne Genest, Guy Lapalme, and Mehdi Yousfi-Monod. 2009. HEXTAC: the Creation of a Manual Extractive Run.Proceedings of the Text Analysis Con-ference 2009.
Annie Louis and Ani Nenkova. 2009. Performance confidence estimation for automatic summarization.
Proceedings of the 12th Conference of the European Chapter of the Association for Computational Linguis-tics, 541–548. Athens, Greece.
Kathleen R. McKeown, Regina Barzilay, David Evans, Vasileios Hatzivassiloglou, Judith L. Klavans, Ani Nenkova, Carl Sable, Barry Schiffman, and Sergey Sigelman. 2002. Tracking and summarizing news on a daily basis with Columbia’s Newsblaster. Proceed-ings of the Second International Conference on Hu-man Language Technology Research, 280–285. San Diego, California.
Ani Nenkova and Annie Louis. 2008. Can You Summa-rize This? Identifying Correlates of Input Difficulty for Multi-Document Summarization. Proceedings of ACL-08: HLT, 825–833. Columbus, Ohio.
Ani Nenkova and Rebecca J. Passonneau. 2004. Evaluat-ing content selection in summarization: The Pyramid method. Proceedings of the Human Language Tech-nology Conference of the North American Chapter of the Association for Computational Linguistics, 145– 152. Boston, MA.
Rebecca J. Passonneau, Ani Nenkova, Kathleen McKe-own, and Sergey Sigelman. 2005. Applying the Pyra-mid method in DUC 2005. Proceedings of the 5th Document Understanding Conference (DUC). Van-couver, Canada.
Dragomir R. Radev and Kathleen R. McKeown. 1998. Generating natural language summaries from mul-tiple on-line sources. Computational Linguistics, 24(3):470–500.