Advance Access publication 2017 October 2
SDSS-IV MaNGA: the different quenching histories of fast and slow
rotators
R. J. Smethurst,
1‹K. L. Masters,
2C. J. Lintott,
3A. Weijmans,
4M. Merrifield,
1S. J. Penny,
2A. Arag´on-Salamanca,
1J. Brownstein,
5K. Bundy,
6N. Drory,
7D. R. Law
8and R. C. Nichol
21School of Physics and Astronomy, The University of Nottingham, University Park, Nottingham NG7 2RD, UK
2Institute of Cosmology and Gravitation, University of Portsmouth, Dennis Sciama Building, Barnaby Road, Portsmouth PO13FX, UK 3Oxford Astrophysics, Department of Physics, University of Oxford, Denys Wilkinson Building, Keble Road, Oxford OX13RH, UK 4School of Physics and Astrononomy, University of St Andrews, North Haugh, St Andrews, Fife KY169RJ, UK
5Department of Physics and Astronomy, University of Utah, 115 S. 1400 E., Salt Lake City, UT 84112, USA 6University of California, Santa Cruz, 1156 High St. Santa Cruz, CA 95064, USA
7McDonald Observatory, The University of Texas at Austin, 1 University Station, Austin, TX 78712, USA 8Space Telescope Science Institute, 3700 San Martin Drive, Baltimore, MD 21218, USA
Accepted 2017 September 26. Received 2017 September 25; in original form 2017 August 25
A B S T R A C T
Do the theorized different formation mechanisms of fast and slow rotators produce an observ-able difference in their star formation histories? To study this, we identify quenching slow rotators in the MaNGA sample by selecting those that lie below the star-forming sequence and identify a sample of quenching fast rotators that were matched in stellar mass. This re-sults in a total sample of 194 kinematically classified galaxies, which is agnostic to visual morphology. We useu −randNUV −u colours from the Sloan Digital Sky Survey and
GALEXand an existing inference package, STARPY, to conduct a first look at the onset time
and exponentially declining rate of quenching of these galaxies. An Anderson–Darling test on the distribution of the inferred quenching rates across the two kinematic populations reveals they are statistically distinguishable (3.2σ). We find that fast rotators quench at a much wider range of rates than slow rotators, consistent with a wide variety of physical processes such as secular evolution, minor mergers, gas accretion and environmentally driven mechanisms. Quenching is more likely to occur at rapid rates (τ 1 Gyr) for slow rotators, in agreement with theories suggesting slow rotators are formed in dynamically fast processes, such as major mergers. Interestingly, we also find that a subset of the fast rotators quench at these same rapid rates as the bulk of the slow rotator sample. We therefore discuss how the total gas mass of a merger, rather than the merger mass ratio, may decide a galaxy’s ultimate kinematic fate.
Key words: galaxies: general – galaxy: photometry – galaxies: statistics.
1 I N T R O D U C T I O N
Recent work studying the early-type (i.e. elliptical and lenticular) galaxy population has revealed that it is actually composed of two kinematically distinct populations. The majority of early-types are rotationally supported (Emsellem et al.2011) with∼seven times the number of galaxies with kinematic discs (‘fast’ rotators), com-pared to those with either dispersion-dominated kinematics (‘slow’ rotators) or kinematically decoupled cores (which, along with slow rotators, are collectively referred to as ‘non-regular’ rotators; Cappellari et al.2007; Emsellem et al.2007). This has led to the
E-mail:[email protected]
posal of a revision of Hubble’s morphological classification scheme in the form of a ‘comb’ (see fig. 24 of Cappellari2016), whereby the evolution of a galaxy, from disc- to bulge-dominated, takes place along a ‘tine’ of the comb as a fast rotator, always retaining an underlying disc. If the discs of these regular rotators are destroyed, they then evolve along the ‘handle’ of the comb to become slow rotators.
Dry major mergers are considered the most likely process to produce high stellar mass slow rotators (Bois et al. 2010; Duc et al.2011; Naab et al.2014) as they can rapidly destroy the disc-dominated nature of a galaxy (Toomre & Toomre1972). Low stellar mass slow rotators (i.e. dwarf ellipticals withM∗109M
Table 1. Summary of the generalized rates of theorized internal and external quenching mechanisms (see Smethurst et al.2017).
Internal processes (‘nature’) External processes (‘nurture’)
Fast quenching AGN feedback Mergers
Intermediate quenching Mass quenching Environmental quenching
Slow quenching Morphological quenching Gas accretion
to evolve from the slow build up of a galaxy’s bulge over time, eventually overwhelming the disc. This growth is thought to occur via gas-rich major or minor mergers (Duc et al.2011) and by gas accretion (Cappellari et al.2013; Johnston, Arag´on-Salamanca & Merrifield2014), which can produce a bulge-dominated but rota-tionally supported galaxy (which would be visually classified as an early-type in the Hubble classification scheme).
The possible formation mechanisms listed above are also of-ten proposed as external quenching mechanisms of star forma-tion in a galaxy. However, these mechanisms are not thought to quench a galaxy at the same rate. Dynamically faster processes, such as mergers, are thought to quench star formation at rapid rates (Hopkins et al.2008; Snyder et al.2011; Hayward et al.2014), with major mergers thought to cause a much faster quench of the remnant galaxy than a minor merger (Lotz et al.2008,2011). Similarly, envi-ronmental processes, such as harassment, are also thought to cause quenching through repeated high speed interactions with neigh-bouring galaxies. Over time, these interactions can strip both stars and gas from a galaxy and heat the gas needed for star formation (Knebe et al.2006; Aguerri & Gonz´alez-Garc´ıa2009), quenching the galaxy at a slower rate than a merger. Slow quenching by an ex-ternal process is also possible through gas accretion due to the large gravitational potential of the bulge, which builds as the accreted gas sinks to the centre of the galaxy. This prevents the disc from collaps-ing and formcollaps-ing stars in an internal process, which is categorized as morphological quenching (Martig et al.2009; Fang et al.2013). Similarly, there are internal processes that are theorized to cause quenching in galaxies, including active galactic nucleus (AGN) feedback (Croton et al.2006; Somerville et al.2008), mass quench-ing (Peng et al.2010,2012) and morphological quenching (e.g. due to a galactic bar, Zurita et al.2004; Sheth et al.2005) at rapid, intermediate and slow quenching rates, respectively. Crucially, ex-ternal quenching processes are the only mechanisms theorized to be able to change the morphology of a galaxy (see section 1 of Smethurst et al.2017, for a more detailed introduction to possible quenching mechanisms). These quenching mechanisms and their theorized rates are summarized in Table1.
If fast and slow rotators form via different mechanisms, we should therefore also expect to find a difference in the star formation his-tories of quenching or quenched fast and slow rotators. This paper presents a first look at this problem by using an existing Bayesian star formation inference package,STARPY, to determine the quench-ing histories of a sample of quenchquench-ing or quenched fast and slow rotators identified in the MaNGA sample, irrespective of visual morphology. We use broad-band optical,u−r, and near-ultraviolet,
NUV−u, colours from the Sloan Digital Sky Survey (SDSS) and
GALEXto infer both the onset time and exponential rate of quench-ing for each galaxy. We aim to determine whether kinematically distinct galaxies have different quenching histories.
This paper proceeds as follows. In Section 2, we describe our data sources and our Bayesian inference method for determining the quenching histories. We present our results in Section 3 and discuss the implications of these results in Section 4. The
zero-points of all magnitudes are in the AB system. We adopt the WMAP Seven-Year Cosmology (Jarosik et al.2011) with (m, , h)= (0.26,0.73,0.71).
2 DATA A N D M E T H O D S
2.1 SDSS andGALEXPhotometry
We use optical photometry from the Sloan Digital Sky Survey Data Release 7 (SDSS DR7; York et al.2000; Abazajian et al.2009). We use the Petrosian magnitude,petroMag, values for theu(3543Å) and r (6231Å) wavebands provided by the SDSS DR7 pipeline (Stoughton et al. 2002). Further to this, we also required NUV
(2267Å) photometry from theGALEXsurvey (Martin et al.2005). Observed fluxes are corrected for galactic extinction (Oh et al.2011) by applying the Cardelli, Clayton & Mathis (1989) law. We also adoptk-corrections toz=0.0 and obtain absolute magnitudes from the NYU-VAGC1 (Blanton et al.2005; Blanton & Roweis2007; Padmanabhan et al.2008).
2.2 MaNGA Survey and data reduction pipeline
MaNGA is a multiobject IFU survey conducted with the 2.5−m Sloan Foundation Telescope (Gunn et al.2006) at the Apache Point Observatory (APO) as part of SDSS-IV (Blanton et al.2017). By 2020, MaNGA will have acquired IFU spectroscopy for∼10 000 galaxies withM∗>109M
and an approximately flat mass selec-tion (Wake et al.2017). The target selection is agnostic to morphol-ogy, colour and environment.
MaNGA makes use of the Baryon Oscillation Spectroscopic Sur-vey (BOSS) spectrograph (Smee et al.2013). The BOSS spectro-graph provides continuous coverage between 3600 and 10 300 Å at a spectral resolutionR∼2000 (σinstrument∼77 km s−1for the majority of the wavelength range2).
Complete spectral coverage to 1.5Re, a galaxy’s effective radius, is obtained for the majority of targets; a subset have coverage to 2.5Re. See Bundy et al. (2015) for an overview of the MaNGA survey. For a further description of the instrumentation used by MaNGA, see Drory et al. (2015). For a detailed description of the observing strategy, see Law et al. (2015), and for a description of the survey design, see Yan et al. (2016).
The raw data were processed by the MaNGA data reduction pipeline (DRP version 2.0.1), which is discussed in detail in Law et al. (2016). The MaNGA DRP extracts, wavelength calibrates and flux calibrates all fibre spectra obtained in every exposure. The individual fibre spectra are then used to form a regular gridded data cube of 0.5 arcsec ‘spaxels’ and spectral channels. The spectra are logarithmically sampled with bin widths of logλ=10−4.
1http://sdss.physics.nyu.edu/vagc/
These data cubes are then analysed using the MaNGA data anal-ysis pipeline (DAP version 2.0.2); the development of which is ongoing and will be described in detail in Westfall et al. ( in prepara-tion). Briefly, the spectral emission lines are masked, and the stellar continuum is modelled using the kinematic and stellar population fitting package pPXF (Cappellari & Emsellem2004). The stellar continuum model is then constructed using a thinned version of the MILES spectral library [wavelength range 3525< λ(Å)<7500]. The model is broadened to match the stellar velocity dispersion of the galaxy in order to cleanly subtract the absorption lines from the spectrum. The residual emission lines are then modelled using Gaus-sian profiles, with 21 different lines fit in total. The primary output from the DAP are therefore 2D ‘maps’ (i.e. images) of these mea-sured properties, including flux, stellar and gas kinematics, spectral index measurements, and absorption- and emission-line properties. The effective radius of a galaxy and the ellipticity within it,e, are provided for MaNGA galaxies in the NASA Sloan Atlas; we use the values measured with elliptical Petrosian apertures in v1_0_1 of the catalogue provided in the SDSS Data Release 13 (SDSS Collaboration et al.2016).
2.3 Data sample
Our galaxy sample is drawn from the 2 777 SDSS galaxies, which make up the MaNGA DR14 data release (Abolfathi et al.2017). We cross-matched these galaxies with a radius of 3 arcsec to the
GALEXsurvey in order to obtainNUVphotometry (see Section 2.1), resulting in 1 413 galaxies.
In this study, we wish to investigate the quenching histories of galaxies, therefore we sub-select those galaxies that are below the star-forming sequence (SFS). Here, we use the global average star formation rates (SFRs) quoted in the MPA-JHU catalogue3 (Kauffmann et al.2003; Brinchmann et al.2004, which are cor-rected for aperture bias). We do not use the MaNGA spectra to calculate SFRs; since the bundles only extend to 1.5Re, we might miss star formation occurring in the outer regions of galaxies, which would result in an underestimate of the global SFR of a galaxy.
We select galaxies with an SFR more than 1σ below the SFS of Peng et al. (2010). Since we wish to test whether slow rotators quench at rapid rates, consistent with major mergers, we wish to include those galaxies that have just left the SFS (rather than only selecting those that are fully quenched, for example, 3σ below the SFS).
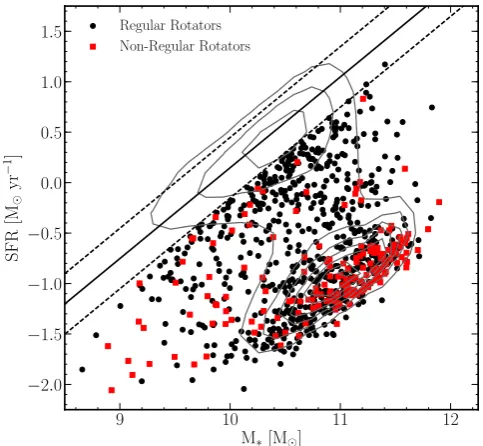
This selection on SFR when applied to theMANGA-GALEXsample results in a sample of 826 quenching or quenched galaxies, which we will refer to as theQ-MANGA-GALEXsample. This sample is shown in Fig.1.
2.4 Identifying slow and fast rotators
In order to classify the galaxies in theQ-MANGA-GALEXsample as slow rotators or otherwise, we first calculate the specific stellar angular momentum as defined by Emsellem et al. (2007,2011);
λRe =
N
i=1FiRi|Vi| N
i=1FiRi(V 2 i +σi2)1/2
, (1)
whereFiis the flux in theith spaxel,Rithe spaxel’s distance from
the galaxy centre (whereRi<Re, the effective radius of a galaxy), Vithe mean stellar velocity in that spaxel,σithe stellar velocity
[image:3.595.308.550.56.279.2]3http://wwwmpa.mpa-garching.mpg.de/SDSS/DR7/
Figure 1. Stellar mass against SFR for theQ-MANGA-GALEXsample with regular (black circles) and non-regular (red squares) rotators identified using equation (2). Shown also are the contours for the entire MPA-JHU sample (grey contours; i.e. SDSS DR7). The solid line shows the SFS as defined by Peng et al. (2010) at the average redshift of theQ-MANGA-GALEXsample, with ±1σshown by the dashed lines. Note that the galaxies in theQ-MANGA-GALEX sample are chosen to be more than 1σ below the SFS as defined at their observed redshift and stellar mass (see Section 2.3).
dispersion in that spaxel andNthe total number of spaxels. In this work, we use thePYTHONfunction provided in the MaNGA DAP to calculateλRe using the values of mean flux, radius, stellar velocity and stellar velocity dispersion (corrected for instrumental resolution effects) in each bin of the MaNGA data cubes binned with a signal-to-noise ratio of 10 using a Voronoi binning algorithm (Cappellari & Copin2003), as calculated by the MaNGA DAP (see Section 2.2). Velocity dispersion measurements in each bin of a galaxy data cube were confirmed to be above the instrument resolution of 77 km s−1. We then classify galaxies in theQ-MANGA-GALEXsample as non-regular rotators, or otherwise, using the definition from Cappellari (2016):
λRe<0.08+
e
4 with e<0.4. (2)
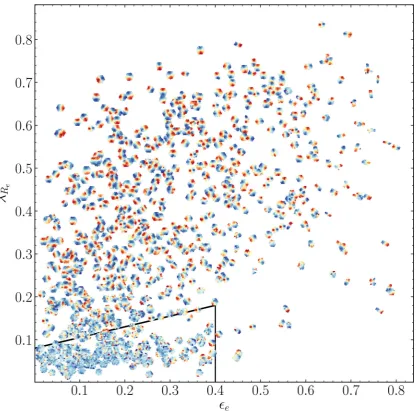
Both slow rotators and kinematically disturbed galaxies will sat-isfy this inequality, hence why this selection results in a sample of non-regular rotators. Using this definition reveals 168 (20 per cent) non-regular rotators and 658 (80 per cent) regular rotators in the Q-MANGA-GALEXsample. Fig.2shows the velocity maps of these galaxies plotted at their values ofλRe ande, along with the def-inition of a non-regular rotator from Cappellari (2016) shown by the solid black line. Note theQ-MANGA-GALEXsample is agnostic to visual morphology, so our sample of regular rotators will contain both rotationally supported early-type and late-type galaxies.
Figure 2. Ellipticity versus stellar angular momentum for the regular and non-regular rotators of theQ-MANGA-GALEXsample. Each point is shown by its stellar velocity map, each normalized to have a stellar velocity of 0 km s−1shown by the colour yellow. We show the separation between regular (i.e. fast) and non-regular rotators (i.e. slow rotators and objects with kinematically decoupled cores) from Cappellari (2016) with the solid black line.
comparison is not possible, we can at least determine if the fraction of non-regular rotators in theQ-MANGA-GALEXsample is a sensible figure given previous estimates. Considering our sample is agnos-tic to visual morphology, we would expect this selection effect to dominate, resulting in a smaller fraction of non-regular rota-tors than previous works, which specifically derived the fraction of non-regular rotators in a sample of early-types only. However, many other studies have also shown that the non-regular rotator fraction increases with stellar mass (Cappellari et al.2013), up to
∼90 per cent at 1012M
(Veale et al.2017). The median stellar mass of theQ-MANGA-GALEXsample is 1010.8M, which is higher than the median stellar mass of the ATLAS3Dsample at 1010.5M
, likely accounting for this apparent discrepancy.
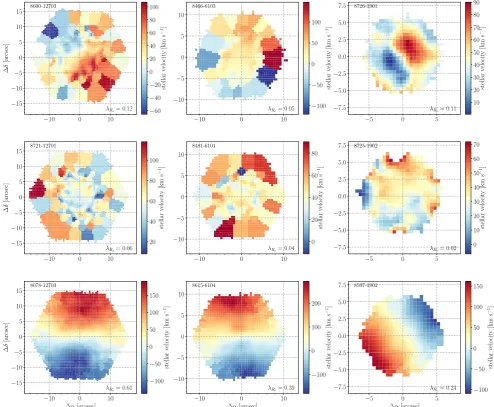
In order to obtain a sample of slow rotators, one author (RJS) in-spected the velocity maps of the 168 non-regular rotators identified in theQ-MANGA-GALEXsample to remove those galaxies that showed rotation in their kinematic map (i.e. counter rotation or decoupled cores). A total of 71 galaxies exhibiting rotation were identified, ex-ample velocity maps for which are shown in the top row of Fig.3.
This resulted in a sample of 97 slow rotators, example velocity maps for which are shown in the middle row of Fig.3.
In order to control for the degeneracies between mass, metal-licity and dust (all of which can redden a galaxy’s optical colour and mimic the effects of quenching), we selected a sub-sample of fast rotators from those identified as regular rotators in theQ -MANGA-GALEXsample. We matched to within±2.5 per cent of the stellar mass of each slow rotator to give 97 fast rotators, example velocity maps for which are shown in the bottom row of Fig.3. We shall refer to this combined sample of 194 fast and slow rota-tors as theMM-Q-MANGA-GALEXsample. An Anderson–Darling (AD; Anderson & Darling1952) test reveals that the distribution of stellar masses of the fast rotators and slow rotators within this sample is statistically indistinguishable (p=0.22). Similarly, their redshift distributions are also statistically indistinguishable (p=0.19).
Figure 3. Example stellar velocity maps, Voronoi binned with a signal-to-noise ratio of 10, for three galaxies removed from the non-regular rotator Q-MANGA-GALEXsample because their kinematics show rotation (top row), three slow rotator galaxies without rotation (middle row) and three fast rotator galaxies with rotationally supported kinematics (bottom row). The MaNGA ID of each galaxy is shown in the top left-hand of each panel and the measuredλRevalue in the bottom right-hand side. The number of spectral fibres in the MaNGA IFU bundle for each observation decreases from the left- to right-hand side.
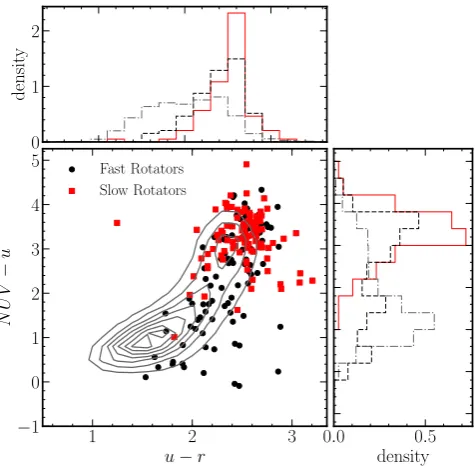
the u− r (AD= 5.9, p= 0.002) andNUV − u(AD= 19.1,
p=1×10⁻⁵) colours of the two kinematic classifications are sta-tistically distinguishable. These colours will be used to infer the SFHs of theMM-Q-MANGA-GALEXsample (see Section 2.6).
2.5 Environmental densities
We also consider the environmental densities of the fast and slow rotators by using estimates of the projected 5th nearest neighbour density, log 5, from Bamford et al. (2009). An AD test reveals that the distribution of environment densities of the 72 slow ro-tators and 80 fast roro-tators of theMM-Q-MANGA-GALEXsample with log 5 measurements from Bamford et al. (2009) is statistically indistinguishable (p=0.28).
This is surprising since the current theory is that slow rota-tors are more likely to be the central galaxy of a group or clus-ter, whereas fast rotators are more likely to be satellite galaxies (Cappellari et al.2011; D’Eugenio et al.2013; Houghton et al.2013;
Scott et al.2014). However, the MaNGA sample was chosen to be agnostic to galaxy environment, giving rise to a representative dis-tribution of galaxy environments. Most galaxies in the sample will therefore reside in groups, a more common environment for a galaxy than the relatively rare environments of rich clusters (Carlberg2004) or voids (Rieder et al.2013). We must therefore probe the positions of the two samples within the group environment itself.
Figure 4. Colour–colour diagram showing the opticalu−randNUV−u
colours of the fast (black circles) and slow (red squares) rotators of the MM-Q-MANGA-GALEXsample (main panel). Overlaid is the distribution of colours in a large SDSS–GALEXcross-matched sample from Smethurst et al. (2015) for reference (grey contours). The top panel shows the normalized distribution of theu−rcolours of the fast (black dashed) and slow (red solid) rotators of theMM-Q-MANGA-GALEXsample, along with the distribution for the Smethurst et al. (2015) sample for reference (grey dot–dashed). Similarly, the right-hand panel shows the normalized distribution of theNUV−ucolours of the fast (black dashed) and slow (red solid) rotators of theMM-Q-MANGA-GALEX sample, along with the distribution for the Smethurst et al. (2015) sample for reference (grey dot–dashed).
to probe. We must therefore remove these single galaxy ‘groups’ in order to properly test whether the slow rotators are preferentially found at the centre of the groups in theMM-Q-MANGA-GALEXsample. Testing the distributions of the total group stellar mass for the fast and slow rotators, we find they are statistically distinguishable (AD testp=0.03), with slow rotators residing in more massive groups. If we then consider only those galaxies in groups with a total stellar mass greater than 1011M
(under the simplifying assumption that this will remove the majority of single galaxy ‘groups’), we find the fraction of slow rotators classified as a BGG is 44/61 (72 per cent), whereas for fast rotators this drops to 30/52 (58 per cent), a statisti-cally distinguishable difference (p=0.04). Therefore, although the projected local environment densities of the two kinematic classes of galaxies are statistically indistinguishable, their positions within that given environment density do differ, as expected.
Given the above statistical tests, the only differences between the fast and slow rotators of theMM-Q-MANGA-GALEXsample are their kinematics, their colours and their position within their group halo.
2.6 Star formation history inference
STARPY4 is a PYTHON code that allows the inference of the ex-ponentially declining star formation history (SFH) of a single galaxy using Bayesian Markov chain Monte Carlo techniques
4Publicly available:http://github.com/zooniverse/starpy
(Foreman-Mackey et al.2013)5. The code uses the solar metallicity stellar population models of Bruzual & Charlot (2003, hereafter
BC03), assumes a Chabrier IMF (Chabrier2003) and requires the input of the observedu−randNUV−ucolours and redshift. No attempt is made to model for intrinsic dust.
The SFH is described by an exponentially declining SFR de-scribed by two parameters; the time at the onset of quenching, tq (Gyr), and the exponential rate at which quenching occurs, τ(Gyr). Under the simplifying assumption that all galaxies formed att=0 Gyr with an initial burst of star formation, the SFH can be described as
SFR= ⎧ ⎨ ⎩
isfr(tq) ift < tq isfr(tq)×exp
−(t−tq)
τ
ift > tq (3)
whereisfris an initial constant SFR dependent ontq(Schawinski et al. 2014; Smethurst et al. 2015). The simplifying assumption that all galaxies formed att=0 Gyr means that the age of each galaxy,tage, corresponds to the age of the Universe at its observed redshift, tobs. A smaller τ value corresponds to a rapid quench, whereas a largerτvalue corresponds to a slower quench. A galaxy undergoing a slow quench is not necessarily quiescent by the time of observation. This SFH model has previously been shown to appropriately characterize quenching galaxies (Weiner et al.2006; Martin et al.2007; Noeske et al.2007; Schawinski et al.2014).
The probabilistic fitting methods to these star formation histories for an observed galaxy are described in full detail in section 3.2 of Smethurst et al. (2015), wherein theSTARPYcode was used to char-acterize the morphologically dependence of the SFHs of∼126 000 galaxies. Similarly, in Smethurst et al. (2016),STARPYwas used to show the prevalence of rapid, recent quenching within a population of AGN host galaxies and in Smethurst et al. (2017) to investigate the quenching histories of group galaxies.
Briefly, we assume a flat prior on all the model parameters and model the difference between the observed and predictedu−rand
NUV−ucolours as independent realizations of a double Gaussian likelihood function (equation 2 in Smethurst et al.2015). An ex-ample posterior probability distribution output bySTARPYis shown for a single galaxy in fig. 5 of Smethurst et al. (2015), wherein the degeneracies of the SFH model between recent, rapid quenching and earlier, slower quenching can be seen.
To study the SFH across a sample of many galaxies, these indi-vidual posterior probability distributions are stacked in [tq,τ] space to give one distribution across each quenching parameter for the sample. This is no longer inference but merely a method to visu-alize the results for a population of galaxies (see appendix section C in Smethurst et al.2016for a discussion on alternative methods that may be used to determine the parent population SFH). These distributions will be referred to as the population SFH densities.
3 R E S U LT S
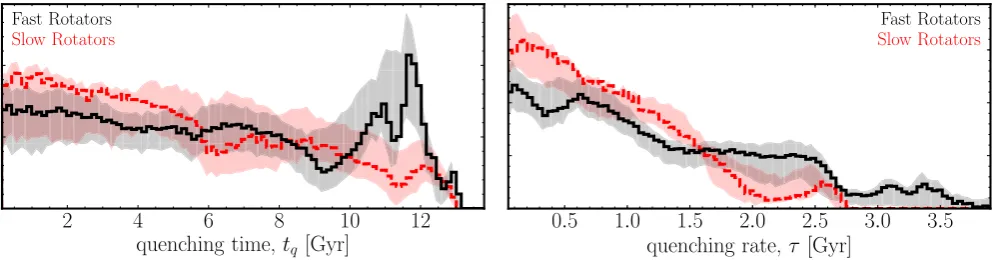
We determine the population SFH densities for both the fast and slow rotators of theMM-Q-MANGA-GALEXsample. This is shown in Fig. 5for both the onset time (left-hand panel) and exponential rate (right-hand panel) of quenching for the fast (black solid line) and slow (red dashed line) rotators. Uncertainties on the population densities (shown by the shaded regions) are determined from the maximum and minimum values spanned byN= 1000 bootstrap
Figure 5. Population densities for the time,tq(left-hand panel) and exponential rate,τ(right-hand panel) that quenching occurs in theMM-Q-MANGA-GALEX sample for the fast (black, solid) and slow (red, dashed) rotators. A high value oftqcorresponds to a recent quench, and a high value ofτcorresponds to a slow quench. Shaded regions show the uncertainties on the distributions from bootstrapping.
iterations, each sampling 90 per cent of either the fast (black shaded region) or slow (red shaded region) rotators.
To statistically test the significance of our results, we estimate the ‘best-fitting’ [tq, τ] values for each galaxy with the median value of an individual galaxy’s posterior probability distribution fromSTARPY(i.e. the 50th percentile position of the MCMC chain). We test the distribution of these values of the fast and slow rotators in theMM-Q-MANGA-GALEXsample with AD tests. First, an AD test on the distributions oftqvalues in the fast and slow rotator samples revealed that we cannot reject the null hypothesis that the fast and slow rotators quench at the same time (AD= 0.65, p= 0.69). Finally, an AD test on the distributions ofτvalues revealed that we can reject the null hypothesis that the fast and slow rotators quench at the same rate (AD=6.3,p=0.001). This is a 3.2σ result that suggests that slow rotators quench faster than fast rotators of the same mass.
4 D I S C U S S I O N
The results presented in Section 3 suggest that fast and slow rotators are indeed separate populations quenched, and therefore formed, by different mechanisms. However, these quenching mechanisms occur at statistically indistinguishable onset times for fast and slow rotators. Khochfar et al. (2011) find in their simulations that the last major merger interaction for slow rotators was atz1.5 (i.e. tq4.5 Gyr). However, Penoyre et al. (2017) find in the Illustris simulation that slow rotators only form afterz<1 (i.e.tq6 Gyr). We note thatSTARPYis not very sensitive to the time of quenching, particularly at early times (tq6 Gyr whenz 1), due to the degeneracies between the optical andNUVcolours currently used to infer the quenching parameters. Therefore, we cannot currently conclude which scenario our results favour. Future work altering our inference code to take spatial spectral information provided by MaNGA may help us to address this issue by breaking the degeneracies inherent in the photometric colours.
However, STARPYin its current form is sensitive to the rate of quenching in a galaxy. In the right-hand panel of Fig.5, we see that there is a wide range of quenching rates occurring within the fast rotator sample. Previous works usingSTARPYhave shown how the intermediate quenching rates [1τ (Gyr)2] prevalent in the distribution of the fast rotator sample can be attributed to en-vironmental processes such as harassment and galaxy interactions (Smethurst et al.2017), or minor mergers (Smethurst et al.2015). This is unsurprising given that the fast rotators are less likely to be
the BGG than the slow rotators of theMM-Q-MANGA-GALEXsample, as discussed in Section 2.5.
In particular, we find evidence for galaxies in the fast rotator sample to quench at slow rates (τ≥2 Gyr). Since theQ-MANGA -GALEXsample is agnostic to visual morphology, it will contain fast rotators that are disc-dominated (i.e. late-type galaxies). This pref-erence for slow quenching rates is therefore likely to be caused by the effects of secular evolution through gas accretion and morpho-logical quenching, slowly moving these disc galaxies off the SFS to produce the red spiral population of Masters et al. (2012). Us-ing the morphological classifications of Galaxy Zoo 2 (GZ2 Lintott et al.2011; Willett et al.2013), we find that 20/97 (21 per cent) of the fast rotators of theMM-Q-MANGA-GALEXsample are disc domi-nated with a disc or featured debiased vote fraction,pd≥0.8 (i.e. 80 per cent of classifiers marked the galaxy as having either a disc or features). This is consistent with the fact that 23±2
11 per cent of the fast rotator quenching rate population density (black line in the right-hand panel of Fig.5) is found at quenching ratesτ >2 Gyr.
Conversely, only 1 of the slow rotators was classified as having a disc or features by GZ26It is not surprising therefore that there is much less preference for slow quenching rates, withτ≥2 Gyr, for slow rotators than fast rotators in the right-hand panel of Fig.5. However, Smethurst et al. (2015) found for galaxies in the red sequence visually classified as ‘smooth’ in GZ2 (i.e. quenching or quenched early-types) that a significant fraction, 26.1 per cent, of the quenching rate population density was found at these slow quenching rates (see the left-hand panel of their fig. 8). However, a sample of visually classified ‘smooth’ galaxies in GZ2 may include both fast and slow rotators. It is only in this work that we have been able to investigate the difference in the SFHs of galaxies that are rotationally supported from those that are not, revealing that the stellar kinematics are driving the morphologically dependant star formation histories seen in Smethurst et al. (2015).
The slow rotators in theMM-Q-MANGA-GALEXsample instead show a preference for rapid quenching rates (τ1 Gyr) in the right-hand panel of Fig.5. Assuming that major mergers are the only mech-anism able to destroy rotation in a galaxy, this result supports the theory that these galaxies are formed by major mergers that, along with destroying the disc of a galaxy, are thought to cause quench-ing at such rapid rates (Sprquench-ingel, Di Matteo & Hernquist2005; Bell et al.2006; Lotz et al.2008,2011). Surprisingly, we also find
evidence that some of the fast rotators are quenching at these same rapid rates (τ1 Gyr) in the right-hand panel of Fig.5. This sug-gests that in a fraction of fast rotators, a dynamically fast process, such as a major merger, may be the cause of quenching.
Simulations have recently shown that although major mergers (2:1 or 1:1 mergers) can cause rapid quenching of a galaxy, they do not necessarily destroy the disc-dominated nature of a galaxy (Pontzen et al. 2016; Sparre & Springel 2016) and can actually form a fast rotator remnant (Bois et al.2011). This is thought to mainly occur in gas rich major mergers (Bois et al.2011) and is likely the explanation for the presence of rapid rates in the fast rotator sample seen in the right-hand panel of Fig. 5. We there-fore predict that the fast rotators in theMM-Q-MANGA-GALEXsample will be more gas rich than the slow rotators they are stellar mass matched to. We will be able to test this hypothesis with currently ongoing follow-up observations using the Green Bank Telescope (GBT16A-095 and GBT17A-012; Masters et al. in preparation) which will obtain HIprofiles for galaxies in the MaNGA target sam-ple. With these observations, we will be able to determine whether gas mass has an impact on the formation mechanisms of these kinematically distinct galaxies.
5 C O N C L U S I O N S
We have investigated the star formation histories of quenching or quenched fast and slow rotators identified in the MaNGA galaxy sample, irrespective of their visual morphology. We used theu−r
andNUV−ucolours with an existing piece of inference software, STARPY, to determine the onset time and exponential rate of quench-ing in each of these galaxies.
An Anderson–Darling test revealed that the distribution of the inferred quenching rates of fast and slow rotators is statistically distinguishable (p= 0.001, 3.2σ). We find that rapid quenching rates (τ1 Gyr) are dominant for slow rotators, supporting the theory that slow rotators form in dynamically fast processes, such as major mergers (Bois et al.2010; Duc et al.2011; Naab et al.2014). Conversely, we find that fast rotators quench at a wide range of rates, consistent with dynamically slow processes such as secular evolution, minor mergers, gas accretion and environmentally driven mechanisms. However, we also find evidence that some of the fast rotators are quenching at the same rapid rates dominant across the slow rotator sample.
This finding of rapid quenching rates occurring for both slow rotators and a subset of the fast rotators suggests that although their kinematics are different in nature, both classes of galaxy may be able to quench, and therefore form, via major mergers. This result combined with the findings of recent simulations showing disc survival in gas-rich major mergers (Bois et al.2011; Pontzen et al.2016; Sparre & Springel2016) suggests that the total gas mass fraction within a pair of merging galaxies is what will ultimately decide the kinematic fate of a galaxy.
AC K N OW L E D G E M E N T S
RJS gratefully acknowledges research funding from the Ogden Trust. AW acknowledges support of a Leverhulme Trust Early Career Fellowship.
Based on observations made with the NASA Galaxy Evolution Explorer.GALEXis operated for NASA by the California Institute of Technology under NASA contract NAS5-98034.
Funding for the Sloan Digital Sky Survey IV has been pro-vided by the Alfred P. Sloan Foundation, the U.S. Department of
EnergyOffice of Science and the Participating Institutions. SDSS acknowledges support and resources from the Center for High-Performance Computing at the University of Utah. The SDSS web site iswww.sdss.org.
SDSS is managed by the Astrophysical Research Consortium for the Participating Institutions of the SDSS Collaboration in-cluding the Brazilian Participation Group, the Carnegie Institution for Science, Carnegie Mellon University, the Chilean Participa-tion Group, the French ParticipaParticipa-tion Group, Harvard-Smithsonian Center for Astrophysics, Instituto de Astrof´ısica de Canarias, The Johns Hopkins University, Kavli Institute for the Physics and Mathematics of the Universe (IPMU) / University of Tokyo, Lawrence Berkeley National Laboratory, Leibniz Institut f¨ur Astro-physik Potsdam (AIP), Max-Planck-Institut f¨ur Astronomie (MPIA Heidelberg), Max-Planck-Institut f¨ur Astrophysik (MPA Garch-ing), Max-Planck-Institut f¨ur Extraterrestrische Physik (MPE), Na-tional Astronomical Observatories of China, New Mexico State University, New York University, University of Notre Dame, Ob-servat´orio Nacional / MCTI, The Ohio State University, Pennsylva-nia State University, Shanghai Astronomical Observatory, United Kingdom Participation Group, Universidad Nacional Aut´onoma de M´exico, University of Arizona, University of Colorado Boul-der, University of Oxford, University of Portsmouth, University of Utah, University of Virginia, University of Washington, University of Wisconsin, Vanderbilt University and Yale University.
R E F E R E N C E S
Abazajian K. N. et al., 2009, ApJS, 182, 543 Abolfathi B. et al., 2017, preprint (arXiv:e-prints)
Aguerri J. A. L., Gonz´alez-Garc´ıa A. C., 2009, A&A, 494, 891 Anderson T. W., Darling D. A., 1952, Ann. Math. Statist., 23, 193 Bamford S. P. et al., 2009, MNRAS, 393, 1324
Bell E. F., Phleps S., Somerville R. S., Wolf C., Borch A., Meisenheimer K., 2006, ApJ, 652, 270
Blanton M. R., Roweis S., 2007, AJ, 133, 734
Blanton M. R., Eisenstein D., Hogg D. W., Schlegel D. J., Brinkmann J., 2005, ApJ, 629, 143
Blanton M. R. et al., 2017, AJ, 154, 28 Bois M. et al., 2010, MNRAS, 406, 2405 Bois M. et al., 2011, MNRAS, 416, 1654
Brinchmann J., Charlot S., White S. D. M., Tremonti C., Kauffmann G., Heckman T., Brinkmann J., 2004, MNRAS, 351, 1151
Bruzual G., Charlot S., 2003, MNRAS, 344, 1000 Bundy K. et al., 2015, ApJ, 798, 7
Cappellari M., 2016, ARA&A, 54, 597
Cappellari M., Copin Y., 2003, MNRAS, 342, 345 Cappellari M., Emsellem E., 2004, PASP, 116, 138 Cappellari M. et al., 2007, MNRAS, 379, 418 Cappellari M. et al., 2011, MNRAS, 413, 813 Cappellari M. et al., 2013, MNRAS, 432, 1862
Cardelli J. A., Clayton G. C., Mathis J. S., 1989, ApJ, 345, 245
Carlberg R. G., 2004, in Mulchaey J. S., Dressler A., Oemler A., eds, Clusters of Galaxies: Probes of Cosmological Structure and Galaxy Evolution. Cambridge Univ. Press, Cambridge, p. 343
Chabrier G., 2003, PASP, 115, 763 Croton D. J. et al., 2006, MNRAS, 365, 11
D’Eugenio F., Houghton R. C. W., Davies R. L., Dalla Bont`a E., 2013, MNRAS, 429, 1258
Drory N. et al., 2015, AJ, 149, 77 Duc P.-A. et al., 2011, MNRAS, 417, 863 Emsellem E. et al., 2007, MNRAS, 379, 401 Emsellem E. et al., 2011, MNRAS, 414, 888
Foreman-Mackey D., Hogg D. W., Lang D., Goodman J., 2013, PASP, 125, 306
Gunn J. E. et al., 2006, AJ, 131, 2332
Hayward C. C., Torrey P., Springel V., Hernquist L., Vogelsberger M., 2014, MNRAS, 442, 1992
Hopkins P. F., Hernquist L., Cox T. J., Kereˇs D., 2008, ApJS, 175, 356 Houghton R. C. W. et al., 2013, MNRAS, 436, 19
Jarosik N. et al., 2011, ApJS, 192, 14
Johnston E. J., Arag´on-Salamanca A., Merrifield M. R., 2014, MNRAS, 441, 333
Jones L. R., Ponman T. J., Forbes D. A., 2000, MNRAS, 312, 139 Jones L. R., Ponman T. J., Horton A., Babul A., Ebeling H., Burke D. J.,
2003, MNRAS, 343, 627
Kauffmann G. et al., 2003, MNRAS, 341, 33 Khochfar S. et al., 2011, MNRAS, 417, 845
Knebe A., Power C., Gill S. P. D., Gibson B. K., 2006, MNRAS, 368, 741 Law D. R. et al., 2015, AJ, 150, 19
Law D. R. et al., 2016, AJ, 152, 83 Lintott C. et al., 2011, MNRAS, 410, 166
Lotz J. M., Jonsson P., Cox T. J., Primack J. R., 2008, MNRAS, 391, 1137
Lotz J. M., Jonsson P., Cox T. J., Croton D., Primack J. R., Somerville R. S., Stewart K., 2011, ApJ, 742, 103
Martig M., Bournaud F., Teyssier R., Dekel A., 2009, ApJ, 707, 250 Martin D. C. et al., 2005, ApJ, 619, L1
Martin D. C. et al., 2007, ApJS, 173, 342 Masters K. L. et al., 2012, MNRAS, 424, 2180 Naab T. et al., 2014, MNRAS, 444, 3357 Noeske K. G. et al., 2007, ApJ, 660, L43
Oh K., Sarzi M., Schawinski K., Yi S. K., 2011, ApJS, 195, 13 Padmanabhan N. et al., 2008, ApJ, 674, 1217
Peng Y.-j. et al., 2010, ApJ, 721, 193
Peng Y.-j., Lilly S. J., Renzini A., Carollo M., 2012, ApJ, 757, 4 Penoyre Z., Moster B. P., Sijacki D., Genel S., 2017, MNRAS, 468, 3883 Ponman T. J., Allan D. J., Jones L. R., Merrifield M., McHardy I. M., Lehto
H. J., Luppino G. A., 1994, Nature, 369, 462
Pontzen A., Tremmel M., Roth N., Peiris H. V., Saintonge A., Volonteri M., Quinn T., Governato F., 2016, MNRAS, 465, 547
Rieder S., van de Weygaert R., Cautun M., Beygu B., Portegies Zwart S., 2013, MNRAS, 435, 222
Schawinski K. et al., 2014, MNRAS, 440, 889
Scott N., Davies R. L., Houghton R. C. W., Cappellari M., Graham A. W., Pimbblet K. A., 2014, MNRAS, 441, 274
SDSS Collaboration et al., 2016, preprint (arXiv:e-prints)
Sheth K., Vogel S. N., Regan M. W., Thornley M. D., Teuben P. J., 2005, ApJ, 632, 217
Smee S. A. et al., 2013, AJ, 146, 32
Smethurst R. J. et al., 2015, MNRAS, 450, 435 Smethurst R. J. et al., 2016, MNRAS, 463, 2986
Smethurst R. J., Lintott C. J., Bamford S. P., Hart R. E., Kruk S. J., Masters K. L., Nichol R. C., Simmons B. D., 2017, MNRAS, 469, 3670 Snyder G. F., Cox T. J., Hayward C. C., Hernquist L., Jonsson P., 2011, ApJ,
741, 77
Somerville R. S., Hopkins P. F., Cox T. J., Robertson B. E., Hernquist L., 2008, MNRAS, 391, 481
Sparre M., Springel V., 2016, MNRAS, 470, 3946
Springel V., Di Matteo T., Hernquist L., 2005, ApJ, 620, L79 Stott J. P. et al., 2016, MNRAS, 457, 1888
Stoughton C. et al., 2002, AJ, 123, 485 Toloba E. et al., 2015, ApJ, 799, 172 Toomre A., Toomre J., 1972, ApJ, 178, 623 Veale M. et al., 2017, MNRAS, 464, 356 Wake D. A. et al., 2017, AJ, 154, 26 Weiner B. J. et al., 2006, ApJ, 653, 1049 Willett K. W. et al., 2013, MNRAS, 435, 2835 Yan R. et al., 2016, AJ, 152, 197
Yang X., Mo H. J., van den Bosch F. C., 2009, ApJ, 695, 900 York D. G. et al., 2000, AJ, 120, 1579
Zurita A., Rela˜no M., Beckman J. E., Knapen J. H., 2004, A&A, 413, 73