Simulation on DC Current Distribution in AC
Power Grid under HVDC Ground-Return-Mode
Guihua Mei1,2, Yuanzhang Sun1, Yancun Liu2
1Department of Electrical Engineering, Tsinghua University, Beijing, China; 2Department of Electrical Power System Technique, Guang Dong Electric Power Research Institute, GuangZhou, China.
Email: {meiguihua, liuyancun}@gddky.csg.cn,[email protected]
Received February 20th, 2010; revised April 16th, 2010; accepted April 25th, 2010.
ABSTRACT
This paper focus on the Modeling and Calculation of DC current distribution in AC power grid induced under HVDC Ground-Return-Mode. Applying complex image method and boundary element method, a new field-circuit coupling model was set up. Based on the calculation result with complex image method, this paper derived the modification fac-tor for induced earth potential from practical measurement, which increased the accuracy of calculation. The modifica-tion method is helpful for evaluamodifica-tion on the effect of means used for blocking the dc-bias current in transformer neutral and also useful for the forecast of the DC current distribution when the power grid is in different line connection mode. The DC distribution character in Guangdong power grid is shown and suggestion is proposed that the mitigation of dc-bias should start from those substations whose earth-potential is highest.
Keywords: HVDC, DC-Bias, DC Distribution, Ground-Return Current, Simulation
1. Introduction
As an emergency mode, it’s inevitable that HVDC trans- mission system operated in Ground-Return Mode (GRM) occasionally. When HVDC operate in GRM, as a result of current injection into soil through grounding electro- des, part of the return current will flow through the coils of the transformer whose neutral connected to the earth, and it will lead to wave distortion, noise and overheating etc. Sometimes it will lead to the damages of transformer or/and capacitor bank, disturbing the normal operation of power grid.
For evaluation on the range and degree of the influ-ence by the HVDC in GRM, it is necessary to calculate the dc current distribution in ac network, summarizing characteristics of dc current distribution and providing data for the application of dc current blocking devices (DCBD). It’s also need to evaluate the effects after using DCBD for better location.
In the related topic, most researches are focus on the calculation and analysis of earth potential distribution induced by ground return current of HVDC before 2003. Article [1] described a methodology that allows suitable calculations of the electric field as well as the potentials and current densities due to current in the ground electrode of a HVDC system in any point of nonhomogeneous soils and air media. Paper [2] presen-
ted a method for the theoretical evaluation of the soil surface potentials induced in ground return mode and giving rise to soil models amenable to mathematical analysis. Paper [3] presented a method to evaluate the electric voltage and the current density in the immedi-ate vicinity of a toroidal grounding installation of DC substations.
After 2005, related researches [4-14] report a lot. 2006, Dr Zhang Bo [4] used numerical methods to calculate the DC current distribution in AC power sys-tem caused by a HVDC syssys-tem. Moment method is applied to calculate the electric fields in complex earth structure caused by all the grounding systems including DC grounding electrodes, AC substation grounding systems, and the long metal pipe lines. The circuit equ- ations are coupled to the moment method to combine the AC transmission lines with the grounding systems.
Based on specified model, [5] and [10] calculated DC currents through earthed neutral transformers by using field circuit coupling method and the resistance network algorithm. It concluded that the resistance net- work algorithm can be applied to engineering instead of the using of field-circuit coupling method.
through transformers’ earthed neutral under different soil structure was analyzed. Based on the physical mea- ning of Green’s function, [6] solved the potential expr- ession for horizontal-vertical-composite structure soil by applying the image method. In the same year, [8] studied DC bias problem of transformers of nuclear power plant and the character of DC current distribu-tion, potential distribution of vertical grounding electr- ode and the DC capabilities of transformers were also carried out.
In the research report [7] by China Southern grid technology center and Tsinghua University, the field- circuit model was brought forward. This model consid- ered inhomogeneity of soil. It was divided into two parts: the grounding network and the transmission line network. Applying this model, DC current distribution in AC power grid under HVDC transmission’s ground return mode was analyzed. DC bias simulation model for three-phase compact transformer, also three-phase and three-limb transformer, three-phase transformer with five-limb core, is presented. The analyzed method for 3 dimensions for eddy field is put forward. The influence of HVDC transmission’s ground return cur-rent to transformers is analyzed. Some rules about the difference of different structure transformer and miti-gation transformer’s DC bias were proposed.
Although lots of researches have been made, there are still many questions to be investigated.
The diversity and complexity of geological condi-tion leads to low accuracy of simulacondi-tion and the simulation result will be unauthentic.
The simulation result should be checked out by lots of measuring data.
Theoretical and practical research of the 220kV and 500kV substations in Guangdong power grid was car-ried out on the base of the online measuring system of DC current through transformers’ neutral. Further re-search of modification for the theoretical model by the data of measuring system was accomplished.
2. Calculation Model
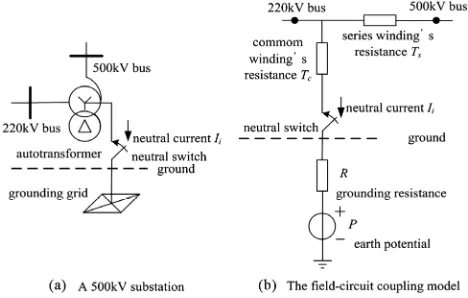
The model for power network above ground was de-scribed by electrical circuit method while the model for underground part was described by the field model which was shown in the electrical circuit way. By these models, we combine the circuit network above ground with the field effect underground to solve the problem.
The underground model of substation, which is ex-pressed by a DC ground resistance in series with an earth potential source, is shown in Figure 1.
R is the equivalent resistance between the transfor- mer’s neutral and the zero-potential point (the farthest point).
P is the earth potential induced by HVDC ground re- turn current and the grounded current of other substation.
In this paper, the solution method for P was complex image method or boundary element method on the as-sumption that P are related with the HVDC ground return current, the position of the substation and DC grounding electrode, geological condition, but independent of op-eration mode of power grid.
The whole model of dc distribution was shown in Fig-ure 2.
By nodal analysis of circuit theory, we have
GV SP (1) In (1), G is the conductance matrix, V is the nodal volt-age matrix, P is the earth potential of substation, S is the transfer matrix of earth potential and nodal current.
The relationship between nodal current and earth po-tential was shown as follow:
DC
[image:2.595.307.541.331.480.2]P YI MI (2) In (2), Y is the mutual resistance matrix between sub-stations,I is the injected current matrix of substations, M
[image:2.595.308.538.507.707.2]Figure 1. The network model of substation
is the mutual resistance matrix between substations and dc electrode, IDC is the injected current of dc electrode.
The relationship between nodal voltage and injected current was shown as follow:
IXV (3) In (3), X is the transfer matrix of nodal voltage and in-jected current.
From (1)-(3), we have
G SYX V
SMIDC (4) Equation (4) shows injected current drives DC distri-bution in ac power grid and dc distridistri-bution is decided by the DC network parameters.3. Comparison between Complex Image
Method and Boundary Element Method
Complex image method (CIM) and boundary element method (BEM) are of different characters when applied in the large scale grounding problem.
CIM is relatively simple. mountain, river and ocean are not took into account, only the equivalent horizontal stratified structure soil is needed, regardless of the subdi-vision of boundary element. The program is relatively simple, the consumption of CPU time and PC memory are much less than BEM.
In theory, BEM is the most proper method for the com- plexity and difference of geological condition. But sub-division of boundary element, also the coupling of dif-ferent elements is needed. When the number of boundary element becomes large, CPU time and memory are great- ly consumed. There are some questions when large scale BEM program operated in personal computer. By exam-ple of CDEGS of SES Corporation, the upper limit for the number of boundary element is about 20000 when the software used in PC. For the problem in this paper, 20000 boundary elements can not fully expressed the complexity and difference of geological condition in Gu- angdong (the area of Guangdong is about 180000 km2).
XinAn HVDC system was taken as example for comp- arison of the two methods. By validation of measuring data, we will find the better method to solve this problem.
4. Complex Image Model
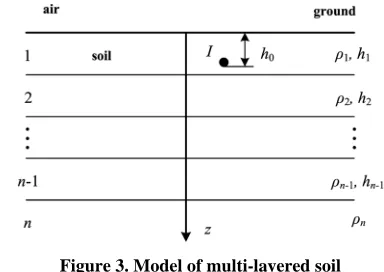
The horizontal stratified structure soil is shown in Figure 3. h is the thickness of the soil while ρ is the resistivity,
and I is the current point.
Applying Prony method [15], the Green’s function of horizontal stratified structure soil is:
2 22 2 2 2
1
1 ,
4
4 ( ) ( )
M
i i
i
i i
ρI r z
r z
a c
ρI
r z b r z d
(5)
where: ai and ci is the amplitude of complex image, bi and di is the position of complex image.
For approximation, all the DC and AC grounding electrodes were viewed as point source. So the earth pot- ential of substation induced by current point source could be got by (1).
The earth potential induced by XinAn HVDC ground return current with 600 A could be obtained and the earth potential curve is shown in Figure 4. The soil parameter
is listed in Table 1.
Figure 4 shows that earth potential decrease rapidly
[image:3.595.323.515.251.387.2]while d < 20 km. Potential difference between line-con- nected substations may lead to dc bias of transformers.
[image:3.595.308.536.419.702.2]Figure 3. Model of multi-layered soil
Table 1. 4-layer horizontal stratified soil parameter
layer number Resistivity (Ω·m) thickness (m)
1 235 30
2 5900 1000
3 14100 50000
4 120 inf
0 20 40 60 80 100 120 d (km)
250
200
150
100
50
0
p
(V
)
5. Method of Model Modification
Because of the complexity and difference of geological condition, the approximation will bring down the verac-ity of the model and even the simulation result will be-come invalid.
This paper presented a feasible method to overcome this shortage. Applying the measuring data, provided by the online monitoring system of DC current through the neutral of transformer, we modify the parameter of the model.
The core of this method is to modify the earth poten-tial P by the measuring data. The question of modifying the earth potential could be solved by the least-square method.
Supposed the injecting current of DC electrode is x. there are m substations’ earth potentials to be modified. Let
, 1,i i i
r x I x J x i m (6)
where Ii(x) are the measuring data, Ji(x) are the computa-tional result by CIM.
2
1
1
( ) ( ), ,
2
m
n i
i
f x r x x R m n
(7)Let
1 2
( ) ( ( ), ( ), , ( ))T m
r x r x r x r x (8) The objective function is:
1
( ) ( ) ( )
2
T
f x r x r x (9)
This equation could be solved by numerical analysis of Gauss-Newton.
In many practical problems, if x* is the locally solu-tion and corresponding objective funcsolu-tion value f x( )* close to 0, when the iterative point close to x*, or the curve r xi( ) is almost a straight line ( 2 ( ) 0
i
r x
), the Gauss-Newton method can produce a good effect. But when r x( ( )k ) is large, or ( )
i
r x ’s curvature is large,
2f x( ( )k )
ignores 2
1
( ) ( )
m
i i
i
r x r x
which is not ne-glectable, so the Gauss-Newton method can’t get the right answer.Obviously, J x( ( )k )TJ x( ( )k ) is a Positive semidefinite
matrix. If Jacobi matrix J x( ( )k ) is column full rank,
matrix J x( ( )k )TJ x( ( )k ) is positive definite matrix. So ( )k
d , getting from the equations, is agree with the de-scending direction of f x( ), but f x( (k1)) f x( ( )k )
isn’t confirmed, then additional one-dimension search is needed as the Newton method.
6. Examples
XinAn HVDC system consists of a 1200km long bipolar
±500 kVdc transmission line with transmitting capacity of 3000MW in Southern China. When HVDC system operates in ground return mode, 3000 A direct current will inject into the earth.
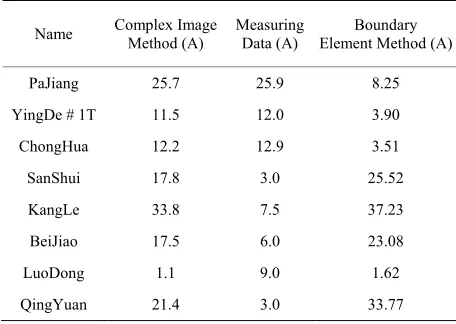
Under the transmission lines connection of Guangdong power grid in Apr 2007 and suppose that 600 ADC current injected into the earth by HVDC, The result of trans-former neutral dc current at some substation by CIM and BEM was listed in Table 2. The geological condition
was approximate to horizontal 4 layers soil for complex image method. The BEM boundary condition was deter-mined by the geologic exploration result.
From Table 2, we can see,
1) The result of YingDe-PaJiang-ChongHua by CIM is close to measuring data, but BeiJiao’s computation result was near 3 times of measuring data. As a whole, hori- zontal 4 layers soil is suitable for the local geological condition.
2) The difference between computation and measuring for QingYuang, KangLe, SangShui and LuoDong was large. The reason is another HVDC system (TianGuang) was then under bipolar operation mode with unbalanced power of 400MW, which influence the earth potential of the substations on the path of QingYuan-KangLe-Sang- Shui-LuoDong, when the measuring data were recorded. The event leads to the measuring data stand for not only the influence of XinAn HVDC system and the error. But however the correction of the method presented in this paper do not be influenced.
[image:4.595.308.536.559.721.2]Although actual geological condition of Guangdong province was considered and LAPACK for matrix algo-rithm is used, problems were still found that BEM de-mands huge CPU time and occupied big size memory.
Table 2. Computational result and measuring data
Name Complex ImageMethod (A) Measuring Data (A) Element Method (A)Boundary
PaJiang 25.7 25.9 8.25
YingDe # 1T 11.5 12.0 3.90
ChongHua 12.2 12.9 3.51
SanShui 17.8 3.0 25.52
KangLe 33.8 7.5 37.23
BeiJiao 17.5 6.0 23.08
LuoDong 1.1 9.0 1.62
Boundary element’s number N is limited as computing time grows proportionally to N3, which leads to the boundary division being rough and the geological condi-tion could not be simulated properly, especially for rivers and ocean. Another side, the lacking of geological condi-tion parameter in large area for DC current conducting also leads to simulation error.
6.1 Example for the Method of Model Modification
Based on the operation mode of Guangdong power grid in Apr 2007, the modification model for complex image method was used to solve DC distribution when XinAn HVDC system was under commissioning in 2007. Com-parison between computation result and measuring data is shown in Table 3.
From the result above we could see that in large area, the simulation result of the transformer neutral dc current are more close to the measuring data without appearance of big error. The modification factor getting by the field measuring data will be helpful for these simulations, such as changing of transmission line connection, being built of new transmission line or the effect evaluation of DCBD using, etc.
7. Summary on the DC Distribution in
Guangdong Power Grid
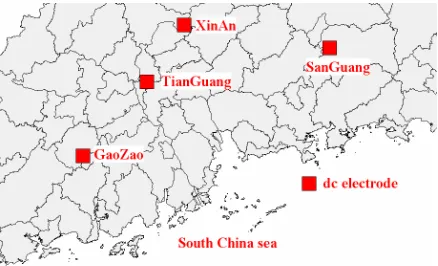
According to the operation mode of Guangdong power grid in the first half of 2008, the correction model was used to analyze the DC bias caused by the 4 HVDC transmission projects in Guangdong power grid. Some conclusions are listed as follows.
[image:5.595.314.533.570.703.2]When HVDC system is under ground return mode, the transformer, whose location is close to the location of electrode of HVDC system, is easier suffering from DC bias. The transformers in the transmission line path, wh- ich connect the substation with higher earth potential and the substation with lower earth potential, might also suff- er from DC bias. Generally the substations far away from the electrode location, especially those that close to river or ocean are of the lower earth potential. The electrode
Table 3. Comparison between computation result and mea- suring data when XiAn HVDC system operated in GRM (600ADC current injected into the earth)
Name Modification factor Current (A) Measuring data (A)
QingYuan 0.63 0.58 3.0
KangLe 1.93 7.50 7.5
SanShui 2.16 2.41 3.0
XianXi 1.10 2.26 1.0
LuoDong 2.27 14.56 9.0
PaJiang 0.92 27.13 25.9 YingDe 0.95 7.92 12.0
ChongHua 0.90 13.17 12.9
BeiJiao 0.67 5.35 6.0
locations of the four HVDC projects in Guangdong province are illustrated in Figure 5.
For TianGuang HVDC system, LuoDong, SanShui, XianXi, GuoTang are close to the DC grounding elec-trode of TianGuang HVDC system. Because of the high amplitude earth potential of the above substations, the DC current through the transformers’ neutral are relative big by the monitoring data. Meanwhile the high earth potential at those substations leads to DC current goes through the transmission line to other substations with lower DC earth potential. Most of the transformers, which connected with the transmission lines of SanShui
→KangLe→QingYuan or LuoDong→HongXing→
ZiDong→XiJiang→FenJiang, are in DC bias. Another typical line is LuoDong→XiJiang→JiangMen→KaiPing
→TaiShan→TangMei, which begins from the substation near the HVDC grounding electrode and end at the sub-station near the coast of South China Sea. Especially TangMei near the coast suffered severe DC bias for the DC earth potential close to coast is near to zero.
There are 4 ± 500 kV HVDC systems which transmit power from western China to Guangdong power grid in 2008. When different HVDC system is in ground return mode, there is similar rule for the transformers which might be in dc-bias by the result of simulation and moni-toring measures.
From the rule of DC current distribution, we could find that the substations with higher induced dc earth potential should be installed the DCBD first when miti-gation of dc-bias is under schedule.
8. Conclusions
[image:5.595.57.286.606.722.2]1) Comparison between complex image method and B- EM shows BEM isn’t suitable for the solution of ground- ing problem in large scale complex geological condition for the limits of PC hardware. Although complex image method couldn’t take geological condition into account completely, proper choice for the soil structure and pa-rameter still could simulate the local geological condition precisely.
2) Utilizing the measuring data, the correction model was presented. This method is significant for the accu-racy improvement of simulations, such as changing of transmission line connection, or the effect evaluation of DCBD installation, etc.
3) When HVDC system is under ground return mode, the transformer, whose location is close to the ground electrode of HVDC system, is easier suffering from DC bias. Another case, the transformers which located far away from the ground electrode of HVDC system, with lower dc earth potential, especially those that close to river or ocean, and connected to the substation with higher dc earth potential might also easier suffer from DC bias.
4) The substations with higher induced dc earth poten-tial should be installed the DCBD first when mitigation of dc-bias is under schedule.
REFERENCES
[1] E. T. V. Jose and M. P. Carlos, “Calculation of Electric Field and Potential Distributions into Soil and Air Media for a Ground Electrode of a HVDC System,” IEEE Trans-actions on Power Delivery, Vol. 18, No. 3, 2003, pp. 867- 873.
[2] D. Kovarsky, L. J. Pinto, C. E. Caroli, et al., “Soil Sur-face Potentials Induced by ITAIPU HVDC Ground Re-turn Current Part I–Theoretical Evaluation,” IEEE Trans-actions on Power Delivery, Vol. 3, No. 3, 1988, pp. 1204- 1210.
[3] P. J. Lagace, J. L. Houle, Y. Gervais, et al., “Evaluation of the Voltage Distribution around Toroidal HVDC Ground Electrodes in N-Layer Soils,” IEEE Transactions on Power Delivery, Vol. 3, No. 4, 1988, pp. 1573-1579. [4] B. Zhang, J. Zhao, R. Zeng, et al., “Estimation of DC
Current Distribution in AC Power System Caused by HVDC Transmission System in Ground Return Status,”
Proceedings of the Chinese Society for Electrical Engi-neering, in Chinese, Vol. 26, No. 13, 2006, pp. 84-88. [5] Z. J. Cao, J. J. He, H. S. Ye, et al., “Method for the
Cal-culation of DC Current Distribution in AC System when HVDC Operating in Ground-Return Mode,” High Volt-age Engineering, in Chinese, Vol. 32, No. 10, 2006, pp. 82-84.
[6] Q. Liu, L. C. Li and J. C. Zheng, “DC Currents
Distribu-tion in HVDC Systems of Monopolar OperaDistribu-tion with Ground Return in Complex Soil Structure,” Proceedings of the Chinese Society for Electrical Engineering, in Chinese, Vol. 27, No. 36, 2007, pp. 8-13.
[7] China Southern Grid Technology Center, “Influence to AC System and Other Facilities by Ground Return Cur-rents of HVDC and the Study of Preventive measures,”
Project Research Report, Electrical Engineering Depart-ment of Tsinghua University, Beijing, 2005.
[8] Q. Liu, “Study on Ground Currents Distribution while HVDC Mono-Polar is Operating,” Chinese Dissertation Abstracts Database, Tsinghua University, Beijing, 2007. [9] J. J. He, H. S. Ye, F. C. Lin and H. Li, “HVDC Influence
of Soil Structure on Surface Potential and Ground Cur-rents Distribution while HVDC Mono-Polar Operation with Ground Return,” Southern Power System Technol-ogy, Vol. 1, No. 1, 2007, pp. 20-36.
[10] H. S. He, “Computational Method Study on DC Current Distribution in AC System when HVDC Operating in Ground-Return Mode. Power Technology Development and Energy Conservation,” The 9th Symposium on Youth Essays in Chinese Society for Electrical Engineering, November 2006.
[11] Z. Q. Ma, X. L. Li and D. Z. Zhang, “Network Algorithm to Analyze Effects of DC Transmission Ground Current on AC System,” Guangdong Electric Power, in Chinese, Vol. 18, No. 12, 2005, pp. 4-8.
[12] Q. Liu, L. C. Li and J. C. Zhen, “Study on DC Current through Transformer Neutrals Caused by Ground Return Operation Mode of HVDC System with Sea Influence Considered,” Power System Technology, in Chinese, Vol. 31, No. 2, 2007, pp. 57-60.
[13] J. Zhao and B. Zhang, “Analysis on Influence of Ground Electrode Current in HVDC on AC Power Network,”
Power System Technology, in Chinese, Vol. 29, No. 19, 2005, pp. 60-64.
[14] J. M. Lu, D. Xiao, C. X. Mao, et al., “Analysis of Effects of DC Earthed Pole on Earth Surface Potential Distribu-tions,” High Voltage Engineering, in Chinese, Vol. 32, No. 9, 2006, pp. 55-58.