1 TITLE
1
A multilevel society of herring-eating killer whales indicates adaptation to prey characteristics
2
3
Sara B. Tavaresa,*, Filipa I. P. Samarraa,b, Patrick J.O. Millera
4
aSea Mammal Research Unit, Scottish Oceans Institute, University of St Andrews, St
5
Andrews, Fife KY16 8LB, United Kingdom
6
bMarine Research Institute, Skulagata 121, Reykjavik, Iceland
7
*Address for reprint requests and correspondence: Sara B. Tavares, Sea Mammal Research
8
Unit, School of Biology, University of St Andrews, Bute Building, St Andrews KY16 9TS,
9
Scotland, United Kingdom. Telephone: +44 01334 463607. E-mail address:
sbt3@st-10
andrews.ac.uk.
11
12
RUNNING TITLE 13
Multilevel society of herring-feeding killer whales
14
15
ABSTRACT 16
Non-social factors can influence animal social structure. In killer whales (Orcinus orca), fish-
17
vs. mammal-eating ecological differences are regarded as key ecological drivers of their
18
multilevel society, including group size, but the potential importance of specific target prey
2
remains unclear. Here, we investigate the social structure of herring-eating killer whales in
20
Iceland and compare it to the described social structures of primarily salmon- and seal-eating
21
populations in the Northeast Pacific, which form stable coherent basic units nested within a
22
hierarchical multilevel society. Using 29023 photographs collected over 6 years, we examined
23
the association patterns of 198 individuals combining clustering, social network structure and
24
temporal patterns of association analysis. The Icelandic population had largely weak but
non-25
random associations, which were not completely assorted by known ranging patterns. A
26
fission-fusion dynamic of constant and temporary associations was observed but this was not
27
due to permanent units joining. The population-level society was significantly structured but
28
not in a clear hierarchical tier system. Social clusters were highly diverse in complexity and
29
there were indications of subsclusters. There was no indication of dispersal nor strong sex
30
differences in associations. These results indicate that the Icelandic herring-eating killer whale
31
population has a multilevel social structure without clear hierarchical tiers or nested coherent
32
social units, different from other populations of killer whales. We suggest that local ecological
33
context, such as the characteristics of the specific target prey (e.g. predictability, biomass and
34
density) and subsequent foraging strategies may strongly influence killer whale social
35
association patterns.
36
Key words: ecological context, hierarchical structure, multilevel societies, social structure,
37
killer whale, orca
3 INTRODUCTION
39
The sociality of a group-living species is driven by a trade-off between its specific ecological,
40
evolutionary and social contexts (Krause and Ruxton 2002). Non-social factors, particularly
41
predation risk, finding/catching food, defending resources and resource patchiness, can
42
strongly determine the social structure of simple social systems and provide the context for
43
the development of complex ones (Jarman 1974; Wrangham 1980; Whitehead 2008a).
44
General socioecological frameworks have been developed for various taxa, characterizing
45
how such factors can affect sociality by using broad characteristics of a species/genera, such
46
as occurrence of group foraging, group size or mating system (Emlen and Oring 1977;
47
Wrangham 1980; Gowans et al. 2007). However, with the increase of within-species studies
48
(e.g. Barton et al. 1996, Sinha et al. 2005; Whitehead et al. 2012), it seems clear that it is
49
important to emphasize intraspecific variation which likely reflects variability under different
50
ecological conditions. Investigating different populations of the same species across
51
ecological gradients is therefore valuable to evaluate the influence of ecological drivers.
52
Multilevel societies are among the social systems found on group-living species and have
53
been described as hierarchical structures of nested social levels (i.e. discrete social
54
stratification of associations among individuals into tiers) with at least one stable core unit
55
(Wittemyer et al. 2005; Grueter, Matsuda, et al. 2012; Grueter, Chapais, et al. 2012).
56
Recently, de Silva and Wittemyer (2012) suggested that multilevel societies should be seen
57
along a continuum of nestedness and that some might present less clearly hierarchically
58
stratified social levels that transition more gradually. Commonly, multilevel societies exhibit
59
fission–fusion dynamics, with frequent association, disassociation, and reassociation of
4
groups of individuals (e.g. Connor et al. 1992). Although multilevel societies have been
61
studied more extensively in terrestrial mammals, particularly in primates (see Grueter,
62
Chapais, et al. 2012), such social systems are also observed in cetaceans and intraspecific
63
variation has been reported (Connor et al. 1998; Whitehead et al. 2012). For example, female
64
sperm whales (Physeter macrocephalus) form long-term stable social units which, in the
65
Pacific, temporarily group with other units with which they share part of the acoustic
66
repertoire, but rarely group in the North Atlantic, possibly due to differences in predation risk
67
(Whitehead et al. 2012).
68
One well-described tiered multilevel society among cetaceans is that of the ‘resident’
fish-69
eating killer whale (Orcinus orca) population in the Northeast Pacific, hereafter termed
70
residents. The basic unit of this society is the matriline, consisting of an oldest surviving
71
female and her philopatric descendants, remaining associated with their mother for life (Bigg
72
et al. 1990; Baird and Whitehead 2000; Barrett-Lennard 2000). Within matrilineal units,
73
individuals associate strongly and at very similar levels, while matrilineal units can frequently
74
interact (Bigg et al. 1990; Baird and Whitehead 2000; Ford et al. 2000). Matrilines that share
75
at least part of their acoustic repertoire, probably due to common maternal ancestry, form the
76
next social level, the clan (Ford 1991). Different clans have no calls in common, and
77
matrilines from the same or different clans frequently travel together (Ford 1991). The next
78
and broadest social level (just under population) is the community, consisting of matrilines
79
that share a common area and associate periodically but not with those of another community
80
(Bigg et al. 1990). This multilevel society is based on distinct fission-fusion patterns of whole
81
coherent family-based units, where stable matrilineal units collectively associate more
5
frequently with other close kin units. The ‘sub-pod’ and ‘pod’ were traditionally considered
83
intermediate social levels between the matriline and the clan, consisting of matrilines with
84
recent maternal ancestry that often (> 95% and 50% of the time, respectively) travelled
85
together (Bigg et al. 1990; Ford 1991). However, recent studies have shown fluctuations in
86
the reoccurrence of associations between matrilines (Ford and Ellis 2002; Parsons et al. 2009),
87
as well as changes in the pods originally described (Ford et al. 2000), leading to suggestions
88
that the term ‘pod’ should only be used to designate aggregations of killer whales or as a
89
synonym for matriline (Ford and Ellis 2002).
90
Intraspecific variation in sociality among killer whales is believed to relate to prey-type.
91
Northeast Pacific resident killer whales mainly prey on salmon, especially Chinook
92
(Oncorhynchus tshawytscha) while mammal-eating killer whales (also referred to as
93
‘transients’ or Bigg’s killer whales) feed on marine mammals, especially harbour seals (Phoca 94
vitulina; Ford et al. 1998). Although sympatric, these two populations comprise two specialist
95
ecotypes that are socially and reproductively segregated (Bigg 1982; Barrett-Lennard 2000).
96
Both ecotypes exhibit coherent and stable matrilineal social units based on long-term kinship
97
associations but there are important distinctions between their social strategies. The resident
98
population forms larger matrilineal units than the mammal-eating population and while the
99
resident population is philopatric, there is some level of adult dispersal in the mammal-eating
100
population (Bigg et al. 1990; Baird and Whitehead 2000). For example, males may disperse to
101
briefly associate with other matrilines or live alone, randomly associating with other adult
102
males. Moreover, some females may disperse from the matriline and stay socially mobile,
103
associating strongly for short periods with different groups (Baird and Dill 1996; Baird and
6
Whitehead 2000). This variation is considered to be due to the different foraging strategies of
105
the populations. Hunting marine mammal prey in large groups incurs greater costs by
106
increasing the probability of detection by the prey. Furthermore, the optimal energetic intake
107
for mammal-eating killer whales (preying upon medium-sized seals) declines for groups
108
larger than 3 individuals (Baird and Dill 1996). In contrast, resident killer whales spread out
109
and coordinate to locate salmon (Ford et al. 2000), potentially benefiting from larger group
110
sizes. With little or no predation risk, populations of this species apparently refine their social
111
systems primarily in relation to foraging efficiency, particularly availability of resources and
112
competition for those resources.
113
In the North Atlantic, the only published study addressing sociality found greater similarities
114
between the Scottish mammal-eating population and Northeast Pacific mammal-eating
115
population relative to residents, despite greater phylogenetic distance, suggesting that ecology
116
drives sociality more than phylogenetic inertia does (Beck et al. 2012). The study included a
117
limited dataset from Icelandic herring-eating killer whales and their social structure was not
118
explored in detail. However, the study’s hierarchical display of associations suggested that
119
social tiers were not clearly defined in this population and that associations at a variety of
120
strengths existed. These features were not further addressed, nevertheless the study concluded
121
that the Icelandic fish-eating population is probably more similar to the Northeast Pacific
122
resident population than to mammal-eating populations.
123
Icelandic killer whales are believed to mainly prey upon Atlantic herring (Clupea harengus)
124
and follow the Icelandic summer-spawning (ISS) herring stock during its yearly migration
125
(Sigurjónsson et al. 1988) between overwintering, feeding and spawning grounds (Óskarsson
7
et al. 2009). Unlike the salmon prey of resident killer whales, herring form large and dense
127
schools as an antipredator strategy (Nøttestad and Axelsen 1999) and killer whales feeding on
128
herring schools use a coordinated group feeding strategy, encircling their prey to herd and
129
capture it (Similä and Ugarte 1993). Feeding aggregations of killer whales are very common
130
in Iceland, making it difficult to discern isolated groups and confusing the determination of
131
associations in the field (Sigurjónsson et al. 1988; Beck et al. 2012). In addition, herring can
132
undergo large variations in abundance and migration routes (Jakobsson and Stefánsson 1999;
133
Óskarsson et al. 2009) making it a changeable food resource. In fact, recent research suggests
134
not all individuals specialize on ISS herring and follow it year-round. Other killer whales
135
observed only in one season or seasonally moving between Iceland and Scotland exhibited
136
wider trophic niche width, suggesting diversity in foraging strategies (Samarra and Foote
137
2015; Samarra et al., in press; FIP Samarra et al. in prep).
138
In this study we investigate the social structure of herring-eating killer whales in Iceland,
139
based upon patterns of association between photo-identified individuals in spawning and
140
overwintering grounds. We relate our results to the described societies of killer whales in the
141
Northeast Pacific. Specifically, we investigate: 1) the degree and diversity of associations
142
between pairs of individuals; 2) whether social structural units of individuals exist and are
143
hierarchically nested in the social structure; 3) how associations persist or change over time in
144
the population and depending on age-sex class and; 4) whether variations in movement and
145
feeding strategy within the Iceland killer whale population influence sociality by promoting
146
social segregation. Given the differences in historical availability, migration patterns, and
147
anti-predator strategies of herring, salmon and seals, we hypothesize that broad ecology (fish-
8
vs. mammal-eating) alone cannot explain sociality and that local ecological conditions, such
149
as characteristics of prey schools and associated foraging strategy of the population, might
150
also strongly shape the social structure of killer whales.
151
152
METHODS 153
Data collection 154
Photographs of killer whales were collected in July 2008-2010 and 2013-2015 in
155
Vestmannaeyjar (South Iceland), a spawning ground of ISS herring, and in February-March
156
2013-2014 and mid-February to mid-March 2015 in Grundarfjörður and Kolgrafafjörður
157
(West Iceland), two fjords that were part of the ISS herring overwintering grounds. During
158
daylight hours, when killer whales were encountered, groups were approached and
159
photographs of all individuals surfacing together were taken using a variety of digital
single-160
lens reflex cameras with telephoto lenses. On several occasions, more than one
161
photographer/camera was used. Sampling effort varied across years and seasons, due to
162
weather conditions, research effort priorities, and the number of research vessels used (Table
163
1). In the winters of 2014-2015 a whale-watching platform was also used. Due to the inherent
164
difficulty in approaching and photographing all individuals from whale watching platforms,
165
only encounters when coverage of the groups present was considered complete (i.e. all
166
individuals in the group were identified) were included in the analysis.
167
168
9
Killer whales were individually identified based on the size and shape of the dorsal fin,
170
patterns of the saddle patch and natural markings, such as nicks and scars, using left-side
171
pictures (Bigg 1982). For young animals without distinct natural markings, the eyepatch was
172
also used for identification across seasons/years. The quality of photographs was judged based
173
upon focus, contrast, angle and overall quality assessment (adapted from Friday et al. 2000).
174
Only high and medium quality photographs were used. To avoid false positives, matches were
175
confirmed if 3 distinct features of the individual were unambiguously identified.
176
To differentiate sex and stage of maturity four different categories were used: (1) Adult males
177
– adults that have reached sexual maturity and present distinguishable taller dorsal fin; (2)
178
Adult females – mature size individuals, with relatively smaller dorsal fin, seen during the
179
study period either consistently with a calf in echelon position, or without developing dorsal
180
fin for at least 3 years, or that were matched to a preliminary catalogue from the Marine
181
Research Institute including photos taken between 1981 and 2007, without developing dorsal
182
fin; (3) Juveniles – identifiable individuals > 1 year old that have not reached mature size
183
(both sexes); (4) Other – whales of apparently larger size than juveniles but for which sex and
184
stage of maturity were impossible to determine.
185
Individuals that were only sighted in the summers of 2008-2010 were excluded from the
186
analysis to reduce bias resulting from including individuals that may have died during the first
187
years of the study and reduce the possibility of incomplete group coverage data from
188
fieldwork where photographic data collection was opportunistic. This procedure excluded 25
189
individuals from the study.
190
10 Association criterion
192
Due to the common observations of aggregations of individuals in Iceland (Sigurjónsson et al.
193
1988; Beck et al. 2012), spatiotemporally isolated groups in the field are unclear and it is
194
difficult to rigorously define a group. Despite this, the way in which animals are
195
photographed is related to their inherent social structure, as animals that prefer to associate
196
will undoubtedly be photographed together or in close proximity more often (Bigg et al.
197
1990). Using the capture time recorded in each photograph’s metadata, we can discriminate
198
animals surfacing together in close proximity, since they are photographed within a very short
199
time frame. Individuals were considered associated for the day (sampling period) if
200
photographed by the same camera/photographer within 20 seconds. This value was
201
quantitatively derived by maximum likelihood estimation of photographic bouts (Langton et
202
al. 1995; Luque and Guinet 2007; see Supplementary Material S1). The association criterion
203
matches our field observations that groupings of adjacent associated animals tended to surface
204
(and be available for photographing) close in time to each other and within 20 seconds,
205
whereas non-contiguous animals were generally only available for photographing after a
206
longer time had passed. Shorter and longer temporal association criteria (5 seconds and 1
207
hour, respectively) were used to test the robustness of the observed association patterns to the
208
temporal criterion used (Supplementary Material S2). These analyses suggested that the
209
association criterion value used in the study is likely meaningful to describe the animals’
210
social structure and appropriate to capture important associates without overloading the
211
analysis with random associations.
212
11 Analysis of associations
214
Only individuals seen on at least 5 different days were included in the analysis of
215
associations. This value is recommended by Whitehead (2008) as a minimum cut-off and it is
216
a more conservative restriction than several other studies (e.g. minimum cut-off of 4
217
sightings: Ottensmeyer and Whitehead 2003; Tosh et al. 2008; Beck et al. 2012; Esteban et al.
218
2016). We explored the consistency of the results under more restrictive thresholds (≥ 10 days
219
and ≥ 20 days; see Supplementary Material S3). Due to similarity in the obtained results and
220
the fact that restricting the criterion for inclusion to a minimum of 5 sampling periods
221
significantly increased the number of individuals included in the analysis, this was considered
222
an appropriate threshold to describe the population dynamics of this social system.
223
All analyses described below were conducted using SOCPROG 2.6 (Whitehead 2009) in
224
MatLab 8.5 (MathWorks, Natick, MA, U.S.A.), except where noted. To quantify associations
225
between pairs of individuals we calculated the half-weight index (HWI), which estimates the
226
proportion of time individuals spend together: HWI = 2AB/(A + B), where AB is the number
227
of times individuals A and B were identified associating with each other, and A and B are the
228
total number of times each individual was identified (Cairns and Schwager 1987; Whitehead
229
2008a). This symmetric association index was chosen since it minimizes sampling bias when
230
some individuals present were missed. This index was calculated per season (summer and
231
winter) and overall.
232
We used a permutation test, permuting the associations within samples (days), to test whether
233
associations in the population were different from random, with the null hypothesis that
234
between sampling periods there are no preferred/avoided associations (Bejder et al. 1998;
12
Whitehead 2008a). This test reveals whether or not an observed social structure is only due to
236
properties of the dataset used (e.g. the size of aggregations of individuals and the number of
237
encounters or sampling periods) when the associations are not different from random. The
238
association matrix was permuted 10000 times, when the P value stabilized, with 1000 trials
239
(inversion of part of the matrix of associations) per permutation. The random data obtained by
240
this process were also used in the temporal analysis of associations.
241
To measure how diverse the associations were, we calculated the social differentiation (S) of
242
the population. Social differentiation is the estimated coefficient of variation of association
243
indices of the population. If S is close to 0, the associations are very homogenous, and if S >
244
1.0 the relationships are very diverse across dyads of animals (Whitehead 2008a; Whitehead
245
2009). The social differentiation was calculated using the likelihood method described by
246
Whitehead (2008b), with non-parametric bootstrap for calculating its standard error (SE) and
247
sampling periods chosen randomly for each of 1000 bootstrap samples.
248
249
Hierarchical stratification 250
Hierarchical clustering analysis using a dendogram display (tree diagram where individuals
251
are represented by nodes and the branching pattern represents the degree of associations) have
252
been used to visualize and interpret the social structure of killer whale populations (e.g. Bigg
253
et al. 1990; Baird and Whitehead 2000; Beck et al. 2012). This agglomerative technique
254
imposes a model where the social structure of the population is hierarchically structured: basic
255
social units (permanent or semipermanent social entities at high association values) are nested
13
within larger social units (permanent or semipermanent social entities –‘tiers’ (Wittemyer et
257
al. 2005) - at low association values) in a stratified fashion (Whitehead 2008a; Whitehead
258
2009).
259
To investigate whether or not the Icelandic population exhibits clear hierarchical stratification
260
we combined the quantification of the distribution of HWI along with a hierarchical display of
261
associations and a visual exploration of the stratification of the population. We displayed
262
associations as a dendogram, using the average-linkage clustering method. To identify the
263
association index at which significant divisions within the population occurred we used
264
modularity, defined by Newman (2004), controlling for differences in gregariousness
265
(‘Modularity-G’; Lusseau 2007; Whitehead 2008a). To identify the degree of possible
266
stratification among individuals we explored the fragmentation of the population’s social
267
network across lower values of HWI. We displayed the associations between individuals as a
268
social network, where nodes represent individuals and edges (links) between nodes represent
269
an existing association. Then, we sequentially removed edges in the population with
270
increasing HWI values to visualize the fragmentation of the network at each level, and
271
removed isolated (unconnected) nodes from the display for clarity. This was performed in R
272
3.2.3 (R Core Team 2015) using the package igraph (Csardi and Nepusz 2006).
273
274
Non-hierarchical structure and movement pattern assortative mixing 275
We used Newman’s (2006) eigenvector-based clustering method to detect social clusters
276
within the population. This clustering technique sequentially divides the population into
14
successive clusters and does not assume a hierarchical association between individuals.
278
Maximum modularity (Q) values higher than 0.3 describe a good division of the population
279
into clusters (Newman 2004). We described the composition, mean and maximum HWI,
280
movement pattern of adults and social differentiation (with and without juveniles) of each
281
cluster obtained by the division. The Pearson correlation test, calculated in MatLab 8.5
282
(MathWorks, Natick, MA, U.S.A.), was used to test for correlation between social
283
differentiation and cluster size, with and without juveniles. Associations for each cluster were
284
displayed as sociograms (circular network diagrams), created in in R 3.2.3 (R Core Team
285
2015) using the package igraph (Csardi and Nepusz 2006). To study the possible substructure
286
within clusters we applied Newman’s (2006) eigenvector-based clustering method to each
287
cluster individually.
288
We investigated whether the different movement pattern of individuals determined
289
association patterns by examining the assortative mixing in the population, i.e. the tendency
290
for individuals with the same movement pattern to preferentially associate, using Newman’s
291
(2002) assortativity coefficient (r). Three different broad movement patterns were considered
292
based on individual sighting history (as in FIP Samarra et al. in prep): (1) only identified in
293
the winter season, (2) only identified in the summer season, (3) identified on both winter and
294
summer seasons. This coefficient ranges from zero to one and high values of r indicate higher
295
assortativity of the population, i.e. individuals associate only with others of the same ‘type’.
296
The assortativity coefficient was calculated in R 3.2.3 (R Core Team 2015) using the package
297
assortnet (Farine 2014), for the whole population with and without juveniles, to account for
15
the possibility of juveniles only being identified later in the study period. The SE was
299
calculated using the jackknife method described by Newman (2003).
300
301
Temporal patterns of associations 302
To investigate how associations changed over time we calculated the standardized lagged
303
association rate (SLAR). All individuals, regardless of sighting frequency, were used in this
304
analysis to avoid positive bias (Whitehead 2008a). The SLAR is the estimate of the
305
probability that if two individuals are associated after a specified lag, the second individual is
306
a randomly chosen associate of the first (Whitehead 1995; Whitehead 2008a). Standard errors
307
were calculated using a temporal jackknife procedure with 15 day periods of data being
308
omitted in turn (Whitehead 1995; Whitehead 2007). To categorize how the relationships
309
between individuals changed over time, four different theoretical exponential models were
310
fitted (by maximum likelihood and binomial loss) to the full data set. The models are based in
311
the presence/absence of constant and temporary associations (Whitehead 2008a). The model
312
that best fitted the data is indicated by the lowest quasilikelihood Akaike information criterion
313
(QAIC, Whitehead 2007). The difference between the QAIC of the best model and other
314
models (ΔQAIC) indicates the degree of support for the less favored models: differences 0-2
315
indicating substantial support, 4-7 indicating less support and > 10 indicating essentially no
316
support for the alternative models (Burnham and Anderson 2002). Starting values of the
317
parameters for all models were obtained from the estimated parameters of the best-fitted
318
model in a preliminary fitting (with initial values of all parameters set to 0.5). The jackknife
319
method gives standard errors for the parameters of the model and for measures of social
16
structure estimated from them: typical group size (as in Jarman (1974), number of associated
321
individuals in groups, including the individual itself) and typical unit size (number of
322
individuals in permanent units), considering the case where permanent units temporarily
323
group (Whitehead 2008a).
324
325
Sex differences in association patterns 326
Differences in patterns of association by sex were investigated as in Baird and Whitehead
327
(2000). The mean and maximum HWI within and between sexes were calculated for adults of
328
known sex (Females and Males) seen on 5 or more days. The mean HWI between A-B is an
329
estimate of the probability of a random individual of category A associating with any
330
individual of category B at any sampling period, so it is insensitive to different numbers of
331
individuals in different categories (Baird and Whitehead 2000). The maximum HWI of A-B is
332
the average maximum of association indices between each individual from category A and
333
any individual from category B. We tested the null hypothesis that associations between and
334
within sexes are similar using a Mantel test where associations between categories were
335
permuted 5000 times (Schnell et al. 1985). Variation in temporal patterns of associations were
336
analyzed using the SLAR for associations between all adults of known sex (Females and
337
Males) to avoid positive bias of the SLAR.
338
339
17
Mixing within aggregations of resident killer whales have been noted to differ between males
341
and females: adult males can temporarily travel away from their matrilines, possibly for
342
mating purposes (Bigg et al. 1990; Barrett-Lennard 2000), but adult females generally stay in
343
their matrilineal units, which are spatially dispersed, particularly during foraging (Ford 1989).
344
We therefore separately examined the associations only between the most frequently
345
encountered adult females in the study, as they may show higher levels of association within
346
groups and a more clearly defined tier structure than observed in the overall population. This
347
analysis was performed using 2 restricted datasets: 1) adult females encountered on more than
348
10 days and at least in 3 different years; 2) adult females encountered on at least 20 days and
349
at least in 3 different years. Permutation tests and dendograms were performed as described
350
above, for both datasets. Associations between females were displayed in a sociogram created
351
in R 3.2.3 (R Core Team 2015) using the package igraph (Csardi and Nepusz 2006).
352
353
RESULTS 354
314 individuals (88 adult males, 94 adult females, 59 juveniles and 73 others) were identified
355
in a total of 29023 photographs taken on 110 different days. The mean ± standard deviation
356
(SD) number of individuals identified per day was 25.1 ± 20.6 individuals (range = 1-121
357
total identifications per day).
358
359
18
198 individuals (56 adult males, 69 adult females, 41 juveniles and 32 others) were identified
361
on at least 5 days (mean of 12.6 ± 7.1 days, range of 5-38 days) and used in the analysis of
362
associations. 51 were only sighted in the winter season (including 8 juveniles), 32 only in the
363
summer season (including 11 juveniles), and 115 on both seasons (including 22 juveniles).
364
Most individuals were seen in several years (mean ± SD of 3 ± 1.5 years, range of 1-6
365
different years).
366
The mean HWI of the population was low (mean ± SD = 0.02 ± 0.01, non-zero HWI mean ±
367
SD = 0.18 ± 0.19). Regardless of the season, the distribution of non-zero HWI values
368
observed showed a high proportion of low level associations and relatively fewer strong ties
369
at high HWI values (Figure 1). More than half of the pairs of associations were lower than 0.1
370
(51.4%, 1161 dyads). Only 9.9% (224 dyads) of the associations had HWI ≥ 0.5 (individuals
371
associated more than half of the time). This was the value used by Baird and Whitehead
372
(2000) to define matrilines in the Pacific mammal-eating population and by Bigg et al. (1990)
373
to define pods of matrilines that frequently associated. Only 0.9% of the associations (21
374
dyads) were higher than 0.8, the value used by Beck et al. (2012) to define primary social
375
tiers, equivalent to matrilines.
376
The SD and coefficient of variation (CV) of association indices were significantly higher in
377
the real dataset than in the permuted data (real SD = 0.09, random SD = 0.05, P=0.0001; real
378
CV = 4.12; random CV = 2.59; P = 0.0001). Hence, we could reject the null hypothesis that
379
individuals associated randomly. The social differentiation of the population was close to 1 (S 380
± SE = 0.98 ± 0.03), revealing a highly diverse range of associations within the population.
19 382
Hierarchical stratification 383
Applying the hierarchical dendogram display (cophe
384
netic correlation coefficient [CCC] > 0.8; Figure 2), social clusters diverged at an extremely
385
low association index value (HWI of 0.02, maximum modularity of 0.68). The knot diagram
386
presented an apparent constant rate of cumulative bifurcations, which only slightly increased
387
at very low association indices. This pattern was still visible using a very restrictive
388
association criterion (Figure S3 in Supplementary Material S2). The network of associations
389
was more interconnected at low HWI thresholds (Figure 3). However, without a larger
390
number of strong bonds the network started to fragment very quickly when links were
391
sequentially removed at low HWI thresholds. The network contained few stronger ties, as is
392
visible when HWI = 0.5, with very small sets differentiated and individuals detached from the
393
network. Associations in the Icelandic killer whale population did not appear to be clearly
394
stratified into hierarchical tiers. Considering the wide range of association levels present, this
395
does not mean that individuals only associate with a small set of companions.
396
397
Examination of structure and movement pattern assortative mixing 398
Using Newman’s (2006) clustering technique, the population could be significantly divided in
399
18 distinct clusters (Table 2; Q = 0.66). The social clusters obtained in the analysis were of
400
mixed sex-age classes. The cluster sizes varied between 3 and 33 individuals, with a mean ±
401
SD of 11 ± 7.8 individuals per cluster. As expected, mean HWI within clusters was higher
20
than between clusters (within clusters mean HWI ± SD = 0.27 ± 0.17 and maximum HWI ±
403
SD = 0.65 ± 0.17; between clusters mean HWI ± SD = 0.01 ± 0.01 and maximum HWI ± SD
404
= 0.01 ± 0.06). The assortativity coefficient of the network indicated some level of separation
405
of associations according to movement pattern (including juveniles r ± SE = 0.44 ± 0.01; not
406
including juveniles r ± SE = 0.49 ± 0.01) but much lower than would be expected if
407
individuals favored associations with others of equal movement pattern and/or avoided
408
associations with individuals with a different movement pattern. In fact, not all clusters were
409
discriminated by movement pattern: 5 clusters were composed of a mix of individuals sighted
410
in both seasons and individuals sighted in a single season.
411
Clusters were highly variable in their complexity (Table 2). There was a wide range of values
412
of social differentiation by cluster (with juveniles mean ± SE = 0.52 ± 0.1, min-max: 0-1.15;
413
without juveniles mean ± SE = 0.49 ± 0.1, min-max: 0-1.17). The Pearson’s correlation test
414
showed that social differentiation was significantly correlated with unit size (with juveniles r
415
= 0.68, P = 0.002; without juveniles r = 0.62, P = 0.006). Within larger clusters not all
416
associations were strong (representing high social preference) or weak, and members
417
associated at many different degrees. In general, only a few individuals within each cluster
418
maintained strong associations (> 0.5 or 0.8) with other members and only 5 clusters had a
419
mean HWI > 0.5. From the measures of social structure, inspection of photographs and direct
420
observations we concluded that we were not able to identify all companions of the members
421
of cluster F. This cluster was most likely incomplete and therefore was not included in further
422
descriptions.
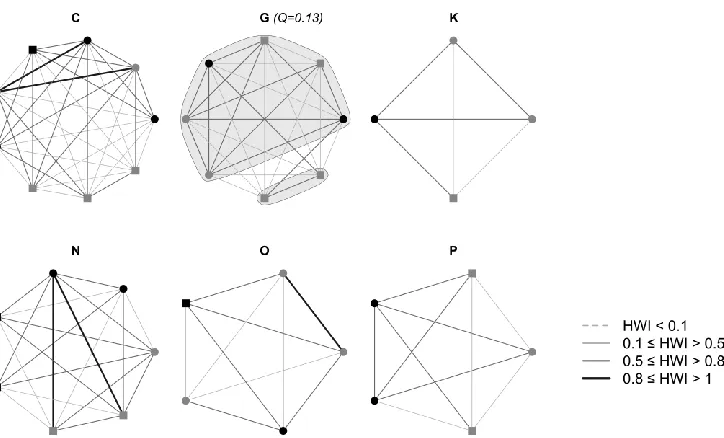
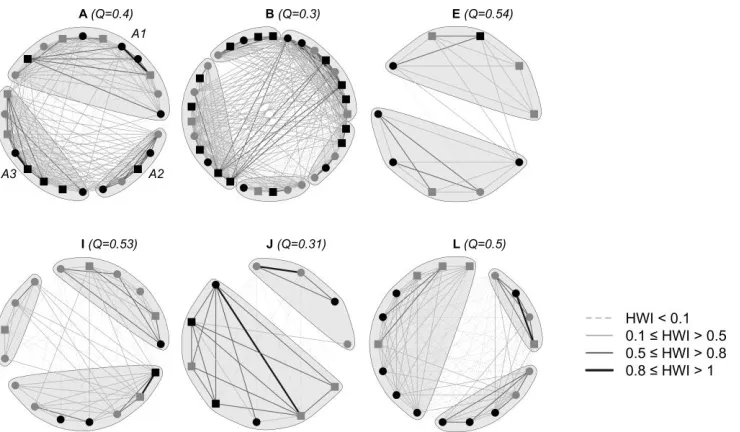
21
Our analysis distinguished three types of social clusters in the population: stable (C, G, K, N,
424
O and P; Figure 4), intermediate complexity (D, H, M, Q and R; Figure 5) and complex (A, B,
425
E, I, J and L; Figure 6) clusters. Stable clusters had high mean HWI values, very low social
426
differentiation and members with equal movement pattern. Only in cluster G two juveniles
427
were subclustered with a very low modularity value, likely because they were born during the
428
study period and only identified later in the study. Therefore, these clusters had no apparent
429
substructuring and associations between members were generally more homogeneous but not
430
equal.
431
Intermediate complexity clusters had intermediate values of mean HWI and social
432
differentiation, showing potential but unclear subclustering (Q values generally < 0.3), since
433
individuals across potential subclusters also associated very frequently. In general, cluster
434
members had equal movement patterns, except for one cluster.
435
Complex clusters had very high values of social differentiation and very low mean HWI, but
436
high maximum HWI. In general, cluster members had different movement patterns, except for
437
two clusters. Complex clusters showed potential substructuring, although this was not clear
438
for all clusters (Q values of about 0.3 for cluster B and J). Associations between members of
439
complex clusters were diverse and only some members maintained strong associations, with
440
most associations being lower and at varying levels.
441
442
22
The standardized lagged association rate SLAR (𝑔′()) remained higher than would be
444
expected from random associations over the investigated time periods (; Figure 7), indicating
445
that non-random associations persisted over time.
446
The two more complex models presented a reasonable fit to the data (see Supplementary
447
Material S4). The model SLAR3, labelled as ‘constant companions plus casual acquaintances’
448
in Whitehead (2008a), had the lowest QAIC value, fitting the data best. Adding a second level
449
of dissociation (SLAR4), gave a similar curve and a very small difference of QAIC to SLAR3
450
indicating some support for this model. However, contrary to SLAR3, there was no
451
convergence and stable fit of SLAR4 when varying the parameters start values, which raised
452
doubt on the suitability of this model for the data. For this reason the simpler model SLAR3,
453
which has lowest QAIC and consistent parameters, was chosen to describe the temporal
454
patterning of associations. This model indicated that the population was driven by a
455
combination of longer-term relationships that last for many years, and temporary associations:
456
𝑔′(𝑡) = 0.06 + 0.02𝑒−0.0486𝑡. Temporary associations decayed exponentially, with the model
457
suggesting important dissociations over scales of about 21 days (0.0486/days, SE = 0.09). The
458
proportion of long-term associations was 77%, with only 23% of temporary relationships.
459
This model’s fit estimated a typical group size of 14.8 individuals (SE = 2.5) and a typical
460
unit size of 11.7 individuals (SE = 3.4).
461
462
23
125 adults of known sex seen on 5 or more days were used in this analysis. Association levels
464
within and between adult sex classes were similar, with low mean association indices and
465
high maximum association indices (Table 3). The Mantel test did not reveal clear significant
466
differences in association between, relative to within adult sex classes (permutation test, P =
467
0.05). If the analysis was restricted to 75 adults of know sex seen on more than 10 days there
468
was no significant difference in association (permutation test, P = 0.13). The temporal
469
analysis suggests that Female-Male, Male-Male and Female-Female associations were
470
somewhat stable across time and remained higher than random (Figure 8). For all types of
471
associations, the SLAR was higher than the SLAR between all individuals (higher probability
472
of association). In general, all SLAR were relatively stable over time and no sex difference
473
was noticeable.
474
475
Adult female-specific analysis 476
32 adult females were sighted on more than 10 days over at least 3 years and only 12 of those
477
were sighted on at least 20 days over at least 3 different years (Table 4). On both restriction
478
conditions, associations were non-random (32 females: real SD = 0.11, random SD = 0.08, P
479
= 0.0001 and real CV = 2.33, random CV = 1.72, P = 0.0001; 12 females: real SD = 0.17,
480
random SD = 0.14, P = 0.0001 and real CV = 1.51, random CV = 1.31, P < 0.0001). The
481
classical hierarchical clustering technique displayed dendograms with a varying level of
482
associations between females, with significant clusters discriminated at low HWI values (see
483
Table 4 and Supplementary Material S5). Although the cluster discrimination occurs at a
484
higher HWI value for the set of females with the more restrictive observational threshold, it is
24
still a low value and mostly weak associations are present within the discriminated clusters.
486
The sociogram showed that, regardless the observational threshold, associations between
487
females are mainly weak even between most females from the same cluster (Figure 9). Also,
488
there are several weak associations between females from many different clusters.
489
490
DISCUSSION 491
Our results showed that associations within the Icelandic population of herring-eating killer
492
whales were non-random but the number of strong associations was small. Although the
493
dendogram display of associations presented a high cophenetic correlation coefficient, social
494
clusters were differentiated at extremely low levels of association. With this technique,
495
individuals were clustered together also by least preferred associations, i.e. weaker
496
associations at very low HWI values, since not all individuals associated strongly within
497
social units.
498
In a hierarchically structured society, transitions between structural tiers are clear because
499
individuals within a social cluster (nested in a tier) associate more strongly than individuals
500
within clusters at the level above. Societies without hierarchical nesting can still display a
501
dendogram with a cophenetic correlation coefficient > 0.8, indicating an acceptable match to
502
the matrix of association indices (Bridge 1993), while being an inappropriate way of
503
realistically displaying associations (Whitehead 2008a; Whitehead 2009). When individuals
504
associate weakly overall the degree of potential hierarchical stratification is limited since an
505
individual cannot represent its social unit because associations within a social unit are not
25
equally strong. Our study showed this to be the case in this population. Thus, a non-stratified
507
way of studying the society was considered more appropriate than techniques that assume a
508
hierarchically-organized social structure.
509
The population could be significantly divided into social clusters, which were highly diverse
510
in complexity (even when using a more restrictive observation threshold; Supplementary
511
Material S3 – Figure S10). A small portion of the clusters presented more coherent
512
associations between members, which might represent cohesive basic structures. The majority
513
of the clusters presented diverse association strengths and potential further subclustering. In
514
some social clusters, many individuals did not strongly associate with all other members. This
515
population presented both constant and temporary associations, not completely assorted by
516
movement pattern and with no clear differences between sexes. Together these results suggest
517
that the Icelandic herring-eating killer whale population has a multilevel society with no clear
518
nested hierarchical structure of coherent social units, different from other populations of killer
519
whales studied to date.
520
The evidence for non-random associations indicates that our results were not merely a
521
consequence of the quality or constraints of the dataset. It is possible that some of the HWI
522
values were negatively biased due to incomplete photographic coverage of
523
groupings/aggregations (Ottensmeyer and Whitehead 2003). However, this type of bias would
524
only increase the probability of not rejecting the null hypothesis of associations being random.
525
The analysis using the most encountered adult females aimed at reducing the potential
526
influence of recording sporadic associations, due to the observation that adult female resident
527
killer whales have lower levels of mixing with other groups than other age-sex classes. Thus,
26
a matrilineal structure may have been more clearly detectable among adult females than in the
529
overall population. However, our population-level results were instead strongly supported by
530
the adult female-specific analysis, with adult females also presenting an unclear hierarchical
531
structure but a complex sociality with rare strong associations and many weak associations
532
between females from the same cluster, and several associations between females from
533
different clusters. There are indications that the weakness of associations is due to a high
534
variability across years (associations on one year might not occur in a different year) but the
535
small yearly number of sightings limits our ability to reach a definitive conclusion on the
536
stability of associations and yearly preferences between these individuals.
537
538
A complex multilevel society 539
In the Icelandic herring-eating killer whale population individuals clearly associated at
540
different levels, in some cases forming subcluster units. This society appears to tend towards
541
an incompletely nested multilevel society (as in Figure 6 in de Silva and Wittemyer 2012).
542
The levels of social stratification are not hierarchically distinct because transitions between
543
levels are gradual and may vary among individuals or sets of individuals, i.e. not all
544
individuals associate at similarly higher levels within social units and at distinctly lower levels
545
between social units. The variability in cluster complexity indicates diverse association
546
patterns among individuals and suggests different association strategies within the population.
547
Killer whale movement patterns did not assort their associations. In fact, individuals from
548
different subclusters and clusters with markedly different movement patterns were commonly
27
seen in tight groupings within less than one body length, a measure commonly used in other
550
killer whale social structure studies to define a group (e.g. Ivkovich et al. 2010, Esteban et al.
551
2016; Figure 10). Furthermore, complex cluster A (Figure 6) was formed by 3 highly
552
distinctive subclusters: subcluster A1, composed of individuals seen in Iceland year-round
553
following the movements of the ISS herring stock; subcluster A2 composed of individuals
554
that are only seen in Iceland in the winter; subcluster A3, composed of 5 individuals matched
555
to the Scottish population (only 2 Others and 1 Juvenile from this cluster were not matched)
556
and sighted in Scotland in the summer (Samarra and Foote 2015). Combining social structure
557
analysis with genetics could help to clarify the underlying aspects of social contact reported
558
here between whales with different movement patterns and potentially different feeding
559
ecologies in Iceland. It is worth noting that the individuals matched to the Scottish population
560
were not always sighted together in Scotland (Samarra and Foote 2015) nor in Iceland. It is
561
possible that individuals were missed in Scotland due to the opportunistic nature of data
562
collection. However, in our study we could confirm that these individuals were not always
563
associating at close proximity.
564
The Icelandic multilevel society seems to be driven by a mix of both constant and temporary
565
associations of mean duration of about 21 days. This temporal pattern of fission-fusion
566
dynamics can occur in several types of social systems: 1) one in which constant permanent
567
social units temporarily associate; 2) one in which individuals temporarily maintain casual but
568
preferred associations and; 3) one in which permanent units exist but some individuals are
569
‘floaters’ who move between units (Whitehead 2008a). When full units of individuals
570
collectively join, the typical group size should be twice the typical unit size, as in Pacific
28
sperm whales representing 2 temporal stable units joining (Whitehead et al. 1991) or larger, as
572
in Nova Scotia long-finned pilot whales where a group is comprised of several units
573
(Ottensmeyer and Whitehead 2003). Our study suggests that the temporal pattern did not
574
result from permanent social units temporarily associating since the estimated typical group
575
size was less than double of the typical unit size. Also, there was no indication of ‘floaters’
576
moving between units and no evidence of adult dispersal in the Icelandic population. Instead,
577
temporary associations are probably formed between preferred but casual associates or
578
potentially by small sets of associates who temporarily associate with full permanent units, as
579
small sets of associated ‘floaters’. Cluster members with weaker ties might represent these
580
casual but preferred temporary associates. It is unknown if this behavioral flexibility is only
581
maintained when killer whales aggregate in herring grounds or if it is seasonally shaped, so
582
further studies will be necessary to understand this type of affiliation.
583
584
How can local ecological context shape killer whale social structure? 585
Methodological differences among studies (e.g. disparity in sampling procedures, definition
586
of association, association index used) prevent a quantitative comparison of social structure
587
between the Icelandic and other killer whale populations. Nevertheless, overall social
588
structure comparisons can still be made. If sociality was determined by fish- vs.
mammal-589
eating ecological differences alone (Beck et al. 2012), we would expect that the Icelandic
590
population would have a similar social structure to fish-eating resident killer whales. Indeed,
591
mammal-eating killer whales show dispersal of either sex from maternal groups and relatively
592
rare and unstable associations between adult males (Baird and Whitehead 2000) which we did
29
not observe in our study and is also not present in residents (Bigg et al. 1990). These specific
594
characteristics of the mammal-eating population are linked to optimal foraging group size
595
adjustment when feeding on seals (Baird and Dill 1996). However, the clear stable matrilineal
596
units (cohesive long-term groups) with members associating strongly and permanently (Bigg
597
et al. 1990; Baird and Whitehead 2000) common to both mammal-eating and residents, was
598
not found in the Icelandic herring-eating population.
599
Coherent basic social units have been described for other killer whale populations regardless
600
of targeted prey (in Alaska: Matkin et al. 1999; Marion Island: Tosh et al. 2008; Northwest
601
Pacific: Ivkovich et al. 2010; and Gibraltar: Esteban et al. 2016) and it has been considered a
602
firm characteristic of the species despite ecological differences. In the Icelandic herring-eating
603
population the possible existence of matrilineal units is not clear, but cannot be rejected. For
604
example, the potential subclustering of cluster D (Figure 5) is matched to direct observations
605
of constant close proximity associates, which could be more similar to basic matrilineal units.
606
Yet, these subclusters were still strongly associated and were seen frequently switching
607
preference for close companions across days and years, as well as with individuals from other
608
clusters. Therefore, if matrilineal units are present in this population it is possible that these
609
are not entirely comparable to the ones present in other killer whale societies. An increase in
610
the timespan of association data and genetic analysis, relating kinship and gene flow with the
611
underlying patterns of associations, will be crucial to inform on the presence and
612
characteristics of family bond-units in this population.
613
Further differences from the resident killer whale society were the lack of clear social tiers
614
and hierarchical nesting in the Icelandic herring-eating society, which included fission-fusion
30
dynamics at an individual (or sets of a few individuals) rather than at a group level (periodic
616
merging of permanent social units). A parallel variation in multilevel structuring has been
617
quantified in elephant societies (de Silva and Wittemyer 2012). African elephants (Loxodonta 618
africana) maintain a clear multitiered society of coherent basic units that associate
619
hierarchically. In contrast, Asian elephants (Elephas maximus) have a complex multilevel
620
society without hierarchical structuring and nested units. Asian elephants do not maintain
621
clear core groups and associations can be either ephemeral or long-term. de Silva and
622
Wittemyer (2012) could not determine whether these differences were due to phylogenetic or
623
ecological factors, but there were significant environmental differences between the two
624
societies, such as differences in primary productivity and predation pressure.
625
Our study points to a different view of killer whale social structure, with a more dynamic and
626
fluid sociality than generally inferred from broad ecology. As argued by Beck et al. (2012),
627
ecology probably influences killer whale sociality rather than simply phylogenetic separation
628
of populations. However, considering only fish- vs. mammal-eating strategies as the
629
ecological condition influencing sociality ignores important particularities of local ecological
630
context. Herring-eating killer whales in Iceland target a prey with particular characteristics
631
different from salmon and seals, such as antipredator behaviors, unpredictability and patchy
632
distribution of high biomass. This shapes the feeding behavior of the population and probably
633
its social structure.
634
Herring is a schooling fish with a diverse repertoire of antipredator maneuvers (Nøttestad and
635
Axelsen 1999). Feeding upon this prey requires a highly coordinated group feeding technique
636
to herd and catch herring (Similä and Ugarte 1993), unlike feeding techniques described for
31
other fish-eating killer whale populations. To efficiently hunt larger concentrations or school
638
sizes using a coordinated foraging technique, killer whales might benefit from larger group
639
sizes to encircle the herring school (Vabø and Nøttestad 1997; Nøttestad et al. 2002). Active
640
adjustment of killer whale numbers hunting herring schools has been observed in Norway
641
(Nøttestad et al. 2002): on 4 observations of feeding groups (range of 22-46 individuals, mean
642
± SD = 33.5 ± 10.6 individuals), the 2 largest groups (38 and 46 individuals in total) occurred
643
when the herring layer was larger (depth range of 150/160 meters to 350 meters) and were
644
composed by different smaller groups of killer whales that gathered before starting to herd
645
herring, arriving from different directions. In these conditions, it might be important to
646
maintain a fission-fusion society where associations are flexible and individuals can actively
647
adjust to these constantly changing requirements.
648
Herring can also undergo substantial changes in density and spatial distribution, particularly
649
in overwintering grounds (Óskarsson et al. 2009). The unpredictability of the prey may
650
additionally promote the maintenance of a more fluid and flexible sociality. A socioecological
651
model proposed for dolphins suggests that when resources are unpredictable, dolphins will
652
present wide range movements, reduced competition by cooperative foraging and larger
653
groups to more effectively find and exploit large prey schools (Gowans et al. 2007). Dusky
654
dolphins (Lagenorhynchus obscurus) in Argentina feed on schooling fish and present similar
655
basic herding techniques to herring-eating killer whales (Würsig and Würsig 1980). Their
656
target prey is also unpredictably distributed. The population presents a strong fission-fusion
657
society with constantly fluctuating subgroup memberships (although some associations might
658
be constant) that split for feeding and social purposes (Würsig and Würsig 1980; Würsig and
32
Bastida 1986). This social structure is very different from dusky dolphins of New Zealand
660
(Markowitz 2004), whose target preys are more predictable.
661
Finally, feeding aggregations in Iceland are very common during summer and winter, in
662
grounds where herring are temporarily highly concentrated. The patchiness of a resource will
663
influence whether animals do aggregate and, although these aggregations for feeding are not
664
social structures (spatiotemporal clusters of individuals forced by non-social factors) they
665
might act as catalysts for sociality (Whitehead 2008a). Recurring aggregations due to prey
666
behavior may offer a special local ecological context for the establishment of associations,
667
creating opportunities for social interactions with other individuals and somehow shaping the
668
social structure of this population. The dynamic nature of the society described here may have
669
been uncovered because our data collection took place mostly during periods when large
670
aggregations of whales can occur, due to this particular ecological context. Future work
671
focusing on social associations of herring-eating killer whales during periods when herring
672
are more dispersed may reveal stronger social bonds, and clear long-term stable matrilineal
673
groups, if group sizes are substantially lower than observed during the herring spawning and
674
overwintering periods.
675
Other ecological differences such as habitat characteristics or historical capture might have
676
also shaped the social structure of this population but we lack sufficient information to
677
determine their influence at present. Furthermore, the Icelandic population is comprised of
678
individuals with different seasonal movement patterns that associate at least seasonally. This
679
alone can influence the social structure of the population, since different movement patterns
680
within the same population suggest exposure to different environmental conditions. This
33
might also lead to variation in social factors within the population, e.g. mating competition or
682
avoidance, which can influence the structuring of basic and high-order groups in mammals
683
(Silk 2007). More information on the genetic relatedness of whales with different movement
684
patterns is needed to understand how it may affect the resulting society.
685
We have shown that the Icelandic herring-eating killer whale population has a complex
686
multilevel social structure with no clear hierarchical nesting and no strong social segregation
687
by movement pattern. This social system appears to be different from other populations of
688
killer whales worldwide, but continued photo-identification data will be crucial to investigate
689
these questions over longer time scales and under different seasonal, spatial and prey
690
behavioral contexts. The differences observed suggest that fish vs. marine mammal prey-type
691
alone does not define killer whale social structure and local ecological context, such as prey
692
characteristics and foraging strategy, are probably strong drivers of sociality. The factors
693
constraining hierarchical stratification of societies are little understood and to our knowledge
694
are not addressed in socioecological frameworks (e.g. Emlen and Oring 1977; Wrangham
695
1980; Gowans et al. 2007). Comparative studies of populations targeting similar prey will be
696
extremely important to quantitatively assess the degree of variation in multilevel social
697
structuring with local ecological context.
698
699
Funding 700
This work was supported by the Fundação para a Ciência e a Tecnologia (grant numbers
701
SFSFRH/BD/30303/2006 and SFRH/BD/84714/2012); Icelandic Research Fund (grant
34
number 120248042); National Geographic Global Exploration Fund (grant number
703
GEFNE65-12); Office of Naval Research (grant number N00014-08-10984) and a Russell
704
Trust Award from the University of St. Andrews.
705
706
Acknowledgments 707
We would like to thank everyone that participated in the various field seasons, as well as Láki
708
Tours for the opportunity to join their whale-watching trips, and the Vestmannaeyjar Research
709
Centre, particularly Páll Jónsson, for logistical support. We thank Dr. Volker Deecke for
710
providing a platform for data collection in the summers of 2010 and 2015. We are grateful to
711
Graeme Ellis for invaluable advice and useful discussions on killer whale social structure. We
712
would also like to thank Dr. Gísli Víkingsson and Dr. Andrew Foote for providing the
713
preliminary Icelandic photo-id catalogue. Field methods, designed for minimum distress to
714
the animals, were approved by the School of Biology Ethics Committee of the University of
715
St Andrews. All field research was carried out in compliance with local regulations and under
716
permits provided by the Ministry of Fisheries. This manuscript benefited from the helpful
717
comments from two anonymous reviewers.
718
719
Data accessibility statement 720
Analyses reported in this article can be reproduced using the data provided by Tavares et al.
721
(2016).
722