ISSN Online: 1945-3108 ISSN Print: 1945-3094
DOI: 10.4236/jwarp.2019.116044 Jun. 26, 2019 740 Journal of Water Resource and Protection
Suitability of Soil Water Retention
Characteristic Models (SWRC) in Regions and
Soil Depth
Vitalis K. Too*, Christian T. Omuto, Elijah K. Biamah, John P. O. Obiero
Department of Environmental and Biosystems Engineering, University of Nairobi, Nairobi, Kenya
Abstract
Soil Water Retention Characteristics (SWRC) models have been widely used in many applications. Presently, there are many models in the literature and many more still being developed so much so that it is confusing which model to prefer. The current choice of the appropriate model to use has not been well guided by any incisive research on the predictive performance of these models. Consequently, SWRC model applications have been largely moved by convenience. This study used a global dataset to evaluate 12 commonly used SWRC models. The measured data onto which the models were evaluated was grouped into different soil depths and different regions of the world. The evaluation used correlation, Nash-Sutcliffe efficiency, and residual standard error statistics to choose the best overall performing model and models for each category. It gives an indication of the type of SWRC models to use in different regions of the world and depths of sampling. The suitability of the models to regions showed that the Fredlund and Xing model had the best performance in subsoils in Africa; Omuto in Southern Asia; and van Ge-nuchten in subsoils of the other regions. It is recommended that many more models be tested using the procedures in this study so that benchmarks can be established on SWRC model selection suitable for various regions.
Keywords
Soil Water Retention Characteristic, Soil Properties, Retention Models
1. Introduction
Water is held in the soil by gravity, matric suction, and osmotic forces. The models describing different levels of these forces and the corresponding amount of water held in the soil are known as soil water retention characteristics How to cite this paper: Too, V.K., Omuto,
C.T., Biamah, E.K. and Obiero, J.P.O. (2019) Suitability of Soil Water Retention Characteristic Models (SWRC) in Regions and Soil Depth. Journal of Water Resource and Protection, 11, 740-747.
https://doi.org/10.4236/jwarp.2019.116044
Received: October 26, 2018 Accepted: June 23, 2019 Published: June 26, 2019
Copyright © 2019 by author(s) and Scientific Research Publishing Inc. This work is licensed under the Creative Commons Attribution International License (CC BY 4.0).
http://creativecommons.org/licenses/by/4.0/
DOI:10.4236/jwarp.2019.116044 741 Journal of Water Resource and Protection (SWRC) models. There are two major categories of these models in the litera-ture: pedotransfer functions (PTFs) which relate easily measurable soil proper-ties to SWRC [1] and mathematical functions that can be fitted to experimental SWRC [2]. Predictive models under these two categories have been widely used in the literature in areas such as irrigation water management, crop-yield esti-mation, global circulation modeling, land degradation assessment, geotechnical engineering, etc. [3] [4] [5] [6] [7]. The major difference between these two model categories is that the mathematical functions contain fitting parameters which can be related to soil physical properties while PTFs do not necessarily have this relationship. Consequently, the mathematical functions have been used as a fundamental input in the various applications using SWRC. PTFs have been used largely as an alternate method to derive the parameters of the mathematical functions. This explains why there is still an active research to produce better user-friendly and accurate mathematical models for SWRC than the existing models [8] [9] [10].
There are many documented mathematical models for SWRC. Reviews of li-terature on these models show that the popular ones are those that contain three-, four- and five-parameters [11] [12]. For example, a review by Leong and Rahardjo [11] showed that the popular models are Brooks-Corey, Farrel-Larson, Fredlund-Xing, Gardner, McKee-Bumb, van Genuchten, and Williams SWRC models. Another review by Bullied et al. [13] portrayed Campbell, Russo and Tani models as popular in addition to some of the models contained in the re-view by Leong and Rhardjo [11]. Another aspect of these reviews shows that the popular models mostly have high success rates in areas where they were devel-oped. It is important to note that they were developed and tested in different re-gions of the world. Consequently, some of them have been successful in those areas, others have been modified to extend their applications in independent areas, while some have been used in different places without regard to whether they are successful or not. Still, many more are being developed in an attempt to improve on the existing models. However, there is no exhaustive study to com-pare their performance in different regions of the world. There is a need to de-termine the relative performance of these models in order to guide their applica-tion or encourage further development of new models.
Since the advent of digital soil mapping (DSM) and digital soil assessment (DSA) paradigms, there has been an upsurge of development of soil inference models and the need to increase accurate application of soil mapping products
DOI: 10.4236/jwarp.2019.116044 742 Journal of Water Resource and Protection
2. Materials and Methods
2.1. SWRC Models Analyzed
The SWRC models analyzed in this study and their curve-fitting parameters are given in Table 1. The models were also placed into three groups: five-parameter, four-parameter, and three-parameter SWRC models. This grouping was neces-sary because models with many parameters may tend to perform better than those with few parameters and lead to biased performance comparison.
The five-parameter models were those proposed by Fredlund and Xing [2], Omuto [15] and van Genutchen [16]. The van Genuchten [16] model is that in which n and m parameters are independent. The four-parameter models were those proposed by Kosugi [8], Dexter et al. [9], van Genuchten [16] (in which the parameter m = 1 − 1/n), Gardner [17], Brooks and Corey [18], and Russo
[19]. The three-parameter models were those proposed by Campbell [20], Tani
[21], and McKee and Bumb [22].
2.2. Input Data
[image:3.595.56.540.386.727.2]The global data used for analysis of the SWRC models was downloaded on 6th May 2013. The data contained soil water content (θ in cm3∙cm−3) at various levels
Table 1. SWRC models tested.
Model name Abbreviation Equation Fitting parameters
Five parameter models
Van Genuchten VG1 ( ) ( ) 1 ( )
m n
r s r
h h
θ =θ +θ θ− + α θr, θs, α, n, m
Fredlund-Xing FX ( ) ( ) ln 2.7183 ( )
m n
r s r
h h
θ =θ +θ θ− + α θr, θs, α, n, m
Omuto Omuto θ( )h = +θ θr s1∗exp(−α1h)+θs2∗exp(−α2h) θr, θs1, θs2, α1, α2
Four-parameter models
Gardner Gard ( ) ( ) 1 n
r s r
h h
θ =θ + θ θ− +α θr, θs, α, n
Brooks-Corey BC ( ) ( ) ( )n
r s r
h h
θ = +θ θ θ− α θr, θs, α, n
Kosugi Kosugi
( )h r ( s r)Q ln( )h n
θ =θ +θ θ− α ,
Q is complimentary normal distribution function define as
( )
(
(
(
2)
)
)
1 exp 0.5 2 d
h
Q h h h
∞
= −
∫
− πθr, θs, α, n
Double exponential Dexpo θ( )h =θs1∗exp(−α1h)+θs2∗exp(−α2h) θs1, θs2, α1, α2
Van Genuchten VG2 ( ) ( ) ( ) 1 1
1
n n
r s r
h h
θ =θ +θ θ− +α − θr, θs, α, n
Russo Ruso ( ) ( )
(
1 0.5 ( ))
exp(
0.5 ( ))
2( 2) n nr s r
h h h
θ =θ + θ θ− + ∗α ∗ − ∗α +
θr, θs, α, n
Three-parameter models
McKee-Bumb MB θ( )h = +θr (θ θs− r)∗exp(−αh) θr, θs, α
Campbell Camp ( ) ( )n
s
h h
θ = ∗θ α θs, α, n
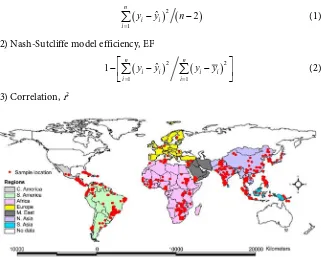
DOI:10.4236/jwarp.2019.116044 743 Journal of Water Resource and Protection of suction potential (h in cm). Only samples with at least eight (8) levels of suc-tion potential and water contents were considered. The samples were grouped into topsoil (at depths between 0 cm and 50 cm from the soil surface) and sub-soil (at depths greater than 50 cm from the sub-soil surface). This grouping of sam-ples into various depths was mainly to provide suitability of the models to vari-ous uses like irrigation modeling, watershed management and geotechnical in-vestigations since soil depths are considered. These two groups were further split into samples from Central America, South America, Africa, Europe, Middle East, North Asia, and South Asia (Figure 1).
Data description and associated measurement methods have been given in Batjes [23]. There were at least nine (9) samples with complete SWRC data (i.e. with eight suction potential levels) for topsoil and at least six (6) samples with complete SWRC data for subsoils in each region. Preliminary analysis of the data showed that the samples had at least one measurement around saturation (i.e. when the suction potential is very low), at least one inflection point, and at least one measurement around the dry end (i.e. when the suction potential is very high). In addition, the majority of the samples had an inflection point around −1.0 m suction potential.
2.3. Data Analysis
The models in Table 1 were fitted to measured SWRC data using nonlinear curve fitting method. The analysis of these models in predicting measured SWRC for various regions and depths were analyzed using the following popular statistics:
1) Residual standard error, RSE
(
) (
2)
1
ˆ 2
n
i i
i
y y n
=
− −
∑
(1)2) Nash-Sutcliffe model efficiency, EF
(
)
2(
)
21 1
ˆ 1
n n
i i i i
i i
y y y y
= =
− − −
∑
∑
(2) [image:4.595.217.538.448.705.2]3) Correlation, r2
DOI: 10.4236/jwarp.2019.116044 744 Journal of Water Resource and Protection
(
)(
)
2(
(
2)
(
)
2)
(
(
2)
(
)
2)
1ˆ ˆ ˆ ˆ
n
i i i i i i i
i
n y y y y n y y n y y
=
− − − −
∑
∑
∑
∑
∑
∑
∑
(3)where yi is the measured soil water contents, yˆi are the fitted soil water con-tent, yi is the mean measured soil water contents, and n are the number of da-ta points (i.e. soil moisture levels for each soil sample). In analysis, values of EF and r2 close to unity and low RSE are preferred for a good model.
3. SWRC Models Suitability in Various Regions and Depths
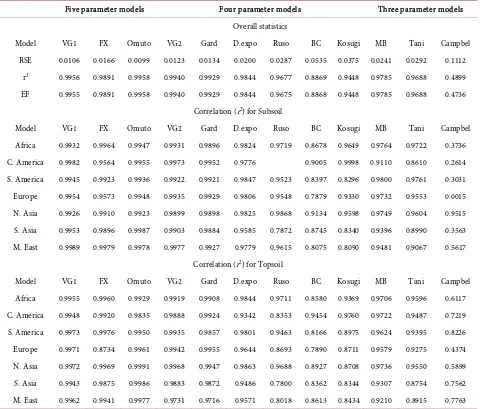
The suitability of SWRC models in various regions was done by comparing their performance with data from different regions of the world and depths of soil sample below the soil surface. Using correlation statistics, the performance of the five-parameter models using the subsoils data showed that the Fredlund and Xing model had the best performance (R2 = 0.9964) in Africa; Omuto in South-ern Asia (R2 = 0.9987) and van Genuchten in Central America, South America, Europe and Northern Asiaregions (Table 2). In the four-parameter category, The van Genuchten, four-parameter model, did well among the other four-parameter models in subsoil Africa, America, Europe, Asia, M. East regions with R2 of 0.9931, 0.9973, 0.9922, 0.9935, 0.9899, 0.9903 and 0.9977 respectively.Using topsoil samples, in the five-parameter category, Omutomodel per-formed well in North and South Asiaregions with R2 of 0.9991 and 0.9986 spectively, Fredlund and Xing model did well in Africa and south America re-gions with R2 of 0.9960 and 0.9976 respectively. The five-parameter van Ge-nuchtenmodel performed well in Central America and Europe with R2 of 0.9948 and 0.9971 while the four-parameter van Genuchtenmodel was found to per-form well in all the other regions except in Central America and Europe on the topsoil samples. The three-parameter exponential model proposed by McKee and Bumb outperformed the other models in the three-parameter category in all regions and soil depths. This performance pattern was also portrayed by the other statistical indices (i.e. RSE and EF).
DOI:10.4236/jwarp.2019.116044 745 Journal of Water Resource and Protection Table 2. Summary statistics of SWRC models performance.
Five parameter models Four parameter models Three parameter models Overall statistics
Model VG1 FX Omuto VG2 Gard D.expo Ruso BC Kosugi MB Tani Campbel RSE 0.0106 0.0166 0.0099 0.0123 0.0134 0.0200 0.0287 0.0535 0.0375 0.0241 0.0292 0.1112
r2 0.9956 0.9891 0.9958 0.9940 0.9929 0.9844 0.9677 0.8869 0.9448 0.9785 0.9688 0.4899 EF 0.9955 0.9891 0.9958 0.9940 0.9929 0.9844 0.9675 0.8868 0.9448 0.9785 0.9688 0.4736
Correlation (r2) for Subsoil
Model VG1 FX Omuto VG2 Gard D.expo Ruso BC Kosugi MB Tani Campbel Africa 0.9932 0.9964 0.9947 0.9931 0.9896 0.9824 0.9719 0.8678 0.9649 0.9764 0.9722 0.3736 C. America 0.9982 0.9564 0.9955 0.9973 0.9952 0.9776 0.9005 0.9998 0.9110 0.8610 0.2614 S. America 0.9945 0.9923 0.9936 0.9922 0.9921 0.9847 0.9523 0.8397 0.8296 0.9800 0.9761 0.3031 Europe 0.9954 0.9573 0.9948 0.9935 0.9929 0.9806 0.9548 0.7879 0.9330 0.9732 0.9553 0.0015 N. Asia 0.9926 0.9910 0.9923 0.9899 0.9898 0.9825 0.9868 0.9134 0.9598 0.9749 0.9604 0.9515 S. Asia 0.9953 0.9896 0.9987 0.9903 0.9884 0.9585 0.7872 0.8745 0.8340 0.9396 0.8990 0.3563 M. East 0.9989 0.9979 0.9978 0.9977 0.9927 0.9779 0.9615 0.8075 0.8090 0.9481 0.9067 0.5617
Correlation (r2) for Topsoil
Model VG1 FX Omuto VG2 Gard D.expo Ruso BC Kosugi MB Tani Campbel Africa 0.9955 0.9960 0.9929 0.9919 0.9908 0.9844 0.9711 0.8580 0.9369 0.9706 0.9596 0.6117 C. America 0.9948 0.9920 0.9835 0.9888 0.9924 0.9342 0.8353 0.9454 0.9760 0.9722 0.9487 0.7219 S. America 0.9973 0.9976 0.9950 0.9935 0.9857 0.9801 0.9463 0.8166 0.8975 0.9624 0.9395 0.8226 Europe 0.9971 0.8734 0.9961 0.9942 0.9955 0.9644 0.8693 0.7890 0.8711 0.9579 0.9275 0.4374 N. Asia 0.9972 0.9969 0.9991 0.9968 0.9947 0.9863 0.9688 0.8927 0.8708 0.9736 0.9550 0.5899 S. Asia 0.9943 0.9875 0.9986 0.9883 0.9872 0.9486 0.7800 0.8362 0.8344 0.9307 0.8754 0.7562 M. East 0.9962 0.9941 0.9977 0.9731 0.9716 0.9571 0.8018 0.8613 0.8434 0.9210 0.8915 0.7763
Best performing model in the category.
4. Conclusion
applica-DOI: 10.4236/jwarp.2019.116044 746 Journal of Water Resource and Protection tions.
Acknowledgements
The soil data used in this study were obtained from The International Soil Ref-erence and Information Centre (ISRIC). The organization and countries which contributed to this dataset are highly acknowledged.
Conflicts of Interest
The authors declare no conflicts of interest regarding the publication of this paper.
References
[1] Minasny, B. and McBratney, A.B. (2007) Estimating the Water Retention Shape Pa-rameter from Sand and Clay Content. Soil Science Society of America Journal, 71, 1105-1110.https://doi.org/10.2136/sssaj2006.0298N
[2] Fredlund, D.G. and Xing, A. (1994) Estimation of Soil Water Characteristic Curve.
Canadian Geotechnical Journal, 31, 521-532. https://doi.org/10.1139/t94-061
[3] Vanapalli, S.K., Fredlund, D.G., Pufahl, D.E. and Clifton, A.W. (1996) Model for Prediction of Shear Strength with Respect to Matric Suction. Canadian Geotechnic-al JournGeotechnic-al, 33, 379-392.https://doi.org/10.1139/t96-060
[4] Liu, J., Goering, C.E. and Tian, L. (2001) Neural Network for Setting Target Corn Yields. Transactions of American Society of Agricultural Engineers,44, 705-713. https://doi.org/10.13031/2013.6097
[5] Dexter, A.R. (2004) Soil Physical Quality. Part I. Theory, Effects of Soil Texture, Density, and Organic Matter, and Effects on Root Growth. Geoderma, 120, 201-214.https://doi.org/10.1016/j.geoderma.2003.09.004
[6] Chotpantarat, S., Limpakanwech, C., Siriwong, W., Siripattankul, S. and Sutthirat, C. (2011) Effects of Soil Water Characteristic Curves on Simulation of Nitrate Ver-tical Transport in a Thai Agricultural Soil. Sustainable Environmental Research,21, 187-193.
[7] Patil, N.G., Pal, K.D., Mandal, C. and Mandal, D.K. (2012) Soil Water Retention Characteristics of Vertisols and Pedotransfer Functions Based on Nearest Neighbor and Neural Networks Approaches to Estimate AWC. Journal of Irrigation and Drainage Engineering, 138, 177-184.
https://doi.org/10.1061/(ASCE)IR.1943-4774.0000375
[8] Kosugi, K. (1996) Lognormal Distribution Model for Unsaturated Soil Hydraulic Properties. Water Resources Research, 32, 2697-2703.
https://doi.org/10.1029/96WR01776
[9] Dexter, A.R., Czyz, E.A., Richard, G. and Reszkwoska, A. (2008) A User-Friendly Water Retention Function That Takes Account of the Textural and Structural Pore Spaces in Soil. Geoderma, 143, 243-253.
https://doi.org/10.1016/j.geoderma.2007.11.010
[10] Omuto, C.T. and Gumbe, L.O. (2009) Estimating Water Infiltration and Retention Characteristics Using a Computer Program in R. Computers and Geosciences, 35, 579-585.https://doi.org/10.1016/j.cageo.2008.08.011
Eq-DOI:10.4236/jwarp.2019.116044 747 Journal of Water Resource and Protection uations. Journal of Geotechnical and Geo-Environmental Engineering, 123, 1106-1117.https://doi.org/10.1061/(ASCE)1090-0241(1997)123:12(1106)
[12] Malaya, C. and Sreedeep, S. (2012) Critical Review on the Parameters Influencing Soil-Water Characteristic Curve. Journal of Irrigation and Drainage Engineering, 138, 55-62.https://doi.org/10.1061/(ASCE)IR.1943-4774.0000371
[13] Bullied, W.J., Bullock, R.P. and van Acker, R.C. (2012) Modelling Soil Water Reten-tion for Weed Seed GerminaReten-tion Sensitivity to Water Potential. Applied Environ-mental and Soil Science, 2012, Article ID: 812561.
https://doi.org/10.1155/2012/812561
[14] Minasny, B., Malone, B.P. and McBratney, A.B. (2012) Digital Soil Assessments and Beyond: Proceedings of the 5th Global Workshop on Digital Soil Mapping 2012, Sydney, Australia. CRC Press, Boca Raton.https://doi.org/10.1201/b12728
[15] Omuto, C.T. (2009) Biexponential Model for Water Retention Characteristics.
Geoderma, 149, 235-242.https://doi.org/10.1016/j.geoderma.2008.12.001
[16] van Genuchten, M.T. (1980) A Closed-Form Equation for Predicting the Hydraulic Conductivity of Unsaturated Soils. Soil Science Society of America Journal, 44, 892-898.https://doi.org/10.2136/sssaj1980.03615995004400050002x
[17] Gardner, W.R. (1958) Some Steady State Solutions of the Unsaturated Moisture Flow Equation with Application to Evaporation from a Water Table. Soil Science, 85, 228-232.https://doi.org/10.1097/00010694-195804000-00006
[18] Brooks, R.H. and Corey, A.T. (1964) Hydraulic Properties of Porous Medium. Hy-drology Paper Number 3. Colorado State University, Fort Collins.
[19] Russo, D. (1988) Determining Soil Hydraulic Properties by Parameter Estimation: On the Selection of a Model for the Hydraulic Properties. Water Resources
Re-search, 24, 453-459.https://doi.org/10.1029/WR024i003p00453
[20] Campbell, G.S. (1974) A Simple Method for Determining Unsaturated Conductivity from Moisture Retention Data. Soil Science,117, 311-314.
https://doi.org/10.1097/00010694-197406000-00001
[21] Tani, M. (1982) The Properties of Water-Table Rise Produced by a One-Dimensional, Vertical, Unsaturated Flow. Journal of Japan Forestry Society, 64, 409-418.
[22] McKee, C.R. and Bumb, A.C. (1984) The Importance of Unsaturated Flow Parame-ters in Designing a Monitoring System for Hazardous Wastes and Environmental Emergencies. Proceedings of Hazardous Materials and Control Research Institute of
Nature Conference, Houston, Tex, 50-58.