Note
to
readers:
This chapter, taken from The Physical Environment: A New Zealand Perspective, edited by Andrew
Sturman and Rachel Spronken‐Smith, South Melbourne, Vic. ; Auckland [N.Z.] : Oxford University
Press, 2001, has been reproduced with the kind permission of Oxford University Press (OUP). OUP
maintain copyright over the typography used in this publication.
Authors retain copyright in respect to their contributions to this volume.
The Physical Environment
A New Zealand Perspective
Edit
e
d b
y
Andrew Sturman and
Rachel Spronken-Sm
i
th
OXFORD
UNIVERSITY PRESS253 Normanby Road, South Melbourne, Victoria, Australia 3205 Oxford University Press is a department of the University of Oxford. It furthers the University's objective of excellence in research, scholarship, and education by publishing worldwide in
Oxford New York
Athens Auckland Bangkok Bogota Buenos Aires Cape Town Chennai Dar es Salaam Delhi Florence Hong Kong Istanbul Karachi Kolkata Kuala Lumpur Madrid Melbourne Mexico City Mumbai Nairobi Paris Port Moresby Sao Paulo Shanghai Singapore Taipei Tokyo Toronto Warsaw
with associated companies in Berlin Ibadan
OXFORD is a registered trade mark of Oxford University Press in the UK and in certain other countries
© Andrew Sturman and Rachel Spronken-Smith 2001
Authors retain copyright in respect of their contributions to this volume
First published 2001
All rights reserved. No part of this publication may be reproduced, stored in a retrieval system, or transmitted, in any form or by any means, without the prior permission in writing of Oxford University Press. Within New Zealand, exceptions are allowed in respect of any fair dealing for the purpose of research or private study, or criticism or review, as permitted under the Copyright Act 1994, or in the case of repro graphic reproduction in accordance with the terms of the licences issued by Copyright Licensing Limited. Enquiries concerning reproduction outside these terms and in other countries should be sent to the Rights Department, Oxford University Press, at the address above.
ISBN 0 19 558395 7
Edited by Richard King Indexed by Russell Brooks
Cover and text designed by Derrick I Stone Design Typeset by Derrick I Stone Design
entrainment, transportation, and deposition of fine grained sediments by the wind. They may be triggered by both natural and human-induced forcings, including cli-mate change that leads to aridity, or daily weather phenomena such as fohn wind storms, thunderstorm outflows, and whirlwinds that produce favourable conditions for the entrainment of fine-grained sediments by the wind. Human-induced forcings are many and varied, and include any activity that results in the exposure of surface sedi-ments to the wind. Two dramatic examples of such activities have been the wide-spread cultivation of the prairie grasslands in the American and Canadian Midwest that lead to the Dust Bowl period of the 1930s (Figure 18.1), and the abstraction of water from the Amudar'ya and Syrdar'ya Rivers, which flow into the Aral Sea. This has resulted in a 50% decrease in size of what was once the world's fourth-largest lake, thereby exposing more than a million hectares of lake bed to aerial processes. The resulting dust storms laden with salts, pesticides, radio-nucleides, and industrial pollu-tants now affect the health and livelihoods of over 50 million people (Barrow 1995). Such dust storms contribute to the estimated annual global dust emissions of 1000-3000 Tg (li et a!. 1996), which look certain to rise as the rate of vegetation clearance due to cultivation and overgrazing, particularly in arid and semi-arid regions, continues to increase. Of recent concern is the role of tropospheric dust load in global climate dynamics, particularly climate change through modification of the radiation budget and energy balance, while dust transport is fundamental to many bio-geochemical and photo-oxidant cycles.
Aeolian Processes and Landforms 327
Figure 18.1 A 'black blizzard' approaching Dalhart,Texas, during the Dust Bowl period of the 1930s. (Southwest Coliection,Texas Tech University, Lubbock,Texas)
erosion. In the inner montane basins of the eastern South Island rates of soil loss by
the wind of 40 to 80 t ha Yl- 1 have been documented (Basher & Painter 1997), while Environment Canterbury acknowledges wind erosion to be the major cause of soil loss
in such settings (Canterbury Regional Council 1995). This is almost 70 years after Zotov (1938) considered wind erosion in the South Island high country to be no more important or widespread than erosion by running water. Furthermore, the disturbance of coastal sand-dune systems by developers and recreational users has led to dune blow-outs and subsequent sand encroachment onto farmland and residential areas around New Zealand's coastline.
Although aeolian processes play an important role in the physical environment of New Zealand, scientific studies into the physical nature and incidence of wind erosion
in the New Zealand landscape are scarce. The studies that have been undertaken have often relied heavily on overseas research, which has typically been conducted in sandy
desert environs such as the Sahara, or in the continental climates of the mid-western United States of America to form the basis for local research programmes. However, while many of the fundamental relationships and concepts governing fine-grain tran s-port by the wind identified by such international studies hold true within the context of New Zealand aeolian geomorphology, others do not. For example, in regions such as
the South Island high country, much higher wind energy regimes are present than are
typically monitored in many of the world's deserts, and the supply of sediment to the
airstream is often controlled by vegetation, moisture, ice, snow, and lag deposits (McGowan 1997; Wolfe 1997). In turn, these controls may be influenced by both natural and anthropogenic disturbances.
Aeolian processes globally and in New Zealand
sediments are, or have been, exposed to the wind. In general, aridity is fundamental to wind erosion, but it is not a necessity, and for this reason the dryland regions of the world display the most widespread and varied assemblage of aeolian processes and landforms. The most extensive and well-known dryland regions are located in the continental subtropics and mid latitudes (Figure 18.2), and cover approximately a third of the Earth's land surface (Cooke & Warren 1973). Recent studies suggest that there is a well-defined relationship between aridity and increasing dust storm (i.e. when dust being actively raised from the surface by the wind reduces visibility by < 1 km) frequency, which is valid down to annual precipitation totals of approximately 100 to 200 mm. Regions that record less annual rainfall appear to report fewer dust storms (McTainsh 1989), indicating that ephemeral water may playa significant role in the supply of wind-erodible surface sediments. In more humid environments where strong seasonal precipitation cycles exist, aeolian processes may also be common, par-ticularly throughout the dry season when soil moisture is low and land-use methods combine with favourable meteorological conditions to initiate wind erosion. For example, estimated annual total soil loss from the prairies of western Canada is approximately 161 X 106 t (Sparrow 1984), with associated economic costs that exceed several hundred million dollars each year (Wheaton & Chakravarti 1990). Similar soil losses have been reported further south on the Great Plains of the United States of America, where wind erosion is most severe during late winter and early spring before the planting of seasonal crops. In the polar regions, wind erosion of snow-free areas is often associated with katabatic winds flowing off plateaus such as in the Dry Valleys of the Antarctic (Selby et a1. 1973), or with polar cyclonic systems as discussed by McKenna Neuman and Gilbert (1986) (Baffin Island) and Ashwell (1986) (Iceland).
[image:6.597.135.545.394.624.2]20'
50'
Aeolian Processes and Landforms 329
In the arid and semi-arid environments of Central Asia and the Middle East, aeo-lian processes form an integral role in local and regional climate and geomorphology. In Kuwait, dust storms known locally as toze, cause health problems and disrupt communication links, while sand encroachment onto farms, oil installations and other developments is a significant and expensive problem (Khalaf & Al-Ajmi 1993). Dust storms in this region are most frequently associated with strong northwesterly winds from spring to mid summer (March-August), which entrain dust from the Mesopotamian flood plain in southern Iraq.
Further west in Iran, Afghanistan, Pakistan, and northwestern India, the highest frequency of dust storms are reported throughout the dry spring and summer months. These events are typically associated with hot dry winds known locally as the shamal (Mesopotamia), simoun (Iran and Arabia), loa (Indus plain), and the ~uind of 120 days (Afghanistan). The highest annual frequency of dust storms in this region is recorded in the area surrounding Zabol in the Iranian Seistan, where approximately 81 dust-storm days are reported (Middleton 1986). The distribution of dust storms in south-west Asia is shown in Figure 18.3 (Middleton 1986).
Closer to New Zealand, the township of Alice Springs in Australia records the highest frequency of dust storms in Australasia, with a mean of 10.8 and a maximum of 65 events per year (Middleton 1984). McTainsh (1989) noted that the majority of aeolian activity, including dust-storm genesis, in Australia seems to occur on the mar-gins of the most arid areas (Figure 18.4). This tends to highlight the role of seasonal surface water in the supply of fine-grained sediments to river flood plains, playa lakes, and wadis, which are known to be prolific sources of wind-blown sediment in arid and semi-arid regions.
BO' 10'
~ 30 dust storm days per year
o
'f<
"'
:
o .;
20 20~
120~
500km I
o 600km 30'
~
I
• 0'BO' BO'
Figure 18.3 Distribution of dust storms
in Southwest Asia. (After Middleton 1986)
- Mean annual rainfall (mm)
- Dust storm frequency per year C:> >5 dust storms per year
[image:7.595.101.584.381.603.2]120' 15iJ'
Figure 18.4 The mean annual distribution of dust-storm days in Australia (1957-82) with the 200 and 400 mm annual rainfall isohyets also shown. (After Middleton 1984)
'51)' la'
20'
The most favourable meteorological conditions for dust-storm genesis over cen-tral and southern Auscen-tralia are eastward-travelling cold fronts, which are synonymous with the southerly changes that travel up the east coast of New Zealand (Sturman 1992). Prefrontal hot dry northerlies on the leading edge of the frontal disturbances often entrain sediment from the arid and semi-arid interior of the continent and trans-port it down over southeastern Australia. One such dust storm on 8 February 1983 reduced visibility in Melbourne to less than 100 m and brought most communication links to a halt. It closed airports for half an hour and took approximately an hour and a half to pass over the city (Figure 18.5). Suspended dust from such storms frequently crosses the Tasman Sea to affect New Zealand (McGowan et at. 2000).
Figure 18.5 Dust plume travelling over Melbourne on 8 February 1983. (Courtesy of the Australian Bureau of Meteorology).
As elsewhere in the world, aeolian processes in the New Zealand landscape are typically confined to geomorphically active areas, including fluvio-glacial deposits, braided riverbeds, alluvial fans, and coastal sand-dune systems. Wind erosion in these environments may occur at any time when favourable meteorological and surface con-ditions for fine-grain entrainment by the wind exist, such as fohn nor' westers and southerly changes (McGowan 1996). During droughts large areas of farmland may also become susceptible to wind erosion. For example, on the Canterbury Plains, where cultivation and grazing can remove or severely degrade the vegetation cover, wind erosion rates of 20-125 t ha-1 have been recorded from recently cultivated and/or
[image:8.597.118.547.199.429.2]Aeolian Processes and Landforms 33 1
Aeolian sediment transport
The turbulent surface layer
Fundamental to aeolian geomorphology is the movement of air. In general, the stronger the wind, the more particles that will be transported by the airstream during favourable conditions for aeolian sediment transport. Airflow across a fixed bed is, however, retarded near the surface by surface roughness elements. This frictional effect produces wind shear, which in turn manifests itself in the form of eddies that dis-play differing size, speed, and direction throughout the turbulent surface layer (Figure 18.6). Near the surface, viscous forces become dominant in a very thin sublayer, which is usually less than 1 mm in depth. Airflow in this sublayer over aerodynamically smooth surfaces (i.e. those where the mean grain size of surface elements is approxi-mately <80 flm) is laminar and the velocity gradient displays an almost linear rela-tionship with height. However, over aerodynamically rough surfaces, the laminar sub layer ceases to exist and is replaced by a viscous sublayer that is poorly understood. Above this sub layer when saltation is not occurring, wind speed increases with height, although seldom following the well-known logarithmic wind profile, owing to irregu-larities in surface form (Livingstone & Warren 1996). For example, over surfaces such as the windward slopes (stoss slopes) of sand dunes, the compression of the flow field causes an acceleration of the wind near the surface. Above the top of the planetary boundary layer (Figure 18.6), away from surface frictional effects, the wind speed is approximately constant with height.
105~---~---'100km
s.m'rro
Troposphere
•
1 I Planetary boundary layer •I
Turbulent surface layer
Roughness layer
1 km
10m
0.1 m
[image:9.595.259.509.392.561.2]L---~O
Figure 18.6 The vertical structure of the lower atmosphere. (After Oke 1990)
termed the aerodynamic roughness length (zo). The height of this layer is estimated
by using the second assumption: that wind velocity increases with height above Zo following a semi-logarithmic relationship, which is sometimes termed the 'law of the wall'. As a result of these assumptions, Zo can be estimated by plotting two or more
simultaneous mean wind-speed observations against height on a semi-logarithmic graph with the extrapolated y-axis intercept identifying z00 The aerodynamic
rough-ness length for each surface does not change with respect to wind speed unless the wind changes the properties of the surface (i.e. height, density, and porosity). For
sand, zo may be assumed to be approximately 1/30 the mean grain size (for
non-saltating surfaces), although this value does vary depending on particle spacing and
shape. Some typical values for the zo are presented in Table 18.1. Table 18.1 Typical values of aerodynamic roughness lengths in metres.
Surface Remarks
Watel- F[at, open sea
Ice Smooth Snow
Sand Desert Playas Desert
Beaches Coastal sand
A[[uvia[ fans
After Oke 1990; Hsu 1988; Lancastel-1995
Zo (m)
0.[-[0 X [0'
0.[ X [04
0.5-[0 X [04
OJ x [OJ
0.8-[.3 x [0.4
0.2 x [O~
7.6-3 [ x [04
By using the Karman/Prandtl approach, another important variable, known as the friction velocity (u*) can be determined. u* is proportional to the slope of the vertical wind speed profile for statically neutral conditions (which seldom occur in the field),
when plotted with a logarithmic height scale (Stull 1988). The friction velocity is related to the shear force exerted ( 'fO) on the surface by the wind thus:
u*
=J
'faP
awhere Pa is the density of the air. However, if zo has already been determined, and wind-speed observations from one height above the surface are available, then u* can be calculated by using the following equation.
kUz
In(~ )
Zo
where Uz is the mean wind speed (ms-1) at the height z, and k is von Karman's
con-stant (=0.40).
However, it is important to remember that once sand transport is initiated by the
[image:10.597.211.546.236.333.2]Aeolian Processes and Landforms 333
I nterparticle forces
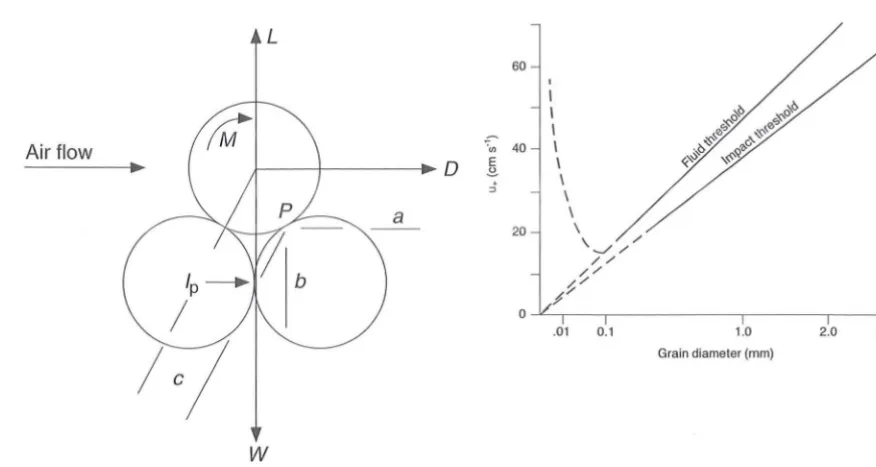
Individual grains sitting at rest on a dry unconsolidated bed over which a fully turbu -lent airstream is moving have several forces acting on them. For an idealised case for spherical grains, these forces include fluid drag (D), lift (L), moment (M), weight (Wt ) and interparticle cohesion (I p) (Figure 18.7). The drag and lift forces and moment (torque) are caused by the viscous fluid (air) flowing over and around the exposed par-ticle(s). Decreased fluid static pressure at the top of the grain and a steep pressure gr a-dient near the grain surface (the Bernoulli effect) provide the lift force (N ickling 1994). The weight force reflects the size, shape, and mineralogy of the grain, while the cohesive forces are a function of the packing arrangement of grains and the presence or absence of bonding agents such as moisture, micro-organisms, and soluble salts.
As the velocity of the airstream increases, exposed grains will begin to pivot about point P (Figure 18.7) as the forces of entrainment and retardation come into balance, as defined by the following equation,
where a, h, and c are the moment arms. At this stage, any slight increase in wind speed will cause the particle to lift from the surface and to become entrained i9'to the airstream. This highlights the importance of turbulence (wind gusts) in the entrain -ment process.
Threshold entrainment velocities
As the velocity of the near-surface airstream increases and the combined forces of drag, lift, and moment overcome the forces of resistance, particles will become entrained by the wind. This critical wind velocity is termed the threshold friction velocity (u*t) and was defined by Bagnold (1941) as:
where A is an empirical coefficient that is approximately equal to 0.1 for particle fric-tion Reynolds numbers (Rep) greater than 3.5 (Rep = U* Djv, where v is the kinematic viscosity of air), g is the acceleration due to gravity, and D is the particle diameter. u*t attains a minimum value when the mean grain size of the surface sediments approaches 80 11m (Figure 18.8). For surfaces with finer mean grain sizes, U*t increases sharply because the surface particles lie below the viscous sub layer discussed earlier and the fluid drag exerted on the surface by the overlying airstream is spread more evenly, rather than being focused on several large grains as occurs over aerodynami-cally rough surfaces (i.e. where Rep> 3.5).
L
60
Air flow '" 40
~ 0 ~ E
::l
a
20 I I I
\ \
\ \
\
\
'
--/
/ // / / / / . / £ /
Y
O~-,---,---.---,----, .01 0.1
w
1.0
Grain diameter (mm) 2.0
Figure 18.7 (Left) Forces acting on a stationary sand grain. See text for description of characters. (After Nickling
1994)
Figure 18.8 (Right) Schematic representation of the relationship between the fluid threshold and impact
threshold velocities and mean grain diameter. (After Bagnold 1941)
particles and become re-entrained into the airstream, or become embedded in the sur -face. These impacts transfer momentum to the surface through the disturbance of
other grains, which are either ejected from the surface or are displaced in a net down -wind direction. Those grains that are ejected from the surface typically do so with lower energies than the incident grain, which often rebounds with increased vertical
velocity through the conversion of horizontal momentum to vertical momentum.
Consequently, this process results in grains being ejected into the airstream at vel
oci-ties lower than the threshold friction velocity. This new value is referred to as the impact or dynamic threshold velocity, ut
and is approximately 70-80% of the fluid threshold friction velocity (Figure 18.8;
Bagno ld 1941).
Grain-binding agents
In the previous section two equations were used to derive the friction and impact threshold velocities respectively, where the sand is dry, unconsolidated and on a flat bed. However, in the 'real world' such conditions seldom exist and many complicating
[image:12.598.141.579.56.289.2]Aeolian Processes and Landforms 335
factors must be considered with respect to the entrainment of fine-grained sediments by the wind, some of which are now briefly discussed.
Moisture
Surface moisture content is arguably the most important factor controlling the entrainment and transport of fine-grained sediments by the wind. Both field and wind-tunnel studies have shown that only small increases in surface moisture content can significantly increase the threshold friction velocity, as shown in Table 18.2.
Above approximately 5% surface moisture content, sand-size material mostly resists entrainment by the wind (N ickling 1994). However, some field observations have shown no discernable effect on sand transport for surface moisture contents up to 14%
(Sarre 1988), while Arens (1996) reported aeolian sand transport on a beach during
light showers of rain.
Table 18.2 Effect of surface moisture content on threshold friction velocities.
Moisture content (% volume content)
Dry
0.1
OJ 0.6
After Greeley & Iversen 1985
Bondin
g
a
g
ents
Threshold friction velocity (cm 5') for 0 ::: 400/-lm
23 35 42 47
Threshold friction velocity (cm 5-') (or 0 ::: 250/-lm
19
20 42 55
Many fine-grained beds are not always found in a dry, loose state, but are often covered by surface crusts or are bound together to form erosion resistant structural units such as clods. Principal bonding agents in these situations may include micro-organisms, solu -ble salts, silt, and clay particles. For example, sands inoculated with micro-organisms to form surface crusts have remained stable in wind-tunnel experiments for wind speeds up to 19 m s-1 (McKenna-Neuman et a1. 1995). On the Dutch coast, Van den Anker et a1. (1985) observed filamentous algae binding sand grains in coastal dune blowouts, creating a crust that stabilised the sand, particularly following prolonged calm and humid weather conditions. The algae also provided nutrients for secondary colonising plants, such as grasses. Results from this study are presented in Table 18.3. Table 18.3 Measured sand-transport rates from surface samples collected from a coastal dune blowout. The
samples were exposed to a wind speed of 9 m s·1 at 2 cm above the bed for 2 minutes.
Sample
No crust
Thin crust
Well-developed crust
After-Van den Anker et al. 1985
Sand transport mg cm-l 297.0
[image:13.595.209.553.262.337.2] [image:13.595.206.554.558.632.2]In soils used for agriculture, the presence of organic matter increases the ability of particles to form aggregates (i.e. clods). These larger particles are much less susceptible to entrainment by the wind and may provide an effective armour for the surface, thereby lowering the potential for wind erosion. Clay-rich soils can also form cohesive surface crusts following heavy rainfall. McGowan and Sturman (1997) observed clay-and silt-rich crusts on exposed fluvio-glacial lacustrine deposits at Lake Tekapo to
effectively resist abrasion by saltating sand grains, except where the crusts had become
fragmented by frost heave and needle-ice activity, or prolonged abrasion by hi gh-energy saltating sand grains.
The importance of soluble salts as binding agents was highlighted by Nickling
(1978, 1984). He observed sodium chloride (NaCI) to significantly increase the threshold friction velocity of exposed surface sediments, particularly in fine-grained beds where a greater number of solid-to-solid contacts per unit volume can form.
However, he also found that as salt concentrations increased above approximately 2.5 mg g-I of soil, precipitation of salts in pore spaces displaced some grains above the gen -eral surface. These more exposed grains or aggregates were subjected to higher fluid
drag forces and became entrained into the airstream at lower threshold friction velo
c-ities than the surrounding surface.
Vegetation and surface roughness effects
Plants, cobbles, boulders, and other non-erodible elements on a surface of erodible
particles tend to reduce entrainment of the latter by absorbing a significant part of the
wind's energy. In doing so, they increase the required u*,t for the entrainment of the smaller erodible particles lying between them. However, the distribution and density
of non-erodible elements is very important. For example, at low densities roughness
elements such as cobbles may increase erosion, owing to the development of turbulent
eddies in their lee, while at higher densities they may protect the erodible surface by vertically displacing
zoo
This largely holds true for vegetation, although over sparselyvegetated surfaces, aeolian sediment transport may still occur as the wind penetrates
the canopy, particularly during gusts. Plants also shelter the soil from the erosive force
of the wind by covering a proportion of the surface, while they may effectively filter
sediment from the airstream and protect it from re-entrainment as highlighted in
Figure 18.9. Not surprisingly, vegetation is recognised as a principal agent in the man-agement of areas susceptible to wind erosion.
Anthropogenic influences
Naturally occurring sediments released from the surface because of human actions are termed fugitive dusts. These particles may be released from the surface by numerous
human activities as listed in Table 18.4. For example, Wilshire (1980) noted that approximately 85% of natural desert surfaces were not susceptible to wind erosion. However, when human activities modify the stability of these arid lands, the potential
for wind erosion is greatly increased. Off-road-vehicle use in such reg'ions can be a si
Aeolian Processes and Landforms
surface, while cultivated land often yields 20% more dust than uncultivated land (Rehis & KihI1995).
In New Zealand, degradation of the inner montane tussock grasslands of the South Island by fire and overgrazing has left hundreds of thousands of hectares suscep-tible to wind erosion. Dust storms are often reported in the Mackenzie Basin and Cen-tral Otago, particularly during fohn nor'westers (see Figure 18.10). Blowing dust is also often observed over cultivated paddocks, particularly during spring and autumn, when both surface and meteorological conditions favour wind erosion (McGowan 1996).
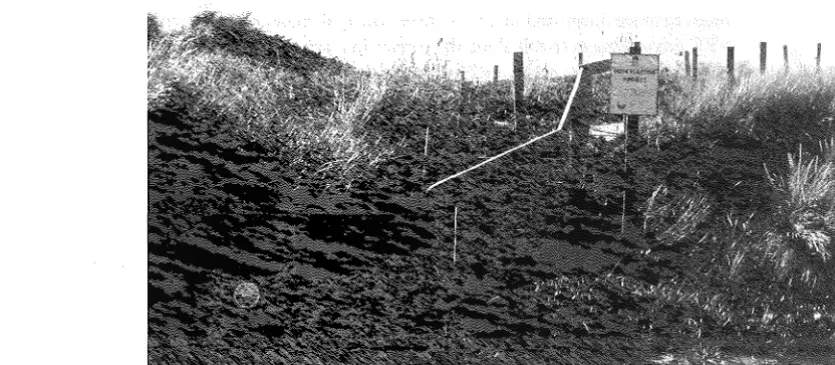
In coastal regions, the destabilisation of dune systems because of the degradation of dune vegetation by recreational users and off-road vehicles, or ill-considered urban developments and associated infrastructure, may lead to dune blowouts and sand encroachment onto roads, homes, and farmland. Destabilisation of coastal dune systems
Figure 18.9 (Left) A sand-tail highlighting the influence of vegetation on sand transport. Farewell Spit.
Figure 18.10 A dust storm in the Mackenzie Basin during May 1991 that originated from severely degraded tussock grassland.
[image:15.598.104.566.230.642.2] [image:15.598.107.584.233.389.2] [image:15.598.142.560.449.631.2]significantly reduces their natural ability to protect the hinterland from seawater
inundation, particularly during storm events (as discussed in Chapter 16). As a result,
beach access in high-use areas is now often confined to specially designed walkways,
while vehicle access onto dunes is either restricted or prohibited in many areas (Figure
18.11).
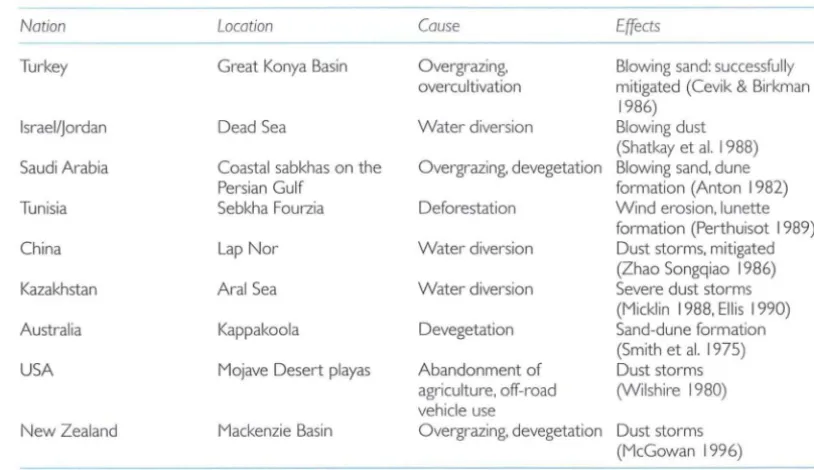
Table 18.4 Selected examples of human activity that has resulted in wind erosion.
Notion
Turkey
Israel/Jordan
Saudi Arabia
Tunisia
China
Kazakhstan
Australia
USA
New Zealand
After Gill 1996
Location Couse Effects
Great Konya Basin Overgrazing, Blowing sand: successfully overcultivation mitigated (Cevik & Birkman
1986)
Dead Sea Water diversion Blowing dust (Shatkay et al. I 988)
Coastal sabkhas on the Overgrazing, devegetation Blowing sand, dune Persian Gulf formation (Anton I 982) Sebkha Fourzia Deforestation Wind erosion, lunette
formation (Perthuisot I 989) Lap Nor Water diversion Dust storms, mitigated
(Zhao Songqiao 1986) Aral Sea Water diversion Severe dust storms
(Micklin 1988, Ellis 1990)
Kappakoola Devegetation Sand-dune formation
(Smith et al. 1975) Mojave Desert playas Abandonment of Dust storms
agriculture, off-road (Wilshire 1980)
vehicle use
Mackenzie Basin Overgrazing, devegetation Dust storms (McGowan 1996)
Modes of fine-particle transport
As the velocity of the near-surface airstream increases and u*t is exceeded, grains
begin to move downwind in one of three principal modes of grain transport. Particles
>500 )..1m will begin to roll along the surface in a process called surface creep (Figure
18.12), while smaller grains are lifted above the surface and into the airstream. Grains
ranging in size from approximately 70 to 1000 )..1m will tend to bounce downwind over the surface in saltation. Grains <70 )..1m will typically remain in suspension until they
are scavenged from the airstream by precipitation, or until their settling velocity exceeds the mean vertical velocity of the ambient airstream. For particles < 10 )..1m, this
may be several weeks after initial entrainment, by which time the suspended dust
particles may have travelled thousands of kilometres (e.g. from Australia to New
Zealand. Kidson (1929, 1930) presented accounts of the deposition of Australian-sourced dust over southern New Zealand from 6 to 10 October 1928. One resident from Winton recalled: 'Towards 4 o'clock it suddenly grew dark and there were portents of
[image:16.600.137.544.156.391.2]Aeolian Processes and Landforms 339
The principal mechanism responsible for the entrainment of dust into the
airstream is the impact of much larger saltating sand grains, which eject the finer dust
-size particles into the airstream as they impact on the surface. Dust particles are also
entrained by direct fluid and lift forces, although these processes are thought to be
much less significant. During a moderate wind storm, when the mean wind speed is
15 m s-1 and the degree of vertical mixing as indicated by the coefficient of turbulent
exchange is approximately 104 cm2 s-I, particles >20 )1m are unlikely to travel more
than about 30 km from their source, whereas particles between 10 )1m and 20 )1m may
be dispersed over a distance of 500 km (Figure 18.13) (Pye 1987). Under storm condi
-tions, when the coefficient of turbulent exchange may reach 106 cm2 s-I, 20-30 pm
dust grains could be transported over 2500 km, such as across the Tasman Sea from
Australia to New Zealand.
Turbulent ~
airstream
¢
"--V'¢
Short term suspension (20·70 flm)
Q; 40-50LI ==<1=03:;::::::=1=10~'::::,I::;:l:;:0=5 ::;1 :::;10=6=1 ~1O~7::.1,.,
Q) r
~
30-40LI ==<=1°:::3;===1°:;:4=1;
1~
05=1:;1;::
06~1:::1;;=
0:;::7 ~I
'"~ 20-30~
1-==<=
10
::::::3:::::;::==
1
::::1 °::::::4::1:;:
1=05:::;:1~1
=
0=6 ~I ~
10=
7~1,-,.,
i
1o-2o
~1
===<=10,::3 = ==;:=1 =10:::'::,:1 =1:::°5=1=1°=6 =1 =1°:::7::-1---"'-'----0-11-10LI _ _ _ _ _ ~ <103 _ _ _ __ _ __L..:"'--'--"'.--' 1 104 1 105 1 t!
'"
::Ja
I 10°
I I 102
10' 106 L(km)
Figure 18.12 (Left) Principle modes of grain transport. (After Pye 1987)
Figure 18.13 Maximum distances (L) that different-sized quartz spheres are likely to be transported for a mean
wind speed of 15 m s-I. The coefficient of turbulent exchange varies from 103 to 10 7 cm2 s-I. (After Tsoar & Pye
1987)
Aeolian deposits and bedforms
Arguably the most common features that most people associate with aeolian processes
are sand dunes. In New Zealand, active dune systems are mostly confined to coastal
areas, whereas relict dune systems can be seen on the Manawatu Plain, on glacial out
-wash surfaces in the Mackenzie Basin, and along the southern banks of large braided
rivers like the Waimakiriri and Rakaia in Canterbury. However, other aeolian-derived
deposits are no less important, such as the extensive loess deposits that cover much of
eastern New Zealand. A brief description of some common aeolian deposits and bed
-forms follows.
Loess
The deposition of dust in both geologic and historical times is responsible for the for
-mation of the extensive loess deposits that cover 5-10% of the Earth's land surface
[image:17.595.103.569.257.378.2]N
(Pecsi 1968; Pye 1987). Loess was defined by Pye (1987) as a terrestrial windblown silt deposit consisting chiefly of quartz, feldspar, mica, clay minerals, and carbonate grains in varying proportions. Volcanic shards, salts, and other minerals may also be
impor-tant constituents of loess deposits depending on location. The most extensive of these
aeolian deposits occur in China, Soviet Central Asia, Central and Western Europe,
the Great Plains of North America and Argentina, the Ukraine, and New Zealand
(Figure 18.14).
In general, the typical grain size of loess is 20--40 ~m, although significant varia-tions on this size range can occur, reflecting the strength of the local wind regime, the physical nature of the source area, and the distance from the source. In China,
approx-imately 1 x 10⁶ km2 are covered in primary or reworked loess (Liu Tung-sheng et al.
1985), with loess deposits in the Loess Plateau of Shanxi, Shaanxi, and Gansu Provinces displaying an average thickness of 80-120 m (Pye 1987). Loess deposits in
Argentina and North America are generally 20-30 m thick, although in some
loca-tions they may exceed 60 m. In New Zealand, the majority of loess deposits seldom exceed 4 m in thickness, although in Canterbury deposits of 10 m in depth exist on
Banks Peninsula and in the vicinity of Ttmaru.
The formation of loess deposits is dependent on two principal sets of variables: first, the rate of fine grain production in the source area; and second, the efficiency of the transporting medium (wind) from the source to the sink. High-latitude loesses
such as those found in New Zealand typically accumulated during colder periods (i.e. glaciations), when extensive glaciers and meltwater streams supplied an abundance of fine grained sediments to the airstream, particularly during the Pleistocene. Loess deposits may therefore provide important paleoclimatic information, particularly of
temperature and wind regimes.
..
....
· ..
G
....
·~
....
[image:18.595.164.548.399.629.2]~
:L·
-_
..
_
.. -_
..
-_ .. _
.. -_ ..
_
-
..
~·-_
.. -_ ..
_
.. -_
..
-_
.. _
..
-~·I~
.. _
..
-_
..
____
~
______
~
______
~
..
-_
..
_-
..
_
..
-_
..
_
.. -_
..
-~._
..
-_
.. -_ ..
_-
..
_
.. -_ ..
_
-
..
~
-
.
______
~
______
~
Aeolian Processes and Landforms 341
Loess deposits typically taper off downwind of the source area, forming an almost
uniform surface cover, whereas around topographic obstacles bedforms created in loess
do occur, and these have been of considerable recent debate. Typically, dust deposition was thought to be highest over lee slopes, where wind speeds are low (Leger 1990).
However, more recently wind-tunnel and field studies have shown that preferential
dust deposition may occur on windward slopes, where streamline compression in the
low-level windfield increases local dust concentrations, thereby resulting in higher
deposition rates (Goossens 1988a, 1988b, 1996; Goossens & Offer 1990, 1993). But without sufficient vegetation cover to both filter dust from the wind and to protect it from re-entrainment, loess would seldom occur. As a result, loess in such landscapes is subject to reworking by fluvial and slope activity, leading to complex erosional and depositional forms in the stratigraphy of loess deposits.
Ripples
Ripples are the smallest of aeolian bedforms and are generally classified under three principal headings: impact or ballistic ripples, that form because of the impact of saltating sand grains and resulting reptation (Bagnold 1941; Seppala & Linde 1978;
Anderson 1987; Nickling 1994); fluid drag or aerodynamic ripples, which form
where well-sorted sand is transported by strong winds (Bagnold 1941; Nickling 1994);
and megaripples or granule ripples, which are thought to form as a result of large grains travelling in surface creep (Bagnold 1941; Sharp 1963; Nickling 1994).
Ripples are in general aligned perpendicular to the wind, with wavelengths of between a few centimetres to tens of metres, and crest heights that may vary from 0.01
m to 0.5 m. Sand size typically determines wavelength and ripple height, with ripples in fine grained sand more closely spaced than those in coarse sands. Ripples have gen-tle windward slopes in the range of 8-13 0 and lee slopes that are slightly steeper, with
angles up to approximately 30° (Werner et at. 1986). The crest of ripples is typically coarse grained, while trough sediments are dominated by fine grains as shown in Fig-ure 18.15. The exact process for this sorting of grain size of ripples is not certain,
although it appears that the impact of saltating grains on the windward slope of the ripple eject more fine than coarse grains, so coarsening the windward surface and ripple crest (Anderson & Bunas 1993).
Dunes
Dunes are the most impressive of all aeolian bedforms. Livingstone and Warren
(1996) defined them as aeolian features between about OJ m and 400 m high and
between 1 m and 500 m wide, consisting of 'loose' sediment that is moved grain by
grain. They may begin to form around slight irregularities in the surface, or around
topographic obstacles. In general, dunes can be classified into six major types as shown
in Figure 18.16, although many variations of these main dune morphologies can be
observed, including the formation of smaller secondary dunes superimposed on the
stoss slope of the primary dune.
Barchan dunes usually occur in two main areas: on the periphery of sand seas,
a) b)
c)
[image:20.598.108.554.64.315.2]e)
Figure 18.1 5 (Left) Sinuous sand ripples on a glacio-fluvial outwash surface.
Figure 18.16 (Right) Major dune types: (a) barchan, (b) barchaniod or crescentic ridges, (c) linear, (d) star,
(e) reversing, (I) parabolic. (After McKee 1979)
associated with unidirectional wind regimes and tend to be nearly symmetrical, with a
single slipface located between two horns as shown in Figure 18.16a. Like other
cres-centic dunes, barchans are characterised by high rates of erosion on the stoss slopes
and deposition on the lee. Consequently, this pattern of erosion and deposition leads to the migration of the dune downwind. Barchan dunes can range in height from 0.3
m to 10 m, although occasionally they may exceed 50 m (Nickling 1994). Their width
(measured from horn to horn) can vary greatly but is generally approximately 10 times the dune's height.
Barchanoid ridges form because of the coalescence of several barchans in regions
of greater sand supply than where single barchan dunes are found. Barchanoid ridges
are usually aligned perpendicular to the dominant unidirectional wind regime (Figure 18.16b). Their morphology is characterised by sinuous ridge crests that display al
ter-nating barchanoid and linguoid forms when present in multiple ridges, as shown in
Figure 18.17. Transverse dunes may subsequently form at even higher rates of sand supply.
Linear dunes are ridges of sand that tend to be aligned parallel to the dominant
wind direction (Figure 18.16c). They can range in size from 0.2 km wide and 5-20 km long to 0.3-2.7 km wide and 190 km long (Nickling 1994). According to Lancaster
(1982), they are the most common of all dune forms and cover approximately half to
two-thirds of all sand seas. Linear dunes usually form multiple symmetl'ical or slightly
Aeolian Processes and Landforms
(a) (b) (c)
Figure 18.17 Schematic representation of barchaniod ridges showing (a) linguoid and barchanoid forms, (b) barchaniod ridges in oblique and (c) plan views. (After Cooke & Warren 1973)
gravelly, rocky, or even vegetated areas. Their crests may be either rounded, as found on many Australian linear dunes, or sharp, like those of the Sinai and Namib Deserts. Narrow, closely spaced linear dune ridges may merge to form 'Y' or tuning-fork junc-tions, which seem to reflect the dune field's response to changes in sediment supply and/or substrate type (Lancaster 1995). Linear dunes are usually associated with regions that experience wide-angle unidirectional or bidirectional wind regimes.
Star dunes as the name suggests, are characterised by three or four arms that radi-ate from a central peak, thereby forming a star shape (Figure IS.16d). They may reach heights in excess of 300 m and widths of 3000 m, and are commonly found in areas of significant sand deposition that experience complex wind regimes. As a result, the orientation of the dunes' arms are thought to reflect the principal sand transporting winds of a region. The lower slopes of star dunes form a wide undulating plinth with a slope of 5-10°, while the upper slopes of star dunes are quite steep with slope angles of 15-30° (Lancaster 1995). Star dunes may form singly, in chains, or in clusters, often along the poleward margins of sand seas where there are pronounced changes in the seasonality of the regional wind region.
Reversing dunes (Figure lS.16e) can be regarded as a type of transverse dune that is primarily controlled by diametrically opposed winds (Livingstone & Warren 1996). For example, in the Great Sand Dunes of Colorado they have formed because of anabatic and katabatic winds generated by the Sangre de Cristo Mountains and the regional westerlies (Andrews 19S1). In general, the sand transport from one direction will dominate, thereby resulting in a complex pattern of smaller slipfaces superim-posed on those associated with the dominate wind direction.
[image:21.595.160.556.60.168.2]Modifier
Open
Closed
Unfilled; partially filled; filled
:YDD
Merged
1)
Superimposed
0
Morphology
Slipface convex downwind; wings pointing upwind
Wings joined by a semicircular back ridge
Occurence
Areas of sufficient sand supply and winds to form dunes
Areas where vegetation is abundant
Area between wings Areas of ample
and head filled to sand supply varying degrees
with sand
Two or more dunes Areas of high attached and active dune density simultaneously
[image:22.595.214.524.62.262.2]Dunes overriding Areas of high one another dune density
Figure 18.18 Parabolic dune forms. (After Wolfe and David 1997)
Sand seas and dunefields
Origin
Moisture and/or vegetation
are primary influences on dune morphology
Ridge formed behind deflation depression by vegetation trapping sand
Filled according to amount of available
sand
Simultaneous dune activity
Successive dune activity
Sand seas, or ergs, are depositional sinks for both regional and local-scale sand
trans-port. They contain large volumes (km3) of aeolian sand, together with local interdune
and extradune fluvial, marine, and lacustrine sediments (Lancaster 1995). Wilson
(1972) estimated that 99.8% of aeolian sand is found in ergs larger than 125 km2, and
that 85% is found in ergs larger than 32000 km2, the largest being the Rub al Khali in
Saudi Arabia, which has an area greater than 560000 km2 (twice the area of New Zealand).
The global distribution of sand seas indicates two preferred geologic settings for
formation: tectonically stable desert regions such as the Sahara, Arabian Peninsula,
Australia, and southern Africa; and enclosed basins (i.e. Central Asia), where annual
precipitation is usually less than 150 mm. Topographic obstacles such as mountain
ranges may also lead to the formation of sand seas, either upwind or downwind of the
barrier. For example, the Fachi- Bilma Erg in the southern Sahara has formed in the lee
of the Tibesti Mountains, where the northeast trade winds converge in the lee of this
obstacle (Mainguet & Callot 1978). The Great Sand Dunes of Colorado have, how-ever, formed upwind of the Sangre de Cristo Range and are prograding into the
domi-nate wind (Fryberger & Ahlbrandt 1979).
The morphology and genesis of sand seas are strongly influenced by climate,
par-ticularly local and regional wind and precipitation regimes. Wind speed and direction
are not only responsible for the morphology of the dunes present in sand seas, but also
the supply of sand to the sand seas via transport corridors. In the Sahara and Arabian
Peninsula these pathways are characterised by sand-choked river valleys, sand streaks
Aeolian Processes and Landforms 345
(Breed et a1. 1979; Mainguet 1984). Many of the existing sand seas have formed over the last 10L 105 years in response to climate change and the gradual onset or cessation
of aridity in different regions, with its direct and indirect effects on aeolian processes.
Coastal dune systems
To most New Zealanders the most obvious aeolian landforms are coastal sand-dune
systems. Coastal dunes act as buffers that supply sand to the beach when it is starved of sand, while they take up sand when it is being supplied at a greater rate than the beach alone can absorb. The nature of these dune systems depends on a complex interaction between littoral and aeolian processes, such as the supply of sand by marine processes to the beach from source areas. Subsequent transport of sand from the beach to the dune system is primarily controlled by the grain size of the beach sediments, the local
wind regime, and beach width and slope. Where the supply of sand to the coast is ade-quate to form dunes and the coastal vegetation cover is sufficient to trap and bind the sand, a foredune will develop that may form an almost continuous ridge along the coast. The height of this dune is linked to the supply of sand, the ability of the vegeta-tion to continue to trap sand, and the frequency with which the foredune is destroyed by erosion, as may occur during storms. Human actions also affect coastal dune sys-tems by degrading their 'protective' vegetative cover. A consequence of such actions as burning or off-road driving over coastal dunes can be dune blow-outs and the
result-ing advance of sand onto the coastal hinterland. This can lead to the formation of par-abolic dunes that advance inland, burying fences and roads and occasionally threatening coastal dwellings. On prograding coastlines, several relict dune ridges may exist behind the active foredune system with interdune lakes between them, as can be observed along much of the Manawatu coast. If the supply of sand to the beach and foredune system exceeds the system's ability to absorb it, transgressive dunes will form that will migrate inland until their supply of sand is exhausted and/or they become fixed by the binding influence of vegetation. Table 18.5 presents a classification
scheme for the status of coastal dune systems based on the contemporary nature of the beach and dune sand budgets. For much more extensive reviews of coastal aeolian processes, the reader is referred to Hesp (1988) and Sherman and Bauer (1993).
Table 18.5 Sherman and Bauer's (1993) classification scheme of contemporary coastal dune systems based on
the status of the beach and dune sand budgets.
Beach sand budget
Positive Positive Positive Steady state
Steady state
Steady state
Negative
Negative
Negative
Dune sand budget
Positive Steady state Negative Positive Steady state
Negative Positive
Steady state
Negative
Morphology
of
coastal dune systemBeach or dune ridges Indeterminate
Blowouts and deflation hollows
In situ dune growth
Indeterminate
Blowouts and deflation hollows Dune growth and onshore migration
Indeterminate
[image:23.595.198.554.516.636.2]Other aeolian features
Nebkha are dunes that are anchored to plants (Figure 18.19). They can be found along most sandy coastlines, on valley floors, and in most semi-arid regions of the
world. Nebkha form around clumps of vegetation that act as sediment traps. If the
plants, or sometimes even trees, can continue to grow through the accumulating sand,
the nebkha will continue to develop. According to Hesp (1979), such plants must be
at least 0.10-0.15 m high to initiate nebkha development.
Lunettes are low-relief crescentic dune forms that are typically associated with
the coasts of pans and alluvial outwash surfaces. They tend to be composed mostly of clay- and silt-size sediment, although some may contain sandy layers and salts. They
form as clays (and possibly salts) that are usually carried in suspension by the wind but
instead form aggregates. These small pellets subsequently travel by surface creep and/or saltation, forming dunes downwind of the source. Precipitation subsequently
causes the clay pellets to disaggregate and bond, forming the lunettes. Consequently, lunettes are the product of a semi-arid rather than arid environment, and often
expe-rience multiple phases of formation. As a result, they can be a valuable source of cli
-matic information used for identifying wet and dry periods (Livingstone & Warren 1996).
Ventifacts are produced by the bombardment of sand grains onto larger clasts
that are typically of pebble size but may occasionally include boulders. This abrasion of pebbles and cobbles leads to the smooth faceting of their surface (Figure 18.20). The
most productive ventifact producing environments tend to be associated with cool
temperatures and strong winds-polar, periglacial, and alpine settings-where large
high-energy sand grains are transported in saltation and effectively sandblast the exposed surfaces of the larger clasts, forming ventifacts.
Stone pavements of aeolian origin are the product of deflation, where the finer
-grained sediments have been removed from the surface by the selectivity of the airstream. This produces an armoured surface of coarse-grained sediments, or lag, that protects the underlying sediments from deflation by the wind. Such surfaces are found in many environments, including deserts, Arctic, periglacial, and alpine regions
(Figure 18.21).
[image:24.595.146.554.487.631.2]Aeolian Processes and Landforms 347
Figure 18.21 A 'stone pavement surface on the exposed Godley River Delta, Lake Tekapo.
Summary
Although historically overshadowed by other fields of geomorphological inquiry, aeo-lian processes and landforms form an integral component of the physical
environ-ment. Coastal dune systems extend along many kilometres of our coastline, and most of us have had sand blown in our face while at the beach, or dust from building sites and driveways on windy days. These phenomena all result from the complex interac-tion of the wind with exposed surface sediments, and may either be enhanced or ame-liorated by both natural and anthropogenic factors. A brief review has been presented
here of the principal aeolian processes and landforms to be observed both within New Zealand and internationally.
Further reading
Basher, L.R. & Painter, D.J. 1997, 'Wind erosion in New Zealand', Proceedings of the Wind Erosion: An Intemational Symposium/workshop, Manhattan, Kansas.
Cooke, R.U. & Warren, A. 1973, Geomorphology in Deserts, University of California Press, Berkeley.
Greeley, R. & Iversen, J.D. 1985, Wind as a Geological Process, Cambridge University
Press, Cambridge.
Lancaster, N. 1995, Geomorphology of Desert Dunes, Routledge, London.
Li, X., Maring, H., Savoie, D., Voss, K. & Prospero, J.M. 1996, 'Dominance of mineral
dust in aerosol light-scattering in the North Atlantic trade winds', Nature, vol. 380,pp.416-19.
[image:25.595.196.556.60.255.2]McOuigan, EJ. 1989, Wind erosion on the Canterbury Plains, October 1988, Unpub-lished report to North Canterbury Catchment Board and Regional Water Board, Christchurch.
Nickling, W.O. 1994, 'Aeolian sediment transport and deposition', in K. Pye (ed.)
Sediment Transport and Depositional Processes, Blackwell, Oxford. Pye, K. 1987, Aeolian Dust and Dust Deposits, Academic Press, London.