Persistence of pro-arrhythmic spatio-temporal calcium
patterns in atrial myocytes: a computational study
of ping waves
Rüdiger Thul1*, Stephen Coombes1and Martin D. Bootman2,3
1
School of Mathematical Sciences, University of Nottingham, Nottingham, UK
2
Laboratory of Signaling and Cell Fate, The Babraham Institute, Cambridge, UK
3
Department of Life, Health and Chemical Sciences, The Open University, Milton Keynes, UK
Edited by:
Mohsin Saleet Jafri, George Mason University, USA
Reviewed by:
Eric A. Sobie, Mount Sinai School of Medicine, USA
Mohsin Saleet Jafri, George Mason University, USA
*Correspondence:
Rüdiger Thul , School of Mathematical Sciences, University of Nottingham, Nottingham NG7 2RD, UK. e-mail: ruediger.thul@ nottingham.ac.uk
Clusters of ryanodine receptors within atrial myocytes are confined to spatially separated layers. In many species, these layers are not juxtaposed by invaginations of the plasma membrane (transverse tubules; ‘T-tubules’), so that calcium-induced-calcium signals rely on centripetal propagation rather than voltage-synchronized channel openings to invade the interior of the cell and trigger contraction. The combination of this specific cellular geometry and dynamics of calcium release can lead to novel autonomous spatio-temporal calcium waves, and in particular ping waves. These are waves of calcium release activity that spread as counter-rotating sectors of elevated calcium within a single layer of ryan-odine receptors, and can seed further longitudinal calcium waves. Here we show, using a computational model, that these calcium waves can dominate the response of a cell to electrical pacing and hence are pro-arrhythmic. This highlights the importance of modeling internal cellular structures when investigating mechanisms of cardiac dysfunction such as atrial arrhythmia.
Keywords: atrial myocyte, Ca2+
signaling, arrhythmia
1. INTRODUCTION
The most common form of cardiac dysrhythmia in humans is “atrial fibrillation.” This pathology arises when electrical impulses occur spontaneously, and with high frequency, from sites around the atria (typically 350 discharges per minute compared to the nor-mal sinoatrial rhythm of 60–80 beats per minute;Dobrev, 2010). Due to these irregular electrical discharges, the atria do not dis-play coordinated contractions required to propel blood into the ventricles. Consequently, the blood pumping capacity of the heart can be reduced by up to a third (Alpert et al., 1988). Given that ventricles can refill substantially without atrial participation, atrial fibrillation is typically not immediately life threatening. However, the loss of atrial contraction can be debilitating when greater output from the heart is required, for example during physical exertion. A further complication associated with atrial fibrilla-tion is thromboembolism due to the stagnafibrilla-tion of blood within the atrial chambers. With respect to human health, it is estab-lished that the incidence of atrial fibrillation increases with age, and∼15% of strokes occur in people with atrial fibrillation. It is
therefore clear that coordinated atrial function is very important. Substantial evidence points to dysregulation of calcium (Ca2+
) signaling as being a causal factor in genesis and maintenance of atrial fibrillation (Hove-Madsen et al., 2004;Dobrev and Nattel, 2008;Yeh et al., 2008;Wakili et al., 2010;Greiser et al., 2011).
Ca2+ is the key regulator of heart contraction (Bers, 2008). Each heart beat is associated with fluxes of Ca2+
across the car-diac myocyte plasma membrane, the sarcolemma, and from the internal Ca2+
store, the sarcoplasmic reticulum (SR). Cardiac
excitation-contraction coupling (EC-coupling) is initiated by an action potential that sweeps from the sinoatrial node, the pace-making region of the heart. When the depolarizing action potential reaches individual myocytes it causes depolarization of their sar-colemma leading to activation of L-type voltage-operated Ca2+ channels (VOCs), and consequently a brief influx of Ca2+
. The Ca2+
influx through VOCs provides a trigger signal to provoke more substantial Ca2+
release from closely apposed ryanodine receptor (RyR) clusters on the SR, by a process known as Ca2+ -induced Ca2+
release (CICR;Callewaert, 1992; Roderick et al., 2003). Activation of RyRs leads to the generation of elementary Ca2+
signals known as a Ca2+
sparks. These microscopic signals essentially reflect the simultaneous activation of a cluster of RyRs by CICR (Cheng et al., 1993;Cannell et al., 1995;Rios, 2005). The spatial overlap and temporal summation of signals from multiple Ca2+
spark sites underlies the rapid homogenous Ca2+
transients that trigger coordinated ventricular myocyte contraction (Cannell et al., 1995;Bootman et al., 2001;Guatimosim et al., 2002).
EC-coupling in atrial myocytes is substantially different from that in ventricular cells (Bootman et al., 2006). In most species, atrial cells lack the T-tubule invaginations of the sarcolemma found in ventricular myocytes (Brette and Orchard, 2003), and therefore express VOCs only on the sarcolemma surrounding the cells (Bootman et al., 2011). The distribution of RyRs in atrial cells is similar to that in ventricular myocytes, but with the important exception that only a small fraction of the RyRs (the junctional RyRs) are positioned to respond to the opening of the VOCs (Carl et al., 1995;Mackenzie et al., 2001). Ca2+
therefore originate around the periphery of the cells and are locally amplified by the junctional RyRs.
Under control conditions, this peripheral Ca2+signal does not propagate fully, or at all, into the center of an atrial cell. This means that at the peak of the response, substantial Ca2+
gradients can be observed (Berlin, 1995;Mackenzie et al., 2001;Woo et al., 2002;
Sheehan and Blatter, 2003). However, in addition to the junc-tional RyRs, atrial myocytes have a regular 3-dimensional lattice of “non-junctional” RyR clusters, which pervade the entire cyto-plasmic compartment (Chen-Izu et al., 2006). It could be expected that the subsarcolemmal Ca2+
signal arising from the junctional RyRs would be sensed and amplified by the non-junctional RyRs via CICR. In this way, the trigger Ca2+
signal in the cell periphery could lead to centripetal propagation of a Ca2+wave and complete engulfment of the cell. However, in the absence of inotropic stim-ulation, the non-junctional RyRs in the center of atrial myocytes are largely non-responsive. This is due to a 2µm gap in expression of RyRs between the junctional and non-junctional RyRs and cel-lular buffering mechanisms that inhibit inward propagation of the Ca2+
signal (Mackenzie et al., 2004). To stimulate contraction, the Ca2+
signal has to overcome the buffers and invade the cell center where the bulk of myofilaments exists (Bootman et al., 2006).
To explore the factors controlling Ca2+
homeostasis and signal-ing in atrial myocytes, we have developed a mathematical model based on the established geometry of the cells (Thul et al., 2012). The model incorporates multiple discrete Ca2+
release sites within the volume of thein-silico myocyte that have the same defined spacing as in a real atrial cell. The movement of Ca2+
within the atrial myocyte model, and the triggering of Ca2+
release is based on realistic terms for Ca2+fluxes and diffusion. We previously val-idated the model by recapitulating the centripetal propagation of Ca2+
waves observed under physiological stimulation conditions. Moreover, we examined the impact of inotropic stimulation on Ca2+
movement, and were able to unravel the contributions of fac-tors such as SR Ca2+
load, RyR sensitization, and increased VOC activity to spatio-temporal Ca2+
wave propagation (Thul et al., 2012). In addition to replicating physiological patterns of Ca2+ movement, the model demonstrates the potential for developing spontaneous Ca2+
signals, which could have a pro-arrhythmic capacity in the heart. One such arrhythmic Ca2+
pattern that emerges is a self-sustaining, rotating Ca2+wave that we termed a “ping wave.” Ping waves are particularly interesting in that they require conditions of relatively low Ca2+
flux – akin to the sit-uation in heart failure where RyR and Ca2+
pump expression significantly declines (Goldhaber and Bridge, 2009). Ping waves are dependent on perpetual Ca2+release within a discrete region of an atrial myocyte, but are ultimately able to trigger repeti-tive Ca2+
waves throughout the volume of the cell. We believe that ping waves may represent a hitherto unseen form of sponta-neous Ca2+
release that is unavoidable under certain stimulation conditions due to the geometry of atrial myocytes. As yet, ping waves have not been visualized using experimental techniques because they are beyond the scope of current imaging technol-ogy. In this study, we present further characterization of ping waves. We demonstrate their robustness in the face of electrical pacing, and their sensitivity to the refractory state of the underlying RyRs.
2. MATERIALS AND METHODS
We employ a recently developed three-dimensional model of an atrial myocyte (Thul et al., 2012). The spatio-temporal dynamics of the cytosolic Ca2+
concentrationc(r,t) is governed by
∂c
∂t =D1c−
c
τ +
X
n∈0 X
m∈N
δ (r−rn) η t−Tnm
, (1)
whereDdenotes the effective cytosolic diffusion coefficient andτ represents the sequestration time scale of the SERCA pumps. Ca2+ release from the SR into the cytosol occurs at discrete positionsrn,
n∈0. The time at which thenth release site opens for themth
time is given byTnmand is implicitly defined by
Tnm =inf
t |c(rn,t) >cth, Tnm>Tnm−1+tref . (2)
Ca2+
release occurs when the cytosolic Ca2+
concentration is above a threshold value cth, and there is at least a refractory periodtrefbetween consecutive release events. The exact shape
of the Ca2+
release current is captured by the functionη,which we here take as piecewise constant, i.e.,η(t)=σH(t)H(trel−t).
The Ca2+
release strength is measured byσ, and the Heaviside functionH, which is zero for negative arguments and 1 otherwise, ensures that release occurs over a period oftrel. We solve equation
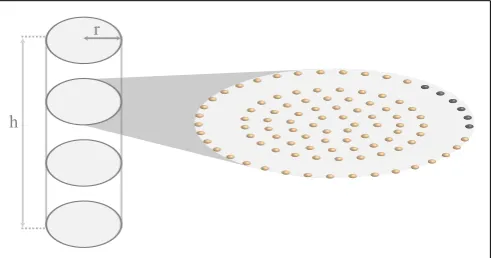
(1) in a cylinder of lengthh=100.4µm and radius ofa=6µm, consistent with the actual shape and size of an atrial myocyte (Bootman et al., 2011). Ca2+
release is restricted to planes that are perpendicular to the longitudinal axis of the cylinder and are separated by∼2µm. Within each of these so-called z-planes, RyRs
are arranged in a circular pattern as shown inFigure 1. The dis-tance between RyRs within a single ring and between the four inner rings is∼1µm. The gap between the peripheral RyRs and
the non-junctional Ca2+
release sites measures∼2µm and
corre-sponds to the experimentally observed lack of expression of RyRs (Bootman et al., 2011).
r
[image:2.595.304.550.481.610.2]h
To mimic periodic pacing we elevate the Ca2+
concentration of a given fraction of peripheral RyRs above threshold at each pac-ing event. We keep this initial fraction constant from pacpac-ing event to pacing event, but we randomize the position of the activated peripheral Ca2+
release sites with each pacing event.
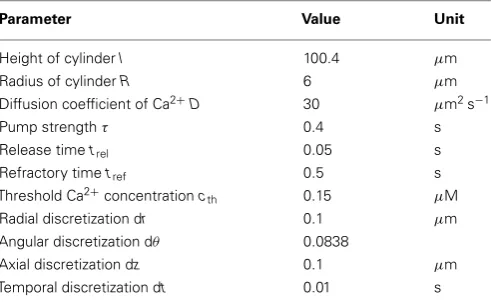
We refer the reader to section 4 for a more detailed discussion of the model. The default parameter values for all simulations are listed inTable 1.
3. RESULTS
Following each systolic Ca2+
transient RyRs are refractory for a period of time (DelPrincipe et al., 1999;Terentyev et al., 2002;
Szentesi et al., 2004; Sobie et al., 2005; Ramay et al., 2011;
Kornyeyev et al., 2012). This refractoriness is believed to be essen-tial for myocytes to reset their EC-coupling machinery in time for the next heart beat. Consistent with this notion, our previ-ous study (Thul et al., 2012) identified the refractory period of RyRs as a key determinant of the fidelity of centripetal Ca2+waves or pro-arrhythmic Ca2+
signals. Essentially, the duration of the refractory period determines when RyRs are available for acti-vation following a previous stimulation. If the refractory period is relatively short, then a cell may not have sufficient time to reduce cytosolic Ca2+
, and RyRs can be spontaneously activated as soon as they emerge from their refractory state. This situation would be pro-arrhythmic. Whilst the refractory period is vital, it is co-dependent on other factors that determine the sensitiv-ity of RyRs to Ca2+
and the amount of Ca2+
released. This is exemplified inFigure 2, which illustrates the interplay between refractory period and release strength in controlling the fidelity of Ca2+
signals in a paced atrial myocyte. Figure 2A shows a paced model atrial myocyte under control conditions. Each pacing event is indicated by a diamond symbol and initiates a centripetal Ca2+
wave, akin to those observed in contracting myocytes (Bootman et al., 2011). The centripetal Ca2+waves are evident as vertical lines in the top panel that align with the dia-monds below. For the parameters used inFigure 2A, the refractory period is sufficiently long that the residual Ca2+
concentration falls below the threshold value for triggering Ca2+
[image:3.595.46.292.564.715.2]liberation when the RyRs exit the refractory period. Hence, cells require repet-itive pacing to trigger subsequent Ca2+ waves. Shortening the
Table 1 | Default parameter values for simulations.
Parameter Value Unit
Height of cylinderl 100.4 µm Radius of cylinderR 6 µm Diffusion coefficient of Ca2+D 30 µm2s−1
Pump strengthτ 0.4 s
Release timetrel 0.05 s
Refractory timetref 0.5 s
Threshold Ca2+
concentrationcth 0.15 µM
Radial discretization dr 0.1 µm Angular discretization dθ 0.0838
Axial discretization dz 0.1 µm
Temporal discretization dt 0.01 s
refractory period allows RyRs to emerge from their refractory state whilst the ambient Ca2+
concentration is sufficiently high to cause their spontaneous activation. Figure 2Bshows such a situation – after the first pacing event autonomous Ca2+
waves are triggered and become the sole subsequent activity (note the mismatch between the diamond symbols and the Ca2+
waves). The initiation of the unpaced Ca2+
waves is due to the super-critical value of the residual Ca2+
concentration when the RyRs emerge from being refractory. Keeping the same value of the refractory period as inFigure 2B, we can restore externally trig-gered Ca2+
waves by lowering the release strength as illustrated inFigure 2C. These results demonstrate that for a given release strength, there is a minimum refractory period below which autonomous Ca2+ waves occur. The larger the release strength, the longer is the time window for initiating stimulus-independent Ca2+
waves.
Another manifestation of self-sustaining, spontaneous Ca2+ waves that derives from the specific geometry of atrial myocytes occurs within a single z-plane under appropriate conditions of refractory period and Ca2+
release strength. Specifically, the lim-ited recruitment of a few RyR clusters triggers a perpetual, rotating Ca2+
ping wave within a z-plane (Thul et al., 2012). An example of such a ping wave is depicted inFigure 3. In the example shown, the ping wave initiates from 6 adjacent RyR clusters (Figure 3A). As time progresses two counter-rotating sectors of Ca2+ release activity emerge, sweeping from one side of the z-plane to the other (Figures 3B–G). The time it takes for one of the sectors to traverse half the z-plane equals the sum of the release duration and the refractory period (0.37 s), so that Ca2+
release reinitiates at one side of the z-plane as soon as the sectors reach the opposite side (cf.Figures 3A,Hatt=0.02 s andt=0.38 s, respectively).
Although ping waves occur within a single z-plane, their influ-ence is not restricted to that domain of the cell. Rather, they have the capacity to trigger longitudinal Ca2+
waves that pervade the entire cellular volume.Figure 4illustrates how a ping wave perpet-ually rotating within a single plane can seed repetitive longitudinal Ca2+
waves. The ping wave is clearly visible as the light bluish ribbon running along the center of the Figure. Emanating from the ping wave activity are diagonal rays of elevated Ca2+
activity that correspond to longitudinal Ca2+
waves. The only stimulus required for all the Ca2+activity evident inFigure 4was the ini-tial triggering of 6 peripheral RyR clusters (as inFigure 3A). All subsequent activity resulted from that initial spatially-restricted RyR activation. In a myocyte where all RyRs have the same refrac-tory periodtref, longitudinal Ca2+waves also exhibit periods with
durationtref. The perpetual, ping wave Ca2+release activity only
occurs in the central z-plane. In all other z-planes, there is a clear quiescence phase between consecutive longitudinal waves. In the remainder of this paper, we will address the robustness of ping waves, especially with respect to physiologically relevant pacing conditions.
In the first step, we examined how changing the refractory period of RyRs affected either the existence of ping waves, or the seeding of longitudinal Ca2+
10 20 30 40 50
z−plane
0 20 40 60 80
0 2 4
time (s) 0 time (s)2 4
10 20 30 40 50
z−plane
0 20 40 60
0 2 4
time (s) 10
20 30 40 50
z−plane
0 20 40 60 80
[image:4.595.47.553.58.171.2] [image:4.595.45.547.218.369.2] [image:4.595.304.549.421.619.2]A B C
FIGURE 2 | Paced myocyte with an initial fraction of 0.2 for different combinations of release strength and refractory period:σ=15µMµm3
/s,
tref=1.4 s (A),σ=15µMµm3/s,tref=1 s (B),σ=13µMµm3/s,tref=1 s
(C).Each stimulation is indicated by a diamond symbol. Warm colors indicate substantial Ca2+
release site activity, while cool colors correspond to lesser Ca2+release activity. Other parameter values are as inTable 1.
A B C D
E F
G H
FIGURE 3 | Ping wave with a refractory periodtref=0.32 s
and release strengthσ=8.5µMµm3
/s shown at different time points.The eight panels cover one revolution of the ping wave. Time increases from(A–H)ast=0.02 s(A), 0.09 s(B),
0.14 s(C), 0.20 s(D), 0.29 s(E), 0.33 s(F)0.36 s(G)and 0.38 s(F). The triangular shape of the Ca2+
concentration profiles is for illustrative purposes only. Other parameter values as inTable 1.
longitudinal Ca2+
waves. As soon as the RyRs outside the cen-tral z-plane exit the refractory period, the ping wave triggers the longitudinal Ca2+
wave. Increasing the refractory period further (Figures 5B,C) yields similar results. Essentially, ping waves are a perpetual trigger for CICR. They can persist in isolation until RyRs in neighboring z-planes recover from being refractory. The small mismatch of the refractory period in the z-plane of the ping wave and the rest of the myocyte inFigure 5Aleads to longitu-dinal Ca2+
waves that begin at different phases of the ping wave, indicating that ping waves can seed longitudinal Ca2+ waves at any point of their rotation.
The robust initiation of longitudinal Ca2+
waves makes ping waves a prime candidate to induce arrhythmias. However, the results inFigures 3–5considered a situation where cells are elec-trically silent. In the context of the heart, they would be receiving electrical pacing from the sinoatrial node. As we have demon-strated (Bootman et al., 2011; Figure 2), physiological pacing provokes centripetal Ca2+
waves to drive contraction. We therefore examined what would happen to pacing-evoked centripetal Ca2+ waves if they were triggered in a myocyte that had an established ping wave. We use the same initial conditions as inFigure 5to generate a ping wave, and after a fixed delay trigger the activation of the peripheral RyRs to simulate electrical pacing. The outcomes
0 0.5 1 1.5 2
10 20 30 40 50
time (s)
z−plane
0 20 40 60 80
FIGURE 4 | Ping wave and longitudinal Ca2+waves for the parameter
values in Figure 3.The ping wave is triggered by initially elevating the Ca2+ concentration above threshold at the six release sites colored black in
0 1 2 10
20 30 40 50
time (s)
z−plane
0 20 40 60 80
0 1 2
10 20 30 40 50
time (s)
z−plane
0 20 40 60 80
0 1 2
10 20 30 40 50
time (s)
z−plane
0 20 40 60 80
[image:5.595.46.551.57.169.2]A B C
FIGURE 5 | Ping wave initiated as in Figure 4 with a mismatch in the refractory period.The refractory period in the central z-plane is 0.34 s, while tref=0.4 s(A), 0.8 s(B), and 1.2 s(C)in the rest of the cell. Warm colors
indicate substantial Ca2+
release site activity, while cool colors correspond to lesser Ca2+
release activity. Other parameter values as inTable 1and σ=8.5µMµm3/s.
of beginning pacing 1.5, 1.7, and 1.9 s after initiating a ping wave are shown inFigure 6. The responses include a complex mixture of ping waves, longitudinal Ca2+
waves and centripetal Ca2+ waves. The ping wave is evident as the bluish band running through the middle of the plots. The longitudinal Ca2+waves run diagonally, whereas the pacing-evoked centripetal Ca2+
waves are vertical. Unlike the pattern shown inFigure 2, the centripetal Ca2+
waves do not invade the entirety of the cell. When a longitudinal Ca2+ wave and centripetal Ca2+
wave meet they annihilate each other, and Ca2+
release activity is abruptly terminated. However, since the ping wave is still active, further longitudinal Ca2+waves are triggered. The plots inFigure 6show a progressive change in the response of the cell as the longitudinal Ca2+
waves become pro-gressively more dominant over the centripetal Ca2+
waves. Since the pacing period is longer than the refractory period, the longi-tudinal Ca2+wave can travel further through the cell before the next pacing stimulus is applied. Therefore the longitudinal Ca2+ wave and centripetal Ca2+
wave meet and annihilate closer to the edge of the cell. This pattern keeps on repeating, until the longitu-dinal Ca2+
wave eventually reaches the top and the bottom of the myocyte, rendering all future pacing events ineffective. Increas-ing the pacIncreas-ing periodtpdoes not change this behavior. A larger
value oftponly results in a smaller number of centripetal Ca2+
waves before a fully developed longitudinal Ca2+
wave occurs. For example, inFigure 6A, there are 4 evident centripetal Ca2+ waves, while only two such waves occur inFigure 6Bcompared to one inFigure 6C. Note that shortening the initial delay yields qualitatively similar results (data not shown). At the core of these outcomes is the ping wave solely rotating within its z-plane and seeding the longitudinal Ca2+
waves. Remarkably, this spatially restricted perpetual Ca2+
release is able to entrain all RyRs and make the cell insensitive to electrical pacing.
The mechanism by which electrical pacing fails to elicit a response once a ping wave has given rise to a fully developed lon-gitudinal Ca2+
wave is illustrated inFigure 7A. It shows a cartoon of a ping wave (gray solid horizontal line) and the longitudinal Ca2+
wave (gray solid diagonal lines). At the time indicated by the asterisk, peripheral release sites are stimulated as would be the case for electrical pacing. At this point, the longitudinal Ca2+
wave has reached the z-planes marked by the two green dots. The RyRs that lie between the central z-plane and the currently responding z-planes (red solid line) cannot liberate Ca2+
because they are still refractory due to the actual longitudinal Ca2+wave (dashed red
lines). The RyRs that are located above and below the green dots have not yet recovered from refractoriness induced by the previous longitudinal Ca2+
wave (dashed black lines). The only channels that are ready to respond are those in the two z-planes indicated by the green dotes. However, such localized activity does not sig-nificantly perturb the Ca2+
flow of the longitudinal Ca2+ wave, hence rendering the external stimulation ineffective.
The results presented above indicate the robustness of ping waves in the face of electrical pacing. A key question is how such pro-arrhythmic activity could be quashed once initiated. Once again, the refractory period plays a critical role. Altering the refrac-tory period can affect the sustainability of ping waves and their ability to trigger longitudinal Ca2+
waves. If the refractory period is too long, then ping waves will die out. The simple reason is that the Ca2+
concentration will decline substantially once a ping wave has traversed its z-plane so that there is an insufficient trigger to initiate another event. An example of the significance of the refrac-tory period in altering ping wave activity is depicted inFigure 7B. At the beginning of the plot ping waves and their consequent longi-tudinal Ca2+
waves are evident. Since the longitudinal Ca2+ waves have reached the top and bottom of the cell, electrical pacing is ineffective. At the time indicated by the white arrow, the refractory period of the RyRs within the whole cell is immediately doubled. This provokes a rapid cessation of Ca2+
release and a quiescent phase whilst the RyRs recover. Since all triggers for autonomous Ca2+
release are halted, once the RyRs recover from being refrac-tory the cell has to start responding to subsequent pacing events, and remain in-phase for the duration of stimulation. Some local-ized Ca2+
release activity is observed in the central z-plane, but is not sufficient to trigger a ping wave or longitudinal Ca2+
wave. These simulated data show that ping waves are critically dependent on refractory period and can be reversed once initiated.
4. DISCUSSION
Fidelity of EC-coupling requires the appropriate translation of electrical stimulation into temporally- and spatially-coordinated Ca2+
signals. Any condition that allows Ca2+
dynamics to operate independently of electrical pacing has the potential to be arrhyth-mogenic. In particular, it is widely accepted that the activation of spontaneous Ca2+
signals can lead to arrhythmias by activating electrogenic ion transporters, or altering the responsiveness of cells to pacing. However, the triggers for spontaneous Ca2+
FIGURE 6 | Paced ping wave initiated as in Figure 4 for a pacing period oftp=1.5 s (A), 1.7 s (B), and 1.9 s (C).Each stimulation is indicated by a diamond symbol. The first pacing pulse is delivered at 0.75 s. The refractory period in the central z-plane is 0.34 s, while
tref=1.3 s in the rest of the cell. Warm colors indicate substantial Ca2+ release site activity, while cool colors correspond to lesser Ca2+release activity. Other parameter values as inTable 1andσ=8.5µMµm3
/s, initial fraction 1.0.
t
reftime
z
A B
FIGURE 7 | (A)Cartoon illustrating the ineffectiveness of pacing to stop ping waves. The ping wave corresponds to the horizontal gray line, while the longitudinal wave is denoted by the diagonal gray lines. The pacing occurs at the time indicated by the asterisk. See text for details.(B)Paced ping wave initiated as inFigure 4where the refractory period is doubled att=6 s (white arrow). Each stimulus is
indicated by a diamond symbol, the first stimulus occurs att=2 s. The initial refractory period in the central z-plane is 0.34 s, while tref=1.2 s in the rest of the cell. Warm colors indicate substantial Ca2+ release site activity, while cool colors correspond to lesser Ca2+ release activity. Other parameter values as inFigure 2and σ=8.5µMµm3/s,t
p=2.5 s, initial fraction 0.8.
In the present study, we investigated proarrhythmogenic Ca2+ signals in atrial myocytes. These cells have a well-defined geome-try, and the relative positions of Ca2+
release sites (RyR clusters) are known (Mackenzie et al., 2004; Chen-Izu et al., 2006; Thul et al., 2012). Whilst confocal imaging has been used successfully by us and others to characterize Ca2+
signals within beating atrial myocytes (Sheehan and Blatter, 2003; Mackenzie et al., 2004) the physical limitations of such technology prevent the visual-ization of Ca2+
movement with the 3-dimensional volume of a cell in real time. We therefore implemented a mathematical model that realistically describes Ca2+movement within an atrial myocyte (Thul et al., 2012). This model recapitulates the cen-tripetal Ca2+
waves observed during electrical pacing, in addition to other features of atrial myocyte biology such as the response to positive inotropes. Moreover, the model has a predictive capac-ity in that it can demonstrate the genesis and sustainabilcapac-ity of novel spontaneous Ca2+
signals, and their impact on physiological pacing.
When exploring the movement of Ca2+
under conditions of relatively low Ca2+
release, akin to the situation during heart failure, the model identified a novel type of self-supporting Ca2+ wave activity that we termed ping waves. These events are manifest
as two counter-rotating Ca2+
waves that traverse a single z-plane of an atrial myocyte (Figure 3). Ping waves repeat themselves per-petually within the same z-plane. Our analyses suggests that ping waves are an inevitable consequence of the geometry of atrial myocytes. The re-triggering of ping waves is due to the Ca2+ concentration being continually above the threshold for RyR acti-vation. Essentially, a new ping wave is triggered by the embers of the previous ping wave. From this, it is obvious that factors affect-ing cytosolic Ca2+
concentration (e.g., SERCA activity, release strength) and RyR activity (e.g., refractoriness) will impact on the potential triggering of successive ping waves. In particular, SERCA activity will serve to diminish the residual Ca2+
concentration that remains in the wake of a ping wave, so that a successive ping wave will not occur. In the present study, we altered the refractory period as a way of changing the time available for Ca2+
to be diminished by SERCA. As we demonstrate, short refractory periods favor ping wave activity, while they are eradicated by increasing refractory period. However, it is not the refractoriness of RyRsper se that controls ping wave firing, but rather the processes that occur after Ca2+
release termination. Long refractory periods quash ping wave activity because Ca2+
[image:6.595.54.550.221.376.2]Ping waves depend on the activation of just a few RyR clusters within a z-plane. This is necessary to generate a local Ca2+
sig-nal that then propagates in a saltatory manner between the RyR clusters within the z-disk via successive rounds of diffusion and CICR. In the example shown inFigure 3, a ping wave was activated by triggering 6 peripheral RyR clusters. However, our simulations have shown that there is no need for any particular orientation or number of Ca2+
release sites to be involved (data not shown) – there simply needs to be a subcellular triggering event of sufficient magnitude to cause CICR in a localized spreading fashion.
A key aspect of ping wave survival is that the refractory period of the RyRs must be shorter than the recovery time of the cytosolic Ca2+
signal (Figure 7B). Otherwise there will be no residual Ca2+ to trigger another ping wave after the previous one has propa-gated and declined. We therefore consider that ping waves are most likely to occur under conditions such as those found in heart failure where the RyRs are believed to have increased leakiness, SR Ca2+
load is reduced, diastolic Ca2+
levels may be elevated and Ca2+ pumps are less effective at removing cytosolic Ca2+. These conditions would favor the scenario where RyRs emerge from being refractory in the presence of elevated Ca2+
concentra-tion, with the consequent triggering of spontaneous Ca2+
release. There is no need for back flux of Ca2+
from adjacent z-planes to maintain ping wave activity, as the results for long refractory periods illustrate (Figure 5). Moreover, the existence of longitudi-nal Ca2+
waves in the presence of long refractory periods outside the central z-plane (Figure 5) demonstrates that the continuous Ca2+
signal generated by the ping wave is the main mechanism that triggers longitudinal Ca2+
waves under these conditions. For short refractory periods, ping waves are responsible for seeding the first longitudinal Ca2+
wave. All subsequent longitudinal Ca2+ waves occur autonomously due to the short refractory period similar to the results shown inFigure 2B.
The physiological processes underlying RyR refractoriness are not fully established, but are believed to involve increased cytoso-lic Ca2+
, intrinsic channel gating properties and/or decreased SR Ca2+
loading. Current evidence suggests that SR Ca2+
load may be a principle determinant of RyR refractoriness, but is not the sole factor. Indeed, the SR can refill with Ca2+
, but RyRs can still be refractory (Ramay et al., 2011; Belevych et al., 2012). In the present study, we deliberately avoided being descriptive about the mechanism underlying RyR refractoriness since the relative con-tributions of different processes that impinge on RyR activity are not known. Rather, we simply blocked RyR activity for a fixed time to convolve the effects of terminating Ca2+
release by cytoso-lic Ca2+, intrinsic gating or SR Ca2+ reduction. Essentially, with each mechanism, there would be a period of Ca2+
release fol-lowed by RyR closure, during which cytosolic Ca2+
can decline. Experimental data show that local Ca2+
release events recover within 200–250 ms, which is well within the period of ping waves described in this study (Figure 3). Hence, there is sufficient time between the end of one ping wave and the start of the next for SR Ca2+
to replenish, and RyR refractoriness to reverse.
An important feature of ping waves is their robustness, and their ability to make cells insensitive to electrical pacing. By themselves, ping waves would compromise atrial myocyte function because they occupy a fraction of the RyR clusters in a futile cycling of
Ca2+
that is independent of pacing. More serious, however, is their ability to cause longitudinal Ca2+
waves by triggering CICR from neighboring z-planes. As demonstrated inFigure 6, if the refrac-tory period of the cellular RyRs is less than the pacing frequency (as is normally the case in physiology), then the longitudinal Ca2+ waves will have an increasingly dominant effect on the cell. This is because ping waves can trigger longitudinal Ca2+
waves as soon as the RyRs emerge from being refractory. Whereas, the centripetal Ca2+ waves that are caused by pacing occur at longer intervals, thereby giving the longitudinal Ca2+
waves the chance to propa-gate. Once the longitudinal Ca2+
waves have reached the top and bottom of the cell centripetal Ca2+
waves cannot occur. Under these conditions, pacing an atrial myocyte would have no effect in terms of contraction. It is worth noting that persistent Ca2+ wave activity that is independent of electrical pacing has been observed in atrial myocytes when the cells were stimulated with endothelin-1 (Bootman et al., 2007).
Our simulation framework is based on the core components of intracellular Ca2+ dynamics: cytosolic Ca2+ diffusion, CICR trigger by cytosolic Ca2+
, and Ca2+
extrusion by SERCA pumps. As such, the model is minimal, but it allows us to study in detail the Ca2+
dynamics in an atrial myocyte at the subcellular and cel-lular level at the same time. The low computational demand of the model comes at the price of some limitations. At the moment, we assume a static SR, which prevents us from incorporating SR depletion and refilling. Undoubtedly, SR Ca2+
dynamics is vital in shaping cardiac Ca2+
patterns (Thul et al., 2008;Zima et al., 2008), but it is worth noting that changing the release strength σ in the current model may be understood as a proxy to inves-tigate, e.g., alterations of the total SR Ca2+ concentration. We here focused on deterministic Ca2+
release, where Ca2+ libera-tion starts at a fixed value of the cytosolic Ca2+
concentration and lasts for a given amount of time comparable to the duration of a Ca2+
spark. The main motivation for neglecting stochastic chan-nel openings was our goal to better understand autonomous Ca2+ release in general and ping waves in particular. As we demonstrate, autonomous Ca2+
release can be achieved without spontaneous Ca2+
liberation by balancing release strength, SERCA pump activ-ity and the refractory period. Introducing random openings of RyR cluster would certainly modify the shape of ping waves, but would not completely abolish them. As we showed previ-ously (Thul et al., 2012) fluctuating Ca2+
release activity can be easily incorporated by randomizing the threshold for Ca2+
lib-eration. By construction, parameters such as the release strength σ or the release duration trel subsume a considerable number
of mechanistic processes. Instead of modeling detailed molecular interactions, we chose a coarse-grained approach to investigate the consequences of changes at the micro scale – irrespective of their origin – for physiological and pathological Ca2+
signals.
Arrhythmias induced by overloading the SR are well doc-umented. Our computational studies have highlighted another form of arrhythmogenic Ca2+release that is favored by conditions of low SR Ca2+
to cells acquiring multiple mutations of their DNA, several z-planes within an atrial myocyte could initiate ping wave phe-nomena and thereby trigger complex patterns of longitudinal
Ca2+
wave formation. If the conditions described above are encountered then the progressive development of ping waves is inevitable.
REFERENCES
Alpert, J. S., Petersen, P., and Godt-fredsen, J. (1988). Atrial fibrillation: natural history, complications, and management.Annu. Rev. Med.39, 41–52.
Belevych, A. E., Terentyev, D., Teren-tyeva, R., Ho, H.-T., Gyorke, I., Bonilla, I. M., Carnes, C. A., Bill-man, G. E., and Györke, S. (2012). Shortened Ca2+
signaling refractori-ness underlies cellular arrhythmoge-nesis in a postinfarction model of sudden cardiac death.Circ. Res.110, 569–577.
Berlin, J. R. (1995). Spatiotemporal changes of Ca2+
during electri-cally evoked contractions in atrial and ventricular cells.Am. J.
Phys-iol. Heart Circ. PhysPhys-iol.269, H1165–
H1170.
Bers, D. (2008). Calcium cycling and signaling in cardiac myocytes.Annu.
Rev. Physiol.70, 23–49.
Bootman, M. D., Harzheim, D., Smyr-nias, I., Conway, S. J., and Roder-ick, H. L. (2007). Temporal changes in atrial EC-coupling during pro-longed stimulation with
endothelin-1.Cell Calcium42, 489–501.
Bootman, M. D., Higazi, D. R., Coombes, S., and Roderick, H. L. (2006). Calcium signalling during excitation-contraction coupling in mammalian atrial myocytes.J. Cell. Sci.119, 3915–3925.
Bootman, M. D., Lipp, P., and Berridge, M. J. (2001). The organisation and functions of local Ca2+signals.J.
Cell. Sci.114, 2213–2222.
Bootman, M. D., Smyrnias, I., Thul, R., Coombes, S., and Roderick, H. L. (2011). Atrial cardiomyocyte cal-cium signalling.Biochim. Biophys. Acta1813, 922–934.
Brette, F., and Orchard, C. (2003). T-tubule function in mammalian cardiac myocytes. Circ. Res. 92, 1182–1192.
Callewaert, G. (1992). Excitation-contraction coupling in mammalian cardiac cells. Cardiovasc. Res. 26, 923–932.
Cannell, M. B., Cheng, H., and Lederer, W. J. (1995). The control of calcium release in heart muscle.Science268, 1045–1049.
Carl, S., Felix, K., Caswell, A., Brandt, N., Ball, W. J. Jr., Vaghy, P., Meiss-ner, G., and Ferguson, D. (1995). Immunolocalization of sarcolem-mal dihydropyridine receptor and sarcoplasmic reticular triadin and
ryanodine receptor in rabbit ven-tricle and atrium.J. Cell Biol.129, 673–682.
Cheng, H., Lederer, W. J., and Cannell, M. B. (1993). Calcium sparks: elementary events underlying excitation-contraction coupling in heart muscle.Science262, 740–744. Chen-Izu,Y., McCulle, S. L.,Ward, C. W.,
Soeller, C., Allen, B. M., Rabang, C., Cannell, M. B., Balke, C. W., and Izu, L. T. (2006). Three-dimensional dis-tribution of ryanodine receptor clus-ters in cardiac myocytes.Biophys. J. 91, 1–13.
DelPrincipe, F., Egger, M., and Niggli, E. (1999). Calcium signalling in car-diac muscle: refractoriness revealed by coherent activation.Nat. Cell Biol. 1, 323–329.
Dobrev, D. (2010). Atrial Ca2+
sig-naling in atrial fibrillation as an antiarrhythmic drug target.Naunyn
Schmiedebergs Arch. Pharmacol.381,
195–206.
Dobrev, D., and Nattel, S. (2008). Calcium handling abnormalities in atrial fibrillation as a target for inno-vative therapeutics. J. Cardiovasc.
Pharmacol.52, 293–299.
Goldhaber, J. I., and Bridge, J. H. B. (2009). Loss of intracellular and intercellular synchrony of calcium release in systolic heart failure.Circ.
Heart Fail.2, 157–159.
Greiser, M., Lederer, W. J., and Schotten, U. (2011). Alterations of atrial Ca2+
handling as cause and consequence of atrial fibrillation.Cardiovasc. Res. 89, 722–733.
Guatimosim, S., Dilly, K., Santana, L. F., Saleet Jafri, M., Sobie, E. A., and Lederer, W. J. (2002). Local Ca2+
signaling and EC coupling in heart: Ca2+
sparks and the regulation of the [Ca2+
]i transient.J. Mol. Cell.
Cardiol.34, 941–950.
Hove-Madsen, L., Llach, A., Bayes-Genís, A., Roura, S., Rodriguez Font, E., Arís, A., and Cinca, J. (2004). Atrial fibrillation is associ-ated with increased spontaneous cal-cium release from the sarcoplasmic reticulum in human atrial myocytes.
Circulation110, 1358–1363.
Kornyeyev, D., Petrosky, A. D., Zepeda, B., Ferreiro, M., Knollmann, B., and Escobar, A. L. (2012). Calsequestrin 2 deletion shortens the refractori-ness of Ca2+
release and reduces rate-dependent Ca2+
-alternans in intact mouse hearts. J. Mol. Cell.
Cardiol.52, 21–31.
Mackenzie, L., Bootman, M. D., Berridge, M. J., and Lipp, P. (2001). Predetermined recruitment of calcium release sites underlies excitation-contraction coupling in rat atrial myocytes. J. Physiol.
(Lond.)530, 417–429.
Mackenzie, L., Roderick, H. L., Berridge, M. J., Conway, S. J., and Boot-man, M. D. (2004). The spa-tial pattern of atrial cardiomy-ocyte calcium signalling modu-lates contraction.J. Cell. Sci. 117, 6327–6337.
Ramay, H. R., Liu, O. Z., and Sobie, E. A. (2011). Recovery of cardiac calcium release is controlled by sarcoplasmic reticulum refilling and ryanodine receptor sensitivity.Cardiovasc. Res. 91, 598–605.
Rios, E. (2005). The Ca2+
spark of mammalian muscle. Physiology or pathology? J. Physiol. (Lond.) 565, 705.
Roderick, H. L., Berridge, M. J., and Bootman, M. D. (2003). Calcium-induced calcium release.Curr. Biol. 13, R425.
Sheehan, K. A., and Blatter, L. A. (2003). Regulation of junctional and non-junctional sarcoplasmic reticu-lum calcium release in excitation-contraction coupling in cat atrial myocytes. J. Physiol. (Lond.) 546, 119–135.
Sobie, E. A., Song, L.-S., and Lederer, W. J. (2005). Local recovery of Ca2+
release in rat ventricular myocytes.J.
Physiol. (Lond.)565, 441–447.
Szentesi, P., Pignier, C., Egger, M., Kra-nias, E. G., and Niggli, E. (2004). Sarcoplasmic reticulum Ca2+
refill-ing controls recovery from Ca2+
-induced Ca2+ release
refractori-ness in heart muscle.Circ. Res.95, 807–813.
Terentyev, D., Viatchenko-Karpinski, S., Valdivia, H. H., Escobar, A. L., and Györke, S. (2002). Luminal Ca2+
controls termination and refrac-tory behavior of Ca2+
-induced Ca2+
release in cardiac myocytes.Circ. Res. 91, 414–420.
Thul, R., Coombes, S., Roderick, H. L., and Bootman, M. D. (2012). Subcel-lular calcium dynamics in a whole-cell model of an atrial myocyte.
Proc. Natl. Acad. Sci. U.S.A. 109,
2150–2155.
Thul, R., Smith, G. D., and Coombes, S. (2008). A bidomain threshold model of propagating calcium waves. J.
Math. Biol.56, 435–463.
Wakili, R., Yeh, Y.-H., Yan Qi, X., Greiser, M., Chartier, D., Nishida, K., Maguy, A., Villeneuve, L.-R., Boknik, P., Voigt, N., Krysiak, J., Kääb, S., Ravens, U., Linke, W. A., Stienen, G. J. M., Shi, Y., Tardif, J.-C., Schotten, U., Dobrev, D., and Nattel, S. (2010). Multiple poten-tial molecular contributors to atrial hypocontractility caused by atrial tachycardia remodeling in dogs.
Circ. Arrhythm. Electrophysiol. 3,
530–541.
Woo, S. H., Cleemann, L., and Morad, M. (2002). Ca2+
current-gated focal and local Ca2+
release in rat atrial myocytes: evidence from rapid 2-d confocal imaging.J. Physiol. (Lond.) 543, 439–453.
Yeh, Y.-H., Wakili, R., Qi, X.-Y., Chartier, D., Boknik, P., Kääb, S., Ravens, U., Coutu, P., Dobrev, D., and Nattel, S. (2008). Calcium-handling abnor-malities underlying atrial arrhyth-mogenesis and contractile dysfunc-tion in dogs with congestive heart failure.Circ. Arrhythm. Electrophys-iol. 1, 93–102.
Zima, A. V., Picht, E., Bers, D. M., and Blatter, L. A. (2008). Termination of cardiac Ca2+
sparks: role of intra-SR [Ca2+
], release flux, and intra-SR Ca2+ diffusion.Circ. Res.103,
e105–e115.
Conflict of Interest Statement:The authors declare that the research was conducted in the absence of any com-mercial or financial relationships that could be construed as a potential con-flict of interest.
Received: 10 April 2012; paper pending published: 25 April 2012; accepted: 28 June 2012; published online: 20 July 2012. Citation: Thul R, Coombes S and Boot-man MD (2012) Persistence of pro-arrhythmic spatio-temporal calcium pat-terns in atrial myocytes: a computational
study of ping waves. Front. Physio.3:279.