Participation in Export Markets and the Role of R&D:
Establishment-Level Evidence from the UK Community
Innovation Survey 2005
Richard Harris* and Qian Cher Li†
ABSTRACT
There is a strong expectation in the literature that exporting and innovation activities
(particularly R&D) are strongly related, and that the need to be innovative is
increasing over time due to globalisation. In this study, we find that R&D is
endogenous in a model that determines which British establishments enter export
markets, and when such simultaneity is taken into account the strength of the
export-innovation relationship is generally quite weak (especially in the non-manufacturing
sector). Rather, we find that the size of establishments and firms; foreign ownership;
the extent of international co-operation; and most importantly the industry sector to
which the establishment belongs; are the most significant in explaining which
establishments are able to overcome entry barriers into overseas markets.
JEL codes: L25; O31 ; R11; R38
Keywords: exports; R&D; absorptive capacity; simultaneous estimation
DOI:10.1080/00036840903427190
* Department of Economics , University of Glasgow, 63 Gibson Street, Glasgow, G12 8LR, UK. †
I.
INTRODUCTION
It is often argued that the link between innovation activities, such as R&D, and
exports has become increasing interdependent as part of the process of globalisation.
Innovativeness is commonly taken as a proxy for productivity and growth, and
exporting for the competitiveness of an industry or country. At the macroeconomic
level this relationship between trade and innovation often relates to several distinct
paradigms, such as the Schumpetarian idea of creative destruction (Schumpeter,
1950), the government’s pursuit of export-promotion policies, as well as the
Prebisch-Singer model of the trade patterns between developed and less developed
countries (Prebisch, 1950; Singer, 1950).
From the perspective of the firm, several earlier theoretical studies maintain that
innovating firms have incentives to expand into other markets so as to earn higher
returns from their investment, as appropriability is improved when the product
market widens (e.g. Teece, 1986). As the domestic market is usually limited in size,
firms often face an increasingly strong need to expand their product market by
different modes of internationalisation, with exporting being one of the most
conventional ways. In this process of international expansion, innovation activities
play an important role in the development of competitive advantage as well as
growth potential. For one thing, the advantage conferred by innovation will give
firms an incentive to enter global markets and subsequently enhance their
performance and international competitiveness in these new markets; in addition, the
more competitive international environment that firms are exposed to per se may
resource-based approach1 has been employed in recent studies, offering new insights
into this export-innovation relationship by focusing on the development of the firm’s
technological capacity, which is required for the firm to gain access and
subsequently operate successfully in global markets (e.g. Dhanaraj and Beamish,
2003).
In comparison with the well-established trade-innovation theoretical framework
established as part of the macroeconomics literature 2, the majority of the
microeconomic evidence on the role of innovation in internationalisation is
empirics-led. Despite a number of theoretic attempts to study the firm’s decision to export
(particularly based on a framework of sunk costs and firm-level heterogeneity), these
studies do not explicitly model innovation as one of the determinants of exporting
(e.g. Bernard et al., 2003; Yeaple, 2005). Despite the lack of a solid theoretical
foundation, studies at the micro level usually provide a useful way to disentangle this
export-innovation relationship, by taking into account the heterogeneous
characteristics of exporting and non-exporting firms. Thus, in this paper, we
concentrate on the export decision at the level of the establishment3, incorporating
the role of innovation activities and other factors determining export-market entry
(rather than export performance post entry4). Despite the importance of this area,
1 Refer to Penrose (1959) and Barney (1991) for more details on the resource-based view. 2
The macroeconomics literature offers at least two mainstream theoretical models to account for this relationship:neo-endowment models which concentrate on specialisation on the basis of factor endowments, such as materials, labour, capital, knowledge and technology (Davis, 1995); and also neo-technology models which predict innovative industries will be net exporters instead of importers (Greenhalgh, 1990). The latter type of models provides an extension of the conventional technology-based models such as the product life cycle theory (Krugman, 1979; and Dollar, 1986), and
technology-gap theory of trade (Posner, 1961). 3
Establishments were chosen as the level of analysis primarily because the Community Innovation Survey 2005 collected data at the establishment level (as opposed to the firm level). In the dataset, establishments can cover more than one plant (if the firm is a multi-plant organisation), and thus we have the advantage of conducting analysis at this more disaggregated level, allowing for the characteristics of multi-plant firms to be taken into account.
4
there are still only a limited number of micro-based studies in the literature,
especially with regard to UK-based empirical analysis, and generally it is expected
that exporting and R&D will be positively related without there being much evidence
in support.
In what follows, Section II reviews some relevant literature relating to the
exporting-innovation nexus, while Section III discusses the datasets used and the construction
of certain variables that enter our export model. Section IV sets out the model in
more detail and discusses certain methodological issues surrounding estimation.
Section V reports results for both manufacturing and non-manufacturing sectors
whilst the last section concludes with a discussion of the limitations of the current
paper and some implications for policy makers.
II.
EARLIER EMPIRICAL STUDIES
Export orientation at the firm level has been extensively investigated in the literature:
various empirical studies have emphasised the role of technology and innovation as
one of the major factors facilitating entry into global markets and thereafter
maintaining competitiveness and boosting export performance. For instance, studies
covering UK firms include: Bishop and Wiseman (1999), Bleaney and Wakelin
(2002) and most recently, Harris and Li (2008); for Canadian manufacturing firms,
Baldwin and Gu (2004); for Italian manufacturing firms, Basile (2001); for Spanish
manufacturing, Cassiman and Martinez-Ros (2004); for German services, Blind and
Jungmittag (2004); in comparative studies, Roper and Love (2002), for both UK and
German manufacturing firms, Dhanaraj and Beamish (2003) for U.S. and Canadian
firms; in the context of the rest of the world, Alvarez (2001) for Chilean
manufacturing and lastly, Ozcelik and Taymaz (2004) for Turkish manufacturing
firms. Still evidence at this micro level does not seem to be conclusive, as
inconsistent results have frequently been found (e.g. Sterlacchini, 2001).
With respect to the issue of causality associated with this linkage, the early
consensus in the literature was that causality runs from undertaking innovation
activities to internationalisation. In line with the predictions of both more
conventional product-cycle models as well as recently developed neo-technology
models (see Footnote 2 for details), the intuition behind this causal chain is
straightforward: product differentiation/innovation translates into competitive
advantages that allow the firm to compete in international markets5. However, it can
also be argued that causality may go from exporting to innovativeness, i.e. there
exists a ‘learning-by-exporting’ effect. This reverse direction of causation is in
accordance with the theoretical predictions of global economy models of endogenous
innovation and growth, such as those in Romer (1990) and Aghion and Howitt
(1998). From a resource-based perspective, being exposed to a richer source of
knowledge/technology that is often not available in the home market, exporting firms
could well take advantage of these diverse knowledge inputs and enhance their
competence base, and hence such learning from global markets can foster increased
innovation within firms.
In conjunction with the role of innovation, a number of other firm-specific factors
have also been suggested in the literature that impact on export entry, and therefore
moderate the way export and R&D activity affect (and interact with) each other.
Above all, in a seminal paper, Cohen and Levinthal (1990) put forward the notion of
5
“absorptive capacity” 6
and demonstrate that the ability to exploit external
knowledge is a critical component of a firm’s capabilities. Essentially, absorptive
capacity constitutes an analytical link between the firm’s in-house resources and the
external stock of knowledge in enhancing its resource base and generating
competitive advantage.
There is also well-documented evidence on how the size of firms affects the
probability of entering foreign markets, as larger firms are expected to have more
(technological) resources available to initiate an international expansion (e.g.
Roberts and Tybout, 1997; Bleaney and Wakelin, 2002). Higher productivity in
general constitutes another significant factor determining the firm’s
internationalisation decision. This positive impact of productivity on export-market
entry is in line with the self-selection hypothesis, which assumes that the existence
of sunk entry costs means exporters have to be more productive to overcome such
fixed costs before they can realise expected profits (for recent surveys of the
literature surrounding this export-productivity nexus, see López, 2005 and
Greenaway and Kneller, 2007).
The external position of the firm is also generally found to determine export
behaviour, in terms of sectoral, regional effects or market structure. For instance, as
industries are neither homogeneous in their technological capacity nor exporting
patterns, the sectoral effect (reflecting technological opportunities and product cycle
differences) is usually expected to be significant (e.g. Bleaney and Wakelin, 2002,
for empirical evidence). The role of spatial factors are also important; for example,
see Overman et al.’s (2003) survey of the literature on the economic geography of
6 They argue that “...prior related knowledge confers an ability to recognize the value of new
trade flows and the location of production. If information on costs and
foreign-market opportunities is asymmetric, then it is reasonable to expect firms to cluster
within the same industry/region so as to achieve information sharing and therefore
minimise entry costs; such co-location provides better channels through which firms
distribute their goods (e.g. Greenaway and Kneller, 2004). Lastly, market
concentration is also expected to positively impact upon a firm’s propensity to
export. A high level of concentration of exporters within an industry may improve
the underlying infrastructure that is necessary to facilitate access to international
markets or to information on the demand characteristics of foreign consumers.
III.
DATASET
The dataset employed for the current study comprises the merged Community
Innovation Survey 2005 (henceforth CIS4) and the 2003 Annual Respondents
Database (henceforth ARD 2003). The features of the two datasets as well as the
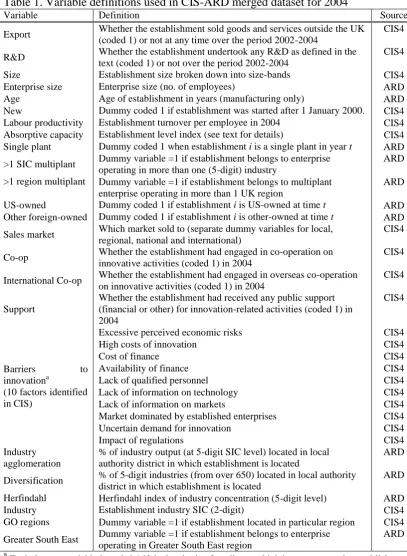
matching procedure are discussed in more detail in the Appendix. Table 1 sets out
the list of variables we use in this study, along with the source of the datasets. Note,
the establishment’s R&D activity is used to proxy for its innovation activities, with
R&D spending defined as intramural R&D, or acquired external R&D or acquired
other external knowledge (such as licences to use intellectual property).7
(Table 1 about here)
Of particular importance is the absorptive capacity of the establishment (c.f. Page 4-5
for more details). No direct information on this variable is available, but CIS4
7 There is other spending that is categorised in the CIS4 database relating to innovative activities, such
contains information on key elements of internal and external knowledge that can be
related to absorptive capacity. ‘Internal’ absorptive capacity is proxied using data on
the impact on business performance of the implementation of new or significantly
changed corporate strategies; advanced management techniques (e.g. knowledge
management, Investors in People); organisational structures (e.g. introduction of
cross-functional teams, outsourcing of major business functions); and marketing
concepts/strategies8. ‘External’ absorptive capacity was proxied using data on the
relative importance of different sources of information used for innovation related
activities. These are grouped under the following sub-headings with associated
elements: market - suppliers, customers, competitors, consultants, commercial
labs/R&D enterprises; institutional - universities, government research organisations;
other - professional conferences, meetings, professional and trade associations,
technical press, fairs, exhibitions, technical, industry or service standards.9
To obtain a single index of absorptive capacity, a factor analysis was undertaken
using all the 14 variables listed above. We found that the first principal component
had an eigenvalue of 6.2 and could explain 44% of the combined variance of the
variables. Thus, we use this principal component (with a mean of zero and a standard
deviation of 1) as an adequate proxy of absorptive capacity. Note, our measure of
absorptive capacity indicates mostly the ability of the establishment to internalise
external knowledge for innovation activities rather than for a range of other
activities, such as overcoming barriers to exporting. That is, we assume (as detailed
in Section IV) that our measure directly determines whether R&D is undertaken or
not, while undertaking R&D is then used as a determinant of whether the
8 For each set of information, respondents to CIS4 were asked whether the change had taken place in
the three-year period up to 2004.
establishment exports or not. Thus, absorptive capacity impacts on exporting, but
indirectly through R&D activities. We empirically test whether the model structure
that we impose is supported by the data, by considering the significance of our
absorptive capacity indicator when directly entered into a model which tests for the
determinants of exporting. If absorptive capacity is significant as a direct
determinant of R&D activities but insignificant as a direct determinant of whether an
establishment exports, this is taken as support for our approach.
Most other variables included in Table 1 are self-explanatory. In particular, industrial
agglomeration is included to take account of any Marshall-Romer external
(dis)economies of scale (c.f. Henderson, 2003). The greater the clustering of an
industry within the local authority in which the plant operates, the greater the
potential benefits from spillover impacts. Conversely, greater agglomeration may
lead to congestion, and therefore may lower productivity. The diversification index
is included to pick up urbanisation economies associated with operating in an area
with a large number of different industries. Higher diversification is usually assumed
to have positive benefits to producers through spillover effects. Note, agglomeration
is measured as the percentage of industry output (at the 5-digit SIC level) located in
the local authority district in which the establishment is located; diversification is
measured as the percentage of 5-digit industries (from over 650) that are located in
the local authority district in which the establishment is located. The Herfindahl
index of industrial concentration is measured at the 5-digit 1992 SIC level to take
account of any market power effects (which are expected to be associated with the
propensity to both export and to undertake R&D). The variable that measures if the
establishment belongs to an enterprise operating in more than one (5-digit) industry
age of (manufacturing) establishments and their capital-labour ratios were obtained
from updating the series on plant & machinery capital stocks computed by Harris
and Drinkwater (2000). Capital stock estimates are not available for the
non-manufacturing sector (as gross investment data are only available from 1998);
however, we can provide an indicator of the age of non-manufacturing
establishments based on a question asked in the CIS4 questionnaire (i.e. whether the
enterprise was established after 1 January 2000).
All the data are weighted to ensure it is representative of the UK distribution of
establishments (i.e. it is not biased towards the CIS4 sample). Initial inspection
shows that 25.1 per cent of manufacturers engaged in both exporting and spending
on R&D; while only 8.5 per cent undertook both activities in the non-manufacturing
sectors.
IV.
MODEL SPECIFICATION
Separate models are estimated for manufacturing and services (given the known
differences between these two sectors in terms of their propensities to export). For
each sector, we estimate a model of what determines whether exporting is
undertaken or not, where undertaking R&D is included as a likely major
determinant;10 thus, to account for simultaneity between exporting and R&D we use
the structural probit model approach first presented by Maddala (1983).11 This
involves using instruments to replace the endogenous variables and thus obtain
10 In this study R&D activity is employed to proxy for an establishment’s innovation behaviour. Note,
we have also attempted to include in our model other proxies from the output side such as
product/process innovations; nevertheless, the estimation results obtained using alternative measures are considerably less robust, and therefore we only report results based on the current model using the R&D measure.
11 Other simultaneous approaches have been employed in several empirical studies treating innovation
unbiased estimates of the impact of R&D on exporting. There is also a procedure for
correcting the resulted standard errors when the instrumented R&D is incorporated
in the exporting model (since this instrument is generated from a different model).
In choosing the likely determinants of whether exporting (or R&D spending) takes
place or not, we include those variables that have been shown to be important in the
literature and that are available in the CIS4-ARD database. Thus all the variables
listed in Table 1 are included in our empirical models.
We begin with the following probit model determining whether an establishment
exports or not:
EXP = f (R&D, X1) + u1; u1 ~ N(0,1) (1)
where EXP is a 0/1 dichotomous variable which takes on the value 1 if the
establishment exports; R&D is a 0/1 dichotomous variable which takes on the value
1 if the establishment spends on R&D; X1 is a vector of other (exogenous) variables
that determine exporting; and u1 is an error term that includes all other random
effects.
As written, Equation (1) assumes that R&D is an exogenous determinant of
exporting. To allow for a simultaneous relationship we also estimate a (probit) model
to determine whether an establishment spends on R&D or not:
R&D = f (EXP, AC, X2) + u2; u2 ~ N(0,1) (2)
where AC measures the absorptive capacity of the establishment in terms of its
ability to internalise external sources of knowledge related to its (potential)
innovation activities; X2 is a vector of other (exogenous) variables that determine
R&D (with some variables in X2 also likely to be included in X1, but X2X1); and
The reduced-form model that determines R&D is therefore obtained by substituting
Equation (1) into (2) and rearranging:
R&D = f (AC, X1, X2) + u3; EXP = f (AC, X1, X2) + u'3;
u3, u'3 ~ N(0,1) (3)
Estimating Equation (3) and obtaining predicted values for R&D allows us to replace
R&D in Equation (1) by its instrument ( R&ˆ D ), thus obtaining the following
structural model of the determinants of whether an establishment exports or not
(allowing for endogeneity between exporting and R&D):
EXP = f (R&ˆ D, X1) +u1; u1 ~ N(0,1) (4)
We have assumed that absorptive capacity enters the model determining R&D, but
does not directly determine exporting (although AC enters the reduced-form model
for exporting, through Equation (2) which shows that R&D – as a determinant of
exporting – is itself determined by absorptive capacity). In addition to formally
testing whether R&D is endogenous in Equation (1), using a form of the
Smith-Blundell test for exogeneity, we also estimate another version of (1) that includes AC
to test whether this variable is significant or not, with non-significance being an
indication that AC only determines exporting indirectly through its impact on R&D.
V.
ESTIMATION RESULTS
Manufacturing
The results for the reduced-form models for the manufacturing sector are presented
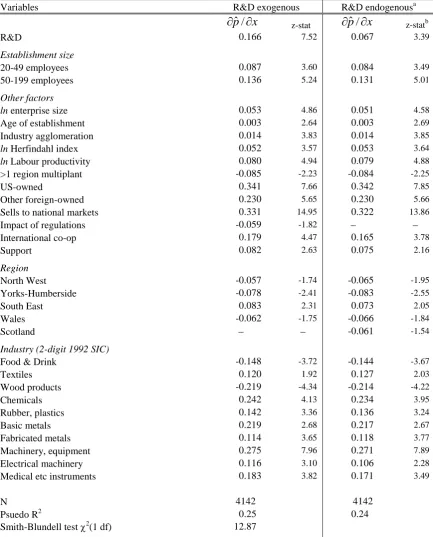
in Table 2. Table 3 presents the results of exporting modeling for the manufacturing,
(4)), respectively. Note, stepwise (probit) regression models are estimated12, and
marginal effects are reported. Also the z-statistics reported in Table 3 have been
‘corrected’ when R&D is instrumented, since the latter is generated from the
reduced-form model. Maddala (1983, pp. 246-247) provides the relevant formula for
the variance-covariance matrix, which we have adopted to use in STATA (although
we find very little difference between the standard errors obtained using the standard
and corrected variance-covariance matrices).
Comparing the reduced-form results for exporting and R&D (Table 2) shows that
certain variables are only significant in one or other of the two equations estimated,
and it is these (unique) variables that separately identify structural models for
exporting (and R&D).13 We use this information on which variables are unique to the
exporting and R&D reduced-form models in order to test for exogeneity using the
Smith-Blundell test available in STATA.14 As shown in Table 3, the null hypothesis
that R&D is exogenous is rejected at better than the 1 per cent significance level.
(Table 2 about here)
(Table 3 about here)
As to the issue of whether absorptive capacity (AC) should enter the structural model
determining exporting, we found this variable to be insignificant when estimating
12 Variables were retained in each model that had associated parameter estimates significant at the
15% or better level. In addition, the null hypothesis that the variables dropped had jointly coefficients equal to zero was not rejected at better than the 10% significance level. The full list of variables that entered each model is shown in Table 1.
13
The presence of such (unique) variables is necessary in order to obtain a valid instrument for R&D in Equation (4). Note, we also treat absorptive capacity (AC) as an instrument, given our modelling approach (cf. Equations (1) to (4)) and the fact that (see below) this variable is not significant in the export model (based on estimating Equation (1)).
14
The probexog routine in STATA is used. This is based on the methodology devised by Smith and Blundell (1986), revised for probit (and logit) models. In practice, the EXP variable is regressed on both those variables that are significant in determining the reduced-form export model (see Table 2), plus an instrumented R&D variable where R&D was instrumented by the establishment size
Equation (1). The reduced-form models for exporting and R&D (Table 2) also show
that AC has a much larger impact in determining R&D and a relatively small effect
upon exporting. Thus, we take this as evidence that this variable impacts on whether
an establishment exports (or not) via its (highly significant) impact on R&D, rather
than through any direct impact of its own.
In terms of the determinants of exporting, when R&D is treated as exogenous, the
impact of an establishment undertaking R&D spending is to significantly increase
the probability that it also exports by almost 17 per cent. However, this impact of
R&D on exporting drops to less than 7 per cent, when we take into account the
simultaneous relationship between exporting and R&D.15 Thus incorrectly treating
R&D as exogenous leads to an upward bias in the strength of the exporting-R&D
relationship, and in general undertaking R&D has only a relatively small impact on
the decision to export at the establishment level in Great Britain.
In what follows, we concentrate on the results where R&D is taken to be
endogenous, although generally there is little difference in estimated parameter
values for the other (non-R&D) determinants of exporting. First and foremost,
establishment-specific characteristics seem to play a major role in determining the
probability of entering into international markets. For instance, the size of the
establishment had a major impact on whether any exporting took place; vis-à-vis the
baseline group (establishments employing less than 20), moving to 20-49 employees
increased the probability of exporting by 8.4%; while having 50-199 workers
increased the probability by 13.1%. This confirms the results found in the literature
that size and the propensity to export are positively related (see Section II for a
15 We have also estimated the model of the determinants of R&D, with exporting treated as
discussion). In addition to establishment size, the size of the enterprise was also
important in determining which establishments had non-zero exports. A doubling of
enterprise size (from the mean of 34 employees) resulted in a 5.1% increase in the
likelihood of the establishment exporting in 2004. Meanwhile, doubling the age of
establishments from its mean value of nearly 11 years increased the probability of
exporting by just over 3%.
Establishments with higher labour productivity were also more likely to enter export
markets; a doubling of this variable (from its mean value of just over £68k turnover
per worker) increased the probability of exporting by nearly 8%. Establishments that
belonged to enterprises that operated plants in more than one region were (cet. par.)
over 8% less likely to export. In contrast, foreign-owned establishments had
significantly higher export propensities (e.g. being US-owned resulted in a 34.2%
higher probability of exporting, while other foreign-owned establishments were 23%
more likely to export, compared with their UK-owned counterparts).
Selling to national markets had a significant impact on increasing the likelihood that
the establishment was also engaged in exporting abroad (the probability of exporting
was over 32% greater for such establishments). Data are also available on whether
establishments had engaged in co-operation on innovative activities with overseas
organisation; the results presented in Table 3 show that (cet. par.) those that did were
some 17 % more likely to export. Moreover, as indicated by the insignificant
estimated parameters of some variables related to market failures, in the context of
the establishment’s innovation activities (e.g. a lack of information on technology,
high innovation costs, impact of regulations, etc.), none of these factors capturing
However, establishments that received government support for innovation activities
were also more likely to export (an increase of nearly 8%).
As far as the market or industry is concerned, the results in Table 3 indicate that
industry/market concentration and agglomeration were both linked to a greater
probability of exporting. Increasing the Herfindalh index of market concentration,
from its mean value of 0.06 to 0.16 (the latter being the average value for the 90th
decile group in manufacturing), increased the (cet. par.) probability of exporting by
around 14%. Similarly, a 5-fold increase in the percentage of industry output (at the
5-digit SIC level) in the local authority district in which the establishment was
located would have resulted in a 7% increase in the probability of exporting.
Regional impacts are significant as well – being located in the South East region
resulted in a higher propensity to export by some 7.3%; the other regions included in
the results were between 6 – 8% less likely to export. Sector also mattered; those
with the highest propensities to export were (cet. par.) chemicals, basic metals, and
machinery & equipment. None of the other variables entered (see Table 1) proved to
have a significant impact on establishment’s entry into international markets (e.g.
industry diversification, whether the establishment belonged to an enterprise
operating in more than one industry or the Greater South East).
Non-manufacturing
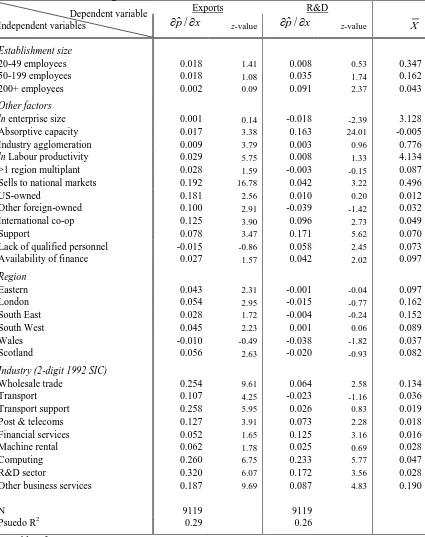
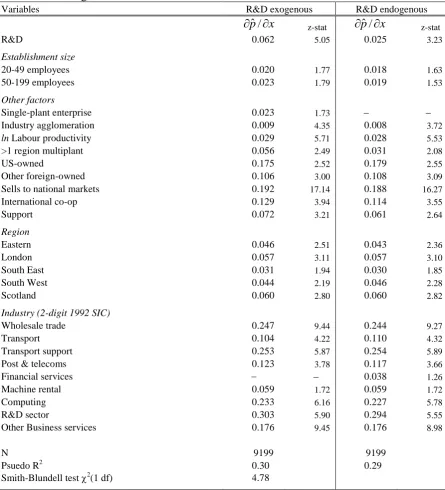
Table 5 presents the results for non-manufacturing, again based on different models
involving the different treatment of R&D. We use the information on which
variables are unique to the exporting and R&D reduced-form models (based on their
Smith-Blundell test.16 As shown, the null hypothesis that R&D is exogenous is
rejected.
(Table 4 about here)
(Table 5 about here)
As to the issue of whether absorptive capacity (AC) should enter the structural model
determining exporting, we find this variable to be insignificant when estimating
Equation (1). The reduced-form models for exporting and R&D (Table 4) also show
that absorptive capacity had a much larger impact in determining R&D and a
relatively small effect upon exporting. Thus, as with the case for the manufacturing
results, we take this as evidence that this variable impacts on whether an
establishment exports (or not) via its (highly significant) impact on R&D, rather than
through any direct impact of its own.
When R&D is treated as exogenous, the impact of R&D spending was to increase
the probability that an establishment also exported by more than 6%. However, when
we take account of the simultaneous relationship between exporting and R&D, the
impact of R&D on exporting was (as expected) much smaller at around 2.5%.17
Compared with the results for manufacturing, the exporting-R&D relationship was
much weaker in the non-manufacturing sector.
As with manufacturing, we concentrate on the parameter estimates obtained for the
second model where R&D is taken to be endogenous. The size of the establishment
16 The EXP variable is regressed on both those variables that are significant in determining the
reduced-form export model (see Table 4Table 4), plus an instrumented R&D variable (R&D was instrumented by establishment size 50-199 and 200+ employees, ln enterprise size, AC, and dummies for barriers to innovation covering lack of qualified staff and availability of finance).
17 We have also estimated the model of the determinants of R&D in non-manufacturing, with
had a positive impact on whether any exporting took place; vis-à-vis the baseline
group (establishments employing less than 20), cet. par., moving to 20-49 employees
increased the probability of exporting by 1.8%; 50-199 workers increased the
probability by 1.9%. These values are considerably smaller than those reported for
manufacturing (Table 3).
Those establishments with higher labour productivity were also more likely to enter
export markets; a doubling of this variable (from its mean value of just over £62k
turnover per worker) increased the probability of exporting by nearly 6%. Again, this
is a smaller impact than that obtained for manufacturing. Establishments that
belonged to enterprises that operated plants in more than one region were (cet. par.)
over 3% more likely to export, which is in contrast with the manufacturing model
where the impact of this variable was negative. However, and in line with
manufacturing, being under foreign control increased exporting, with US-owned
establishments nearly 18% more likely to export, while other foreign-owned had
10.8% higher probabilities of selling overseas.
Selling to national markets had a significant impact on increasing the likelihood that
the establishment was also engaged in exporting abroad (i.e. the probability of
exporting was nearly 19% greater for such establishments, although this is
significantly lower when compared with the results presented in Table 3 for
manufacturing). Establishments engaged in international co-operation on innovative
activities were around 11% more likely to export. Establishments that received
government support for innovation activities were also some 6% more likely to sell
overseas. In line with the results obtained for manufacturing, none of the variables
capturing innovation-related market failures had any adverse impact on the
Contrary to the case in manufacturing, the external localisation of establishments in
the services sector does not seem to play a significant role in determining their
decision to export. Specifically, the results in Table 5 show that industry
agglomeration was only marginally linked to a greater probability of exporting in the
non-manufacturing sector; a 5-fold increase in the percentage of industry output (at
the 5-digit SIC level) in the local authority district in which the establishment was
located would have resulted in a merely 4% increase in the probability of exporting.
This could in part be explained by lower level of industrial agglomeration in the
services compared with the manufacturing sector. Moreover, vis-à-vis the results
from the manufacturing sector, increasing the Herfindalh index of market
concentration did not boost the probability of an establishment going international.
Regional impacts exhibited a different pattern to those in manufacturing. For
instance, all the regions of southern England plus Scotland had higher propensities to
export (between 3 – 6% more likely to export). Sector also mattered; the sectors with
the highest propensities to export were (cet. par.) the R&D sector, transport support,
wholesale trade and computing. Again, none of the other variables entered in the
model (see Table 1) proved to impact on the establishment’s propensity to export.
VI.
CONCLUSION
There is a strong expectation in the literature that exporting and innovation activities
(particularly R&D) are strongly related, and that the need to be innovative is
increasing over time due to globalisation. In this study, we find that R&D is
endogenous in a model that determines which British establishments enter export
export-innovation relationship is generally quite weak (especially in the non-manufacturing
sector).
Rather, we find that establishment and firm size, foreign ownership, the extent of
international co-operation, and most importantly the industry sector to which the
establishment belongs, are more important in explaining which establishments are
able to overcome entry barriers into overseas markets. There are some important
differences between the manufacturing and non-manufacturing sectors; for example,
agglomeration and market structure have a stronger role in manufacturing, and there
are some interesting differences when looking at the impact of location (in terms of
region) on who exports.
From a policy perspective, given the differing needs of (potential) exporters (i.e. the
internal resources available to them), our results suggest that government assistance
needs to be flexible so as to reflect the heterogeneous nature of firms. In particular,
we find little evidence (given the data available) to suggest that market failure is a
key barrier to exporting, and this suggests that policies might instead need to
concentrate on helping firms in particular sectors to acquire certain characteristics
(e.g. larger size, higher productivity, greater absorptive capacity and learning
capabilities) so as to confer the ability to overcome sunk costs that act as barriers to
entry into international markets.
ACKNOWLEDGEMENTS
This work contains statistical data from ONS which is Crown copyright and
reproduced with the permission of the controller of HMSO and Queen's Printer for
endorsement of the ONS in relation to the interpretation or analysis of the statistical
data. This work uses research datasets which may not exactly reproduce National
Statistics aggregates. We also wish to thank UKTI for sponsoring this project;
REFERENCES
Aghion, P. and Howitt, P. (1998) Endogenous Growth Theory, Cambridge and London: MIT Press. Alvarez, R. (2001) External sources of technological innovation in Chilean manufacturing industry,
Estudios de Economia, 28, 53-68.
Baldwin, J.R. and Gu, W. (2004) Trade liberalization: export-market participation, productivity
growth, and innovation, Oxford Review of Economic Policy, 20, 372-92.
Barney, J. (1991) Firm resources and sustained competitive advantage, Journal of Management, 17, 99-120.
Barrios, S., Gorg, H., and Strobl, E. (2003) Explaining firms' export behaviour: R&D, spillovers and
the destination market, Oxford Bulletin of Economics & Statistics, 65, 475-96.
Basile, R. (2001) Export behaviour of Italian manufacturing firms over the nineties: the role of
innovation, Research Policy, 30, 1185-200.
Bernard, A.B., Eaton, J., Jensen, J.B., and Kortum, S. (2003) Plants and productivity in international
trade, American Economic Review, 93, 1268-290.
Bishop, P. and Wiseman, N. (1999) External ownership and innovation in the United Kingdom,
Applied Economics, 31, 443-50.
Bleaney, M. and Wakelin, K. (2002) Efficiency, innovation and exports, Oxford Bulletin of Economics & Statistics, 64, 3-15.
Blind, K. and Jungmittag, A. (2004) Foreign direct investment, imports and innovations in the service
industry, Review of Industrial Organization, 25, 205-27.
Cassiman, B. and Martinez-Ros, E. (2004) Innovation and exports: evidence from Spanish
manufacturing, Working Paper.
Cassiman,B. and Veugelers, R. (1999) Complementarity between technology make and buy in
innovation strategies: evidence from Belgium manufacturing firms, Research Policy, 28, 63-80.
Cohen, W.M. and Levinthal, D.A. (1990) Absorptive capacity: a new perspective on learning and
innovation, Administrative Science Quarterly, 35, 128-52.
Dhanaraj, C. and Beamish, P.W. (2003) A resource-based approach to the study of export
performance, Journal of Small Business Management, 41, 242-61.
Dollar, D. (1986) Technological innovations, capital mobility, and the product cycle in North-South
trade, American Economic Review, 76, 177-90.
Greenaway, D. and Kneller, R. (2004) Exporting and productivity in the United Kingdom, Oxford Review of Economic Policy, 20, 358-71.
Greenaway, D. and Kneller, R. (2007) Firm heterogeneity, exporting and foreign direct investment,
The Economic Journal, 117, F134-61.
Greenhalgh, C. (1990) Innovation and trade performance in the United Kingdom, Economic Journal,
100, 105-18.
Harris, R.I.D. and Drinkwater, S. (2000) UK plant and machinery capital stocks and plant closures,
Oxford Bulletin of Economics and Statistics, 62, 239-61.
Harris, R.I.D. and Li, Q. C. (2008) Exporting, R&D, and absorptive capacity in UK establishments,
Oxford Economic Papers, forthcoming,
http://oep.oxfordjournals.org/cgi/content/abstract/gpn011
Henderson, V. (2003) Marshall's scale economies, Journal of Urban Economics, 53, 1-28.
Krugman, P. (1979) A model of innovation, technology transfer, and the world distribution of income,
Journal of Political Economy, 87, 253-66.
Lachenmaier, S. and Woessmann, L. (2006) Does innovation cause exports? Evidence from
exogenous innovation impulses and obstacles using German micro data, Oxford Economic Papers, 58, 317-50.
López, R.A. (2005) Trade and growth: reconciling the macroeconomic and microeconomic evidence.
Journal of Economic Surveys, 19, 623-48.
Maddala, G.S. (1983) Limited-Dependent and Qualitative Variables in Econometrics, Cambridge University Press.
Overman, H.G., Redding, S., and Venables, A.J. (2003) The economic geography of trade, production
Ozcelik, E. and Taymaz, E. (2004) Does innovativeness matter for international competitiveness in
developing countries? The case of Turkish manufacturing industries, Research Policy,
33, 409-24.
Penrose, E. (1959) The Theory of the Growth of the Firm, Oxford: OUP.
Posner, M. (1961) International trade and technical change, Oxford Economic Papers, 13, 323-41. Prebisch, R. (1950) The economic development of Latin America and its principle problems,
Reprinted in: Economic Bulletin For Latin America, 1962, 7, 1-22.New York: United Nations.
Roberts, M. and Tybout, J.R. (1997) The decision to export in Colombia: an empirical model of entry
with sunk costs, American Economic Review, 87, 545-64.
Romer, P.M. (1990) Endogenous technical change, Journal of Political Economy, 98, 71-102. Roper, S. and Love, J.H. (2002) Innovation and export performance: evidence from the UK and
German manufacturing plants, Research Policy, 31, 1087-102.
Schumpeter, J.A.(1950) Capitalism, Socialism and Democracy, (3rd edn). New York: Happer and Row.
Singer, H.W. (1950) The distribution of gains between investing and borrowing countries, American Economic Review, 40, 473-85.
Smith, R.J. and Blundell, R.W. (1986) An exogeneity test for a simultaneous equation tobit model
with an application to labour supply, Econometrica, 54, 679-86.
Sterlacchini, A. (2001) The determinants of export performance: a firm-level study of Italian
manufacturing, Review of World Economics, 137, 450-72.
Teece, D.J. (1986) Profiting from technological innovation: implications for integration,
collaboration, licensing and public policy, Ricerche Economiche, 40, 607-43.
APPENDIX
Construction of the merged CIS-ARD dataset
The Community Innovation Survey 2005 dataset (CIS4) is a cross-sectional survey
of innovation activities covering 2002-2004, including the characteristics of the
reporting unit surveyed (e.g. turnover, employment and, most importantly here,
whether it exported). Covering most sectors of the economy, the CIS4 dataset
contains 16,445 observations from a selected sample of 28,000 who were
approached by the ONS, and thus the survey response rate was nearly 59%.18
Ancillary information in the 2003 Annual Respondents Database (2003 ARD),
mostly related to ownership characteristics and external localisation of the
establishments, is merged into the CIS4 to create the current dataset for use in
analysis of what determines exporting, since IDBR reference numbers are common
to both datasets. Here ARD data are used at reporting unit (i.e. establishment) level
to ensure comparability with the CIS4 data; where necessary, plant level ARD
information has been aggregated to reporting unit level. We have been able to match
14,299 of these establishments in CIS4 with the 2003 ARD. The non-merged CIS4
data mostly include Northern Ireland (accounting for 63% of the non-matched
observations) and financial services (accounting for 31%), both of which are not
included in the 2003 ARD. The remaining 5% of non-matched observations
comprise mostly those that started operations in 2004.
The matching procedure seems to give rise to two potential problems in our merged
dataset. Firstly, strictly speaking, CIS4 should be merged with the 2004 ARD (rather
than the 2003 version), since the CIS4 sample were based on the population of
establishments as existing in the 2004 IDBR, but 2004 data are not yet available.
Therefore using only 2003 data for the ARD means that CIS4 establishments that
started up in 2004 are excluded from any matching of CIS4 and the 2003 ARD.
Nevertheless, this is unlikely to be problematic as those start-ups in 2004 only
comprise less than 5% of the non-matched observations. In addition, CIS4 covers
only those with 10+ employees; nevertheless, in practice this results in some 8%
(weighted) of the establishments covered having employment of less than 10, for the
IDBR information includes a level of inaccuracy due to the timing of the information
obtained on employment, and some units when sampled may have downsized by the
time they received the CIS questionnaire. Table 1 below sets out the list of variables
Table 1. Variable definitions used in CIS-ARD merged dataset for 2004
Variable Definition Source
Export Whether the establishment sold goods and services outside the UK (coded 1) or not at any time over the period 2002-2004
CIS4
R&D Whether the establishment undertook any R&D as defined in the text (coded 1) or not over the period 2002-2004
CIS4
Size Establishment size broken down into size-bands CIS4
Enterprise size Enterprise size (no. of employees) ARD
Age Age of establishment in years (manufacturing only) ARD
New Dummy coded 1 if establishment was started after 1 January 2000. CIS4 Labour productivity Establishment turnover per employee in 2004 CIS4 Absorptive capacity Establishment level index (see text for details) CIS4 Single plant Dummy coded 1 when establishment i is a single plant in year t ARD >1 SIC multiplant Dummy variable =1 if establishment belongs to enterprise
operating in more than one (5-digit) industry
ARD
>1 region multiplant Dummy variable =1 if establishment belongs to multiplant enterprise operating in more than 1 UK region
ARD
US-owned Dummy coded 1 if establishment i is US-owned at time t ARD Other foreign-owned Dummy coded 1 if establishment i is other-owned at time t ARD Sales market Which market sold to (separate dummy variables for local,
regional, national and international)
CIS4
Co-op Whether the establishment had engaged in co-operation on innovative activities (coded 1) in 2004
CIS4
International Co-op Whether the establishment had engaged in overseas co-operation on innovative activities (coded 1) in 2004
CIS4
Support
Whether the establishment had received any public support (financial or other) for innovation-related activities (coded 1) in 2004
CIS4
Barriers to
innovationa
(10 factors identified in CIS)
Excessive perceived economic risks CIS4
High costs of innovation CIS4
Cost of finance CIS4
Availability of finance CIS4
Lack of qualified personnel CIS4
Lack of information on technology CIS4
Lack of information on markets CIS4
Market dominated by established enterprises CIS4
Uncertain demand for innovation CIS4
Impact of regulations CIS4
Industry agglomeration
% of industry output (at 5-digit SIC level) located in local authority district in which establishment is located
ARD
Diversification % of 5-digit industries (from over 650) located in local authority district in which establishment is located
ARD
Herfindahl Herfindahl index of industry concentration (5-digit level) ARD
Industry Establishment industry SIC (2-digit) CIS4
GO regions Dummy variable =1 if establishment located in particular region CIS4
Greater South East Dummy variable =1 if establishment belongs to enterprise
operating in Greater South East region
ARD
a
Table 2. Weighted reduced-form probit models of determinants of exporting and R&D in GB manufacturing, 2004
Dependent variable Independent variables
Exports R&D
x p
ˆ/ z-value pˆ/x z-value X
Establishment size
10-19 employees -0.035 -0.62 0.135 2.13 0.299
20-49 employees 0.061 1.05 0.148 2.36 0.360
50-199 employees 0.114 1.76 0.212 3.03 0.222
200+ employees -0.010 -0.12 0.225 2.65 0.073
Other factors
ln enterprise size 0.047 2.82 0.016 1.03 3.530
Absorptive capacity 0.043 3.63 0.218 18.71 0.196
Single-plant enterprise -0.032 -0.93 0.078 2.57 0.799
Age of establishment 0.003 2.35 -0.001 -1.11 10.697
Industry agglomeration 0.013 3.79 -0.001 -0.34 1.557
ln Herfindahl index 0.055 3.80 0.015 1.16 -2.910
ln Labour productivity 0.078 4.77 0.009 0.62 4.226
>1 region multiplant -0.108 -2.45 0.078 1.77 0.102
>1 SIC multiplant 0.022 0.82 -0.067 -2.83 0.222
Sells to national markets 0.340 15.70 0.123 5.17 0.771
US-owned 0.343 7.84 0.017 0.33 0.031
Other foreign-owned 0.227 5.54 -0.028 -0.79 0.062
International co-op 0.194 4.85 0.197 4.68 0.080
Support 0.109 3.50 0.199 6.33 0.132
Region
North East -0.039 -1.05 -0.074 -2.26 0.039
North West -0.068 -2.05 -0.002 -0.05 0.124
Yorks-Humberside -0.093 -2.85 -0.042 -1.31 0.104
South East 0.062 1.72 -0.029 -0.92 0.126
Wales -0.075 -2.06 -0.046 -1.3 0.042
Scotland -0.081 -2.06 -0.086 -2.39 0.065
Industry (2-digit 1992 SIC)
Food & Drink -0.139 -3.53 0.021 0.51 0.070
Textiles 0.120 1.91 -0.039 -0.65 0.029
Wood products -0.216 -4.26 -0.025 -0.48 0.041
Chemicals 0.230 3.88 -0.013 -0.22 0.036
Rubber, plastics 0.138 3.27 0.005 0.13 0.072
Basic metals 0.218 2.71 0.002 0.03 0.020
Fabricated metals 0.110 3.52 -0.064 -2.24 0.194
Machinery, equipment 0.288 8.55 0.089 2.41 0.102
Electrical machinery 0.114 3.05 0.036 0.98 0.069
Medical etc instruments 0.181 3.72 0.054 1.09 0.042
N 4142 4142
Psuedo R2 0.25 0.22
[image:28.595.116.544.118.707.2]Table 3. Weighted structural probit models of determinants of exporting in GB manufacturing, 2004
Variables R&D exogenous R&D endogenousa
pˆ/x z-stat pˆ/x z-statb
R&D 0.166 7.52 0.067 3.39
Establishment size
20-49 employees 0.087 3.60 0.084 3.49
50-199 employees 0.136 5.24 0.131 5.01
Other factors
ln enterprise size 0.053 4.86 0.051 4.58
Age of establishment 0.003 2.64 0.003 2.69
Industry agglomeration 0.014 3.83 0.014 3.85
ln Herfindahl index 0.052 3.57 0.053 3.64
ln Labour productivity 0.080 4.94 0.079 4.88
>1 region multiplant -0.085 -2.23 -0.084 -2.25
US-owned 0.341 7.66 0.342 7.85
Other foreign-owned 0.230 5.65 0.230 5.66
Sells to national markets 0.331 14.95 0.322 13.86
Impact of regulations -0.059 -1.82
International co-op 0.179 4.47 0.165 3.78
Support 0.082 2.63 0.075 2.16
Region
North West -0.057 -1.74 -0.065 -1.95
Yorks-Humberside -0.078 -2.41 -0.083 -2.55
South East 0.083 2.31 0.073 2.05
Wales -0.062 -1.75 -0.066 -1.84
Scotland -0.061 -1.54
Industry (2-digit 1992 SIC)
Food & Drink -0.148 -3.72 -0.144 -3.67
Textiles 0.120 1.92 0.127 2.03
Wood products -0.219 -4.34 -0.214 -4.22
Chemicals 0.242 4.13 0.234 3.95
Rubber, plastics 0.142 3.36 0.136 3.24
Basic metals 0.219 2.68 0.217 2.67
Fabricated metals 0.114 3.65 0.118 3.77
Machinery, equipment 0.275 7.96 0.271 7.89
Electrical machinery 0.116 3.10 0.106 2.28
Medical etc instruments 0.183 3.82 0.171 3.49
N 4142 4142
Psuedo R2 0.25 0.24
Smith-Blundell test 2(1 df) 12.87
a
R&D was replaced by its predicted value (R&ˆ D) in the endogenous model. These values were obtained from estimating Equation (3) (c.f. Table 2). b The z-statistics reported here have been ‘corrected’ when R&D is instrumented, using the formula for the variance-covariance matrix provided in Maddala (1983).
[image:29.595.103.537.100.638.2]Table 4. Weighted reduced-form probit models of determinants of exporting and R&D in GB non-manufacturing, 2004
Dependent variable Independent variables
Exports R&D
x p
ˆ/ z-value pˆ/x z-value X
Establishment size
20-49 employees 0.018 1.41 0.008 0.53 0.347
50-199 employees 0.018 1.08 0.035 1.74 0.162
200+ employees 0.002 0.09 0.091 2.37 0.043
Other factors
ln enterprise size 0.001 0.14 -0.018 -2.39 3.128
Absorptive capacity 0.017 3.38 0.163 24.01 -0.005
Industry agglomeration 0.009 3.79 0.003 0.96 0.776
ln Labour productivity 0.029 5.75 0.008 1.33 4.134
>1 region multiplant 0.028 1.59 -0.003 -0.15 0.087
Sells to national markets 0.192 16.78 0.042 3.22 0.496
US-owned 0.181 2.56 0.010 0.20 0.012
Other foreign-owned 0.100 2.91 -0.039 -1.42 0.032
International co-op 0.125 3.90 0.096 2.73 0.049
Support 0.078 3.47 0.171 5.62 0.070
Lack of qualified personnel -0.015 -0.86 0.058 2.45 0.073
Availability of finance 0.027 1.57 0.042 2.02 0.097
Region
Eastern 0.043 2.31 -0.001 -0.04 0.097
London 0.054 2.95 -0.015 -0.77 0.162
South East 0.028 1.72 -0.004 -0.24 0.152
South West 0.045 2.23 0.001 0.06 0.089
Wales -0.010 -0.49 -0.038 -1.82 0.037
Scotland 0.056 2.63 -0.020 -0.93 0.082
Industry (2-digit 1992 SIC)
Wholesale trade 0.254 9.61 0.064 2.58 0.134
Transport 0.107 4.25 -0.023 -1.16 0.036
Transport support 0.258 5.95 0.026 0.83 0.019
Post & telecoms 0.127 3.91 0.073 2.28 0.018
Financial services 0.052 1.65 0.125 3.16 0.016
Machine rental 0.062 1.78 0.025 0.69 0.028
Computing 0.260 6.75 0.233 5.77 0.047
R&D sector 0.320 6.07 0.172 3.56 0.028
Other business services 0.187 9.69 0.087 4.83 0.190
N 9119 9119
Psuedo R2 0.29 0.26
Table 5. Weighted structural probit models of determinants of exporting in GB non-manufacturing, 2004
Variables R&D exogenous R&D endogenous
pˆ/x z-stat pˆ/x z-stat
R&D 0.062 5.05 0.025 3.23
Establishment size
20-49 employees 0.020 1.77 0.018 1.63
50-199 employees 0.023 1.79 0.019 1.53
Other factors
Single-plant enterprise 0.023 1.73
Industry agglomeration 0.009 4.35 0.008 3.72
ln Labour productivity 0.029 5.71 0.028 5.53
>1 region multiplant 0.056 2.49 0.031 2.08
US-owned 0.175 2.52 0.179 2.55
Other foreign-owned 0.106 3.00 0.108 3.09
Sells to national markets 0.192 17.14 0.188 16.27
International co-op 0.129 3.94 0.114 3.55
Support 0.072 3.21 0.061 2.64
Region
Eastern 0.046 2.51 0.043 2.36
London 0.057 3.11 0.057 3.10
South East 0.031 1.94 0.030 1.85
South West 0.044 2.19 0.046 2.28
Scotland 0.060 2.80 0.060 2.82
Industry (2-digit 1992 SIC)
Wholesale trade 0.247 9.44 0.244 9.27
Transport 0.104 4.22 0.110 4.32
Transport support 0.253 5.87 0.254 5.89
Post & telecoms 0.123 3.78 0.117 3.66
Financial services 0.038 1.26
Machine rental 0.059 1.72 0.059 1.72
Computing 0.233 6.16 0.227 5.78
R&D sector 0.303 5.90 0.294 5.55
Other Business services 0.176 9.45 0.176 8.98
N 9199 9199
Psuedo R2 0.30 0.29
Smith-Blundell test 2(1 df) 4.78
[image:31.595.96.542.98.589.2]