Credit Constraints and Spillovers from Foreign Firms in China
September 7, 2015
Abstract
This paper examines whether credit constraints affect Chinese firms’ absorption of productivity
spillovers originating from the activity of foreign-owned firms. Using firm-level data for 2001-2005, we find evidence of positive spillovers originating from foreign-owned firms from countries
other than Hong Kong, Macau and Taiwan for non-state owned Chinese firms operating in the
same industry and province. Using an index of external finance dependence to measure credit
constraints, we find that only non state-owned firms operating in industries with external finance dependence below the index median exhibit significantly positive spillovers from the activity of
foreign firms.
Keywords: foreign direct investment; knowledge spillovers; credit constraints; China.
1
Introduction
In August 2012, Lenovo, the largest PC manufacturer in China, poached more than 40 laid-off employees from rival Motorola shortly after the latter announced its plan to cut 4,000 jobs globally. The main objective behind this move, according to Chen Wenhui, Lenovo’s general manager of phone R&D, was to take advantage of the former Motorola employees’ vast experience in overseas markets. Similarly, Google’s announcement that it was shutting down its search service Google.cn in 2010, resulted in a rush from its Chinese competitors to hire the company’s best staff.1 While a large number of Chinese companies have enjoyed the opportunity of tapping into a pool of workers trained in cutting-edge global corporations as well as adapting these multinationals’ technology and management practices, a large number of firms, particularly privately-owned firms, are unable to take advantage of these type of positive external effects associated with the operation of foreign-owned firms, which we refer to from here on as spillovers from foreign activity.
In this paper we ask whether credit constraints hinder the ability of Chinese firms’ to benefit from productivity spillovers arising from the operation of foreign-owned firms. To address this research question, however, we first need to establish whether domestically-owned Chinese firms in our sample actually enjoy benefits or positive spillovers from a greater level of activity of foreign-owned firms.2 Our first set of results provides evidence in support of spillovers from foreign activity to Chinese-owned firms operating in the same industry and province. Further inspection reveals that this positive average effect hides significant heterogeneity in the response of domestic producers to foreign firm activity, which depend both on the origin of capital sources for foreign firms and the ownership status of domestic firms. In particular, we find that: (i) only the activities of foreign firms that do not originate in Hong Kong, Macau or Taiwan (HMT) have a significantly positive effect on the value-added of Chinese firms and (ii) only non state-owned firms, i.e. privately and collectively-owned enterprises, enjoy spillovers from foreign activity.3 These results conform with the received wisdom that a substantial number of HMT-based firms are established by Chinese entrepreneurs primarily to take advantage of fiscal incentives available to foreign-invested enterprises and also that state-owned enterprises facing ‘soft budget constraints’ and pursuing multiple economic and social objectives are less likely to adopt productivity-enhancing techniques diffusing from multinational firms (Abraham et al.,2010;Prasad and Wei,2007;Bajona and Chu,2010;Xu,2011).
Our main result shows that credit constraints present a significant obstacle to the absorption of productivity spillovers originating from foreign firms by Chinese firms. Using a sectoral index of credit constraints proposed by Rajan and Zingales (1998), we find that non state-owned Chinese firms operating in industries with external finance dependence below the median of this index exhibit an elasticity of output with respect to foreign activity in the same industry and province
1
http://www.chinadaily.com.cn/business/2012-12/03/content_16054002.htm.
2
The surveys byG¨org and Greenaway(2004) andKeller(2004) discuss in detail the problems associated with the empirical identification of spillovers from foreign direct investment; for the specific case of China, seeHale and Long
(2011).
3The elasticity of real value-added with respect to foreign activity is statistically significant and of similar
of 0.047. On the other hand, credit-constrained firms, i.e. firms with external finance dependence above the median, do not benefit at all from the operation of nearby multinational firms in their own industry. This result has important policy implications. Governments in developing countries are keen on attracting foreign direct investment in technologically-intensive sectors. However, since these industries exhibit relatively high dependence on external finance, they might not provide the greatest benefits for local producers, unless financial markets are sufficiently developed to ensure the widespread absorption of productivity gains arising from the activities of foreign firms. Thus, this paper sheds light on the conditions that enable local firms to benefit from greater financial globalisation.
Our results are robust to alternative measures of credit constraints and firm-level performance measures, the use of lagged measures of inputs and foreign activity and various arrangements of clustering of standard errors. We also find that the negative relationship we establish between external finance dependence and spillovers from foreign activity is not capturing a relationship between the activity of foreign firms with sectoral characteristics other than credit constraints such as capital intensity or tradability.
Over the past two decades China has been one of the world’s most important recipients of foreign direct investment (FDI), partly because of the size and growth of its internal market and its abundance of unskilled labour, but also because foreign firms have been attracted by a wide range of policies and incentives laid out by the Chinese government, e.g. generous fiscal schemes favouring foreign-invested enterprises and the establishment of special economic zones. The existence of positive spillovers arising as a by-product of the activities of multinational firms has frequently been used to justify the use of these policies. In this paper, however, we show that the presence and encouragement of foreign firms is not sufficient for domestic firms to benefit from the activities of foreign-owned firms.
Our finding that productivity gains from spillovers only accrue to local firms not facing credit constraints is of particularly importance for China. The 2003 Investment Climate Survey carried out by the World Bank shows that privately-owned Chinese firms enjoy much less access to formal finance than firms in any other East Asian country. Several authors have pointed to the high level of state ownership characterising China’s banking system as the main culprit behind this phenomenon, as a large share of credit is channeled towards state-owned enterprises to pursue political and social objectives (Brandt and Li,2003;Cull and Xu,2003;Allen et al.,2005). Consequently, as shown by
Ayyagari et al. (2010), private Chinese firms are often forced to rely on small-scale, shorter-term
sources of informal finance, which results in them experiencing slower growth than firms with access to bank credit. Our results show that lack of access to sources of external finance also hampers potential productivity gains for privately-owned firms arising from the operation of nearby foreign firms in the same industry.
there are still relatively few works focusing on the connections between these two research areas.4 Our focus on firm-level implications of credit constraints complements the cross-country studies
of Rajan and Zingales (1998) and Alfaro et al. (2004), which find that more developed financial
markets act as a catalyst for the growth of industries that rely more on external finance and also boost the effect that foreign direct investment has on economic growth.
At a more disaggregated level, this paper is similar to Javorcik and Spatareanu (2009) and
Du and Girma (2007), who find evidence that local firms’ financial health affects their response
to foreign activity across a wide range of outcomes. Javorcik and Spatareanu (2009) show that Czech firms that are less affected by liquidity constraints are more likely to self-select into becom-ing multinationals’ suppliers. Du and Girma (2007) find that export-oriented FDI increases the likelihood of exporting for privately-owned Chinese firms, particularly those with access to bank credit, whereas domestic market-oriented FDI has a negative effect on the probability that these firms start to export. The paper most closely related to ours isVillegas-Sanchez(2009), which finds that large firms located in more financially developed regions in Mexico enjoy greater productivity spillovers from FDI. In contrast to her results, we do not find evidence that the way in which credit constraints affect domestic firms’ ability to appropriate spillovers from foreign activity differs across the size distribution of firms.
Unlike the papers described above, all of which rely on firm-level financial indicators, we use the industry-level index of external finance dependence developed byRajan and Zingales(1998) to identify credit constraints. The use of a ‘frontier technology’ measure, which reflects the outcome of efficient market conditions, has the attraction of being exogenously determined (i.e. unaffected by local decisions) which helps us in overcoming the endogeneity problem that might arise at the moment of identifying firms facing credit constraints.
The rest of the paper is organised as follows: Section 2 summarises the theoretical underpinnings for the existence of spillovers arising from the activity of foreign firms; Sections 3 and 4 describe our data and empirical methodology respectively; Our main results and robustness checks are presented in Section 5; Section 6 concludes.
2
Spillovers from foreign firms
Two central features that characterise ideas, defined in a very broad sense, are their non-rival nature and the fact that they are only imperfectly excludable.5 These two characteristics imply that some of the benefits arising from the development of new ideas can accrue to parties other than their creator. Therefore, third parties might enjoy ‘spillover’ benefits from using an idea without
4
The link between foreign direct investment and foreign firm activity on host country outcomes such as produc-tivity, employment and industrial structure is summarised byNavaretti and Venables(2006);Levine(2005) reviews the extensive body of work studying the link between finance and growth.
5This broad definition of ideas includes, but is not limited to, blueprints of new goods, innovations to production
acquiring it in a market transaction. From a theoretical standpoint, knowledge spillovers have been shown to be a crucial force driving sustained economic growth (Grossman and Helpman, 1991;
Aghion and Howitt,1992; Jones, 2005), as well as shaping market structure at the industry level
and individual firms’ productivity (Dasgupta and Stiglitz,1980;Spence,1984;Vives,2008). Because the vast majority of innovation activity takes place in only a handful of developed countries (see Eaton and Kortum, 1999), governments across the world have, especially over the last three decades, actively sought to attract foreign direct investment (FDI) not only because of its direct contribution to capital formation but also with the expectation that the operation of multinational firms would facilitate the diffusion of foreign technology and ideas towards domestic producers.6 Typical examples of policies aimed at attracting foreign multinationals include tax holi-days, lenient labour and environmental regulations, streamlined enterprise registration procedures, among other advantages. China has relied intensively on these instruments, especially through the establishment of special economic zones as noted by Naughton (1996) and Defever and Ria˜no
(2012), but it also has employed more ‘direct’ methods to elicit the diffusion of knowledge such as preconditioning access to its domestic market to foreign firms in exchange for direct handovers of technology, as documented by Holmes et al.(2013).
Findlay (1978) provides the first theoretical account in which FDI generates positive spillovers
in host countries. His model features two key elements that have remained central for the subse-quent literature: (i) foreign capital embodies more advanced technology, management techniques and know-how which are unavailable to firms in the relatively ‘backward’ host country, and (ii) domestic producers, however, can improve their efficiency through their exposure to FDI. The first assumption is founded on the observation that the technological advantage of multinational firms is a necessary condition to successfully operate in unfamiliar foreign markets while at the same time incurring the higher organisational costs associated with international production. The rationale for a potential positive effect of foreign firms’ activity on local producers follows from the work of
Polanyi (1958) and Arrow (1969), who argue that an important component of knowledge is not
codifiable (either because the problem-solver cannot fully define what he or she is doing, or because it is prohibitively costly to do so). This in turn implies that the diffusion of knowledge occurs more effectively through personal contact and demonstration facilitated by operating in close proximity to the innovator. Findlay (1978) shows in his model that the growth rate of technology in the host country is positively affected by foreign capital inflows and that this positive spillover effect from FDI is stronger the greater the technology gap is between the two countries.
Although the non-rival nature of knowledge assumed by Findlay (1978) suggests that ideas can be easily and costlessly transferred across countries,7 Cohen and Levinthal (1990) argue that local firms’ ability to assimilate new ideas and apply them to commercial means depend on their
6
SeeKeller(2004) for an extensive review about the process of international technology diffusion and the channels through which it takes place.
7
Mansfield and Romeo(1980) provide one of the earliest accounts documenting the extent and speed with which U.S. multinational firms transfer their technology to their foreign subsidiaries; more recently,Bloom and Van Reenen
‘absorptive capacity’, which is dependent on a firm’s stock of knowledge capital.8 However, since the latter is not directly observable, it is common to use a country or a firm’s skilled employment or R&D intensity to proxy it (Girma,2005).
One can, however, take a broader view of absorptive capacity and include factors other than human capital and R&D activity in shaping a firm’s ability to adapt new ideas and techniques from foreign firms. Our argument is that the extent of credit constraints can be considered an important feature of a firm’s absorptive capacity. Easier access to external finance allows firms to invest in long-term projects which in turn help them accumulate both physical and knowledge capital (see
Ayyagari et al.,2011).
3
Data
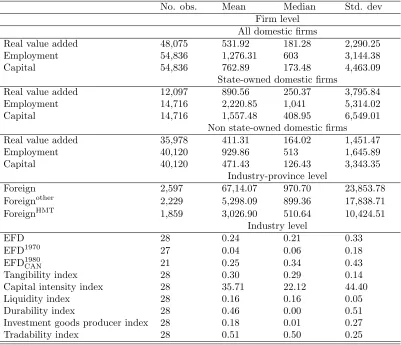
The data used in this study is drawn from the annual accounting reports in the Oriana database compiled by Bureau Van Dijk. It covers over 20,000 manufacturing firms for the period 2001-2005. The sample consists of relatively few small firms with annual sales above Yuan 1 million, and a majority of large firms with annual turnover above Yuan 5 million. The firms in our sample account for approximately 35% of total manufacturing value-added and 18% of manufacturing employment in China.
The dataset contains information on value-added, employment, input costs, geographic location, industry of operation and foreign ownership status, distinguishing whether the source of foreign investment originates from Hong Kong, Macau and Taiwan or elsewhere. Thus, we consider a firm to be foreign-owned if foreign capital participation in it exceeds 25%.9 After cleaning the data, our sample comprises 78,509 firm-year observations, of which 40% approximately are foreign-owned enterprises.10 Table 1 presents the definition of all variables used in the paper and Table 2 provides summary statistics for our sample.
In order to identify credit-constrained firms in our sample, we rely on the industry-level (ISIC-3 digit) index of external finance dependence (EFD) proposed by Rajan and Zingales (1998) and made available byBraun(2003). This index is constructed as the share of capital expenditures not financed with cash flow from operation for the median publicly-listed firm in each 3-digit industry in the United States averaged over the 1980s.11 Because the U.S. has one of the most sophisticated
8Keller(1996) incorporates the notion of absorptive capacity into an endogenous growth model. He shows that
in order for the gains from greater trade openness (due to the acquisition of new technologies from abroad) to be sustained a country needs to accumulate skills at a higher rate than before the regime change.
9
The National Bureau of Statistics of China considers an enterprise to be foreign-funded if at least 25% of the company’s registered capital is of foreign origin in the case of limited liability corporations and Chinese-foreign equity joint ventures. Exceptions include cooperative joint ventures in which the proportion of capital to be contributed by each of the parties to the venture is stipulated by contract and the wholly-foreign owned enterprises where the entire capital comes from foreign investors.
10
Following Chen and Guariglia (2011), we drop observations with negative sales, negative total assets minus total fixed assets, negative total assets minus liquid assets; and negative accumulated depreciation minus current depreciation.
11
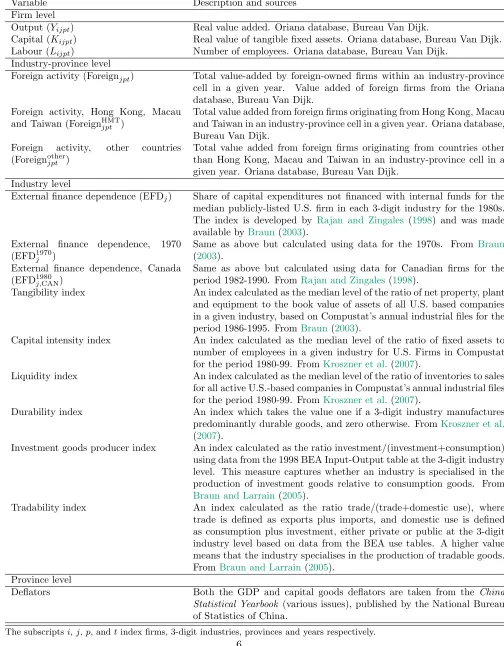
Table 1: Variable description and sources
Variable Description and sources
Firm level
Output (Yijpt) Real value added. Oriana database, Bureau Van Dijk.
Capital (Kijpt) Real value of tangible fixed assets. Oriana database, Bureau Van Dijk.
Labour (Lijpt) Number of employees. Oriana database, Bureau Van Dijk.
Industry-province level
Foreign activity (Foreignjpt) Total value-added by foreign-owned firms within an industry-province cell in a given year. Value added of foreign firms from the Oriana database, Bureau Van Dijk.
Foreign activity, Hong Kong, Macau and Taiwan (ForeignHMTjpt )
Total value added from foreign firms originating from Hong Kong, Macau and Taiwan in an industry-province cell in a given year. Oriana database, Bureau Van Dijk.
Foreign activity, other countries (Foreignotherjpt )
Total value added from foreign firms originating from countries other than Hong Kong, Macau and Taiwan in an industry-province cell in a given year. Oriana database, Bureau Van Dijk.
Industry level
External finance dependence (EFDj) Share of capital expenditures not financed with internal funds for the
median publicly-listed U.S. firm in each 3-digit industry for the 1980s. The index is developed by Rajan and Zingales (1998) and was made available byBraun(2003).
External finance dependence, 1970 (EFD1970j )
Same as above but calculated using data for the 1970s. From Braun
(2003). External finance dependence, Canada
(EFD1980j,CAN)
Same as above but calculated using data for Canadian firms for the period 1982-1990. FromRajan and Zingales(1998).
Tangibility index An index calculated as the median level of the ratio of net property, plant and equipment to the book value of assets of all U.S. based companies in a given industry, based on Compustat’s annual industrial files for the period 1986-1995. FromBraun(2003).
Capital intensity index An index calculated as the median level of the ratio of fixed assets to number of employees in a given industry for U.S. Firms in Compustat for the period 1980-99. FromKroszner et al.(2007).
Liquidity index An index calculated as the median level of the ratio of inventories to sales for all active U.S.-based companies in Compustat’s annual industrial files for the period 1980-99. FromKroszner et al.(2007).
Durability index An index which takes the value one if a 3-digit industry manufactures predominantly durable goods, and zero otherwise. FromKroszner et al.
(2007).
Investment goods producer index An index calculated as the ratio investment/(investment+consumption) using data from the 1998 BEA Input-Output table at the 3-digit industry level. This measure captures whether an industry is specialised in the production of investment goods relative to consumption goods. From
Braun and Larrain(2005).
Tradability index An index calculated as the ratio trade/(trade+domestic use), where trade is defined as exports plus imports, and domestic use is defined as consumption plus investment, either private or public at the 3-digit industry level based on data from the BEA use tables. A higher value means that the industry specialises in the production of tradable goods. FromBraun and Larrain(2005).
Province level
Deflators Both the GDP and capital goods deflators are taken from the China
Statistical Yearbook (various issues), published by the National Bureau
of Statistics of China.
Table 2: Summary statistics
No. obs. Mean Median Std. dev Firm level
All domestic firms
Real value added 48,075 531.92 181.28 2,290.25
Employment 54,836 1,276.31 603 3,144.38
Capital 54,836 762.89 173.48 4,463.09
State-owned domestic firms
Real value added 12,097 890.56 250.37 3,795.84
Employment 14,716 2,220.85 1,041 5,314.02
Capital 14,716 1,557.48 408.95 6,549.01
Non state-owned domestic firms
Real value added 35,978 411.31 164.02 1,451.47
Employment 40,120 929.86 513 1,645.89
Capital 40,120 471.43 126.43 3,343.35
Industry-province level
Foreign 2,597 67,14.07 970.70 23,853.78
Foreignother 2,229 5,298.09 899.36 17,838.71
ForeignHMT 1,859 3,026.90 510.64 10,424.51
Industry level
EFD 28 0.24 0.21 0.33
EFD1970 27 0.04 0.06 0.18
EFD1980CAN 21 0.25 0.34 0.43
Tangibility index 28 0.30 0.29 0.14
Capital intensity index 28 35.71 22.12 44.40
Liquidity index 28 0.16 0.16 0.05
Durability index 28 0.46 0.00 0.51
Investment goods producer index 28 0.18 0.01 0.27
Tradability index 28 0.51 0.50 0.25
financial systems in the world and the EFD index is constructed using data for publicly-listed firms, it should closely reflect firms’ optimal choice for external finance in an unconstrained environment. This index has been widely used as a proxy for the extent of financial constraints (Kroszner et al.,
2007;Beck et al.,2008;Manova, 2013).
The theoretical underpinning of the EFD index is that key factors determining a firm’s demand for external funds, such as project scale, gestation and cash harvest periods, and the requirement for continuing investment are intrinsic to the production technology available in the firm’s indus-try. Thus, firms operating in sectors characterised by larger minimum scale requirements, longer gestation periods, higher R&D intensity or working capital needs are more likely to face credit constraints. Based on the EFD index, industries identified to be heavily reliant on external fi-nance include plastic products, machinery and professional equipment whereas sectors like tobacco, footwear, and clothing are in the lower end of the ranking.
Table 3: Firm differences across ownership and external finance dependence
Ownership External finance dependence
Mean Foreign Domestic Below median Above median
Employment 915.16 1,233.32a 1,273.74 1,277.69
Real value added 575.31 530.71a 627.37 444.81a
Real sales 2,385.40 1,927.48a 2,104.23 1,680.72a
Value added/employee 0.87 0.57a 0.63 0.52a
Total Factor Productivity (TFP) 43.14 34.08a 29.68 25.24a
Number of firms 8,003 12,967 6,175 6,941
a,b,cmean that the variable of interest is significantly different from 0 at 1, 5 and 10 percent level respectively,
across the ownership and external finance dependence categories. Total Factor Productivity (TFP) is calculated using theLevinsohn and Petrin(2003) methodology. The comparison of outcomes above and below the median external finance dependence is conducted for the sample of domestic firms.
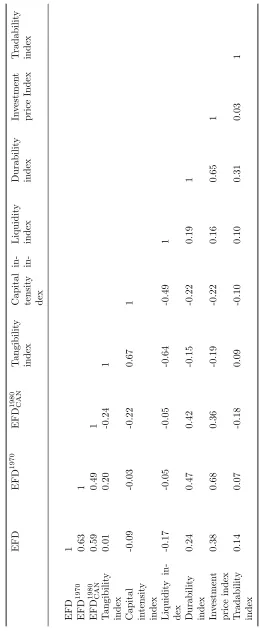
credit constraints. The raw correlation between the EFD index based on U.S. data for the 1980s and its counterpart for Canada during the same period stands at 0.59, while the correlation between the U.S. index in the 1970s and 1980s is 0.63 (see Table A.1); rank correlations among the three indices are all above 0.43. Reassuringly, Rajan and Zingales (1998) and Braun (2003) also note that the EFD index varies substantially more between sectors than among firms within the same industry.
The characteristics of firms in our sample conform with the ownership and access to finance premia evidence available for other countries (Antr`as and Yeaple, 2013; Campello et al., 2010). Table 3 shows that foreign-owned firms are on an average larger in terms of value-added and sales (although they are smaller in terms of employment) and more productive than their Chinese-owned counterparts. Similarly, domestically-owned firms producing in sectors with low external finance dependence outperform firms that are more likely to face credit constraints. This preliminary evidence is consistent with the findings ofChen and Guariglia(2011) who, using different measures, show that credit constraints also have detrimental effects on the performance of Chinese firms in terms of asset growth and productivity.
4
Baseline specifications and estimation methodology
The first step in our empirical analysis involves establishing the existence of spillovers arising from the activity of foreign firms on their domestically-owned counterparts in the same industry and province. To do so, we follow Aitken and Harrison (1999) and Javorcik (2004) by estimating a Cobb-Douglas production function augmented to account for spillovers from the presence of foreign firms. Therefore our first estimating equation is:
where the subscripts i, j, p and t index firms, industries, provinces and years respectively. Yijpt denotes real value-added and Kijpt and Lijpt are capital and labour inputs respectively.12 Our measure of spillovers arising from foreign activity, Foreignjpt, is defined as total real value-added accounted for foreign-owned firms in the same industry and province as firm i in a given year; φi and φt are firm and year-specific fixed effects, and εijpt is a random error term which might be correlated over time within firms (standard errors are clustered at the firm-level).13
Taking the same industry-province cell to be the reference ‘spillover pool’ assumes that pro-ductivity spillovers from foreign firms are more likely to be quantitatively important for domestic firms operating in close proximity to their foreign counterparts in the same industry. This assump-tion is supported by the findings of Wei and Liu (2006) and Girma and Gong (2008), who show that spillovers from foreign direct investment in China are more pronounced within regions and geographical industrial clusters than across firms within the same region operating across differ-ent industries. Therefore, to the extdiffer-ent that domestic firms benefit from the scale of operation of foreign firms in the same province and industry, the parameter γ is expected to be positive and significant. Our choice of estimating a value-added rather than a gross output production function follows Feenstra et al. (2011), who argue that the former is preferable in the case of China given the prevalence of export processing activities which tend to be intensive in the use of imported intermediate inputs.
The intuition behind our empirical specification is that the (potentially) more advanced tech-nological capabilities or efficient organisational structure of foreign-owned firms gradually leaks out of the boundaries of the firm and can thus be absorbed by local producers. These spillovers might take place through a variety of channels which include, but are not limited to (i) direct imitation/demonstration effects (Das,1987;Wang and Blomstrom,1992); (ii) tougher competition putting pressure on firms to ‘trim down their fat’ in order to remain in the market (Blomstrom and
Kokko,1998;Aitken and Harrison,1999); (iii) through vertical linkages that facilitate the contact
between multinational customers and domestic firms (Javorcik,2004) and (iv) labour turnover from foreign to domestic-owned firms (Fosfuri et al.,2001). Although some of these channels might be operative through the continuous interaction between domestic and foreign firms in product and labour markets, the focus of this paper is on whether the existence and magnitude of spillovers from foreign activity experienced by Chinese firms is mediated by the degree of credit constraints they face. For instance, integrating into a multinational supply chain might necessitate a domestic firm to retool its production facilities or improve the quality of its output; similarly, attracting new personnel employed in nearby multinationals could also put pressure on payroll costs. Therefore, tighter credit constraints might preclude firms from enjoying positive external effects brought about by the operation of foreign firms.
12
Firm-level value-added and our measure of foreign-firm activity are both deflated using province-level GDP deflators, while capital is deflated using a province-level deflator for fixed capital formation available from China’s Statistical Yearbook.
13Tables A.3 and A.9 show that our results are robust to more conservative clustering arrangements of standard
We use regression (1) not only to establish the existence of spillovers from foreign-owned firms in our sample, but also to ascertain whether the source of investment for foreign firms or the ownership structure of local firms affect the magnitude of the spillover effects. For instance, it is likely that there is a greater scope for the diffusion of productivity-enhancing knowledge from foreign-owned firms originating from developed countries than from Chinese-owned shell corporations based in Hong Kong, Macau and Taiwan (HMT) engaged in ‘round-tripping’ aimed at taking advantage of preferential tax treatment targeted towards foreign firms (Prasad and Wei,2007). However, it is also possible that foreign firms originating in HMT play a role in connecting Chinese producers to foreign customers by establishing distribution links or by providing information on foreign tastes and preferences, since Hong Kong, Macau and Taiwan are home to a large number of subsidiaries of corporations based in developed countries. Thus, we re-estimate equation (1) including separately the total value-added accounted for foreign firms originating from Hong Kong, Macau and Taiwan in an industry-province cell, ForeignHMTjpt , and the total value-added from foreign firms originating elsewhere, Foreignotherjpt .
Similarly, the ownership structure of domestic firms can be an important factor influencing their decision to internalise productivity-enhancing ideas from nearby foreign firms. For instance, state-owned enterprises (SOE) facing a soft budget constraint are more likely to be poorly managed and less likely to adopt innovations and managerial and organisational techniques from foreign firms.14 We classify domestically-owned firms in two groups: SOEs and non-state-owned enterprises, the latter including both privately-owned firms and collective-owned enterprises, and we estimate re-gression (1) for each subsample. Previous work classifies firms according to their largest ownership type in a given year. However, according toSun et al.(2002), the Chinese government uses a ‘state ownership scheme’, which means that if the assets of a SOE are not completely sold to private investors, the SOE is still not considered fully privatised and therefore is still required to conform with communist public ownership principles. Hence, to take this institutional feature into consider-ation, we identify a domestic firm to be state-owned if the paid-in-capital contributed by the state is strictly positive, followingDollar and Wei(2007). The remaining firms are classified as non-state owned enterprises, and we allow domestic firms to switch ownership status across years.
To investigate whether the extent of credit constraints affects the magnitude of spillovers ac-cruing to domestically-owned Chinese firms, we augment regression (1) with an interaction term between our measure of foreign activity in an industry-province cell and the industry-level index of external finance dependence described in Section 3. Thus, our main empirical specification is:
lnYijpt =α+βKlnKijpt+βLlnLijpt+γ0ln Foreignotherjpt +
γ1
ln Foreignotherjpt ×EFDj
+φi+φt+εijpt. (2)
Based on the results obtained from estimating regression (1), which are discussed in the
follow-14SeeQian and Xu(1998) for a theoretical analysis of innovation under soft budget constraints andGirma and Gong
ing section, we use the total value-added accounted for by non-HMT, foreign-owned firms as our measure of spillovers when we estimate regression (2) for the group of non state-owned domestic firms. As a robustness check we also estimate (2) using two different variants of the external finance dependence index, one calculated using 1970s U.S. data fromBraun (2003) and the second based on data for Canadian firms between 1982 and 1990 fromRajan and Zingales (1998). We also test the continuous conditioning model in (2) against a dichotomous specification in which the sample is split at the median level of the EFD index, thus allowing for differential (but constant) effects above and below this threshold.15
Other studies have explored how financial conditions shape domestic firms’ response to the exposure to multinational firms, while also employing different measures of credit constraints. For instance, Javorcik and Spatareanu (2009) use investment’s sensitivity to cash flow as their proxy for credit constraints to explore whether these affect Czech firms’ decision to become suppliers of multinational firms. A potential drawback of using the sensitivity of investment to cash flow is that, as pointed out by Strebulaev and Whited (2012), this measure is neither sufficient nor necessary for the existence of finance constraints. Du and Girma(2007) find that exposure to export-oriented foreign direct investment, increases the probability of becoming an exporter for privately-owned Chinese firms, in particular for those with access to bank credit. The use of firm-level variables to capture financial constraints as in the previously mentioned papers, is likely to result in endogeneity problems if similar variables were included in equation (2), e.g. if access to bank credit is easier for highly productive firms.
In a paper closely related to ours, Villegas-Sanchez(2009) investigates whether financial devel-opment affects the size of FDI spillovers in Mexico, and also faces a similar endogeneity problem when measuring financial development at the regional level. Her financial development ranking is based on the estimated coefficients of regional dummies in a linear probability model predicting the probability that a firm would report being unable to purchase machinery and equipment due to lack of financing. Her measure might reflect the fact that that highly productive firms are less likely to report being financially constrained.16 The use of a ’technology frontier’ measure of ex-ternal finance dependence based on data for a highly developed financial market overcomes these problems in our estimation.
One concern that arises when estimating (2) is that our measure of external finance dependence might be capturing other industry-specific characteristics also affecting the level foreign activity, despite the fact that at first glance external finance dependence is only weakly correlated with other sectoral characteristics (see Table A.1). For instance,Braun and Larrain(2005) find that industries that are highly dependent on external finance are also characterised by large scale of operation, long gestation periods, high R&D intensity or high working capital needs (e.g. to maintain higher inventories). Therefore, ignoring these mechanisms, would bias the coefficientγ1in (2) upwards. To
15Unfortunately, the unbalanced nature of our panel prevents us from using the more sophisticated endogenous
threshold modelling approach developed byHansen(1999).
16She instruments regional financial development with the share of indigenous population in each region at the
deal with this potential omitted variable bias, we add interaction terms between our foreign activity variable and a host of other industry characteristics in order to verify that our main interaction term, Foreignotherjpt ×EFDj remains significant.
5
Results
Table 4 presents the estimates of the fixed-effects regression (1) across all domestic firms as well as for the subsamples split across the two types of foreign firms, (originating in Hong Kong, Macau or Taiwan (HMT) and elsewhere (other)), and domestic ownership status (state and non state-owned). The coefficients on capital and labour are both statistically significant and their magnitude is consistent with other estimates using Chinese firm-level data (Feenstra et al., 2011). Because the Hansen-Sargan test of overidentifying restrictions reported at the bottom of Table 4 strongly rejects a random effects model in favour of a fixed effects specification, all remaining regressions are estimated using fixed effects.
Our measure of foreign activity, i.e. the total value-added accounted for by foreign-owned firms in a given province-industry cell, is positive and statistically significant at 1%, which we interpret as evidence in favour of spillovers. The point estimate reported in column 1 indicates that a ten percent increase in the total value-added of foreign firms is associated with a 2.4 percent higher value-added for domestically-owned firms operating in the same industry-province. The magnitude of the estimated elasticity of output with respect to foreign activity is comparable to the estimates found by Jordaan (2005) for Mexico, Haskel et al. (2007) for the UK and Wei and Liu (2006),
Buckley et al. (2002) and Abraham et al.(2010) for China, in the range of 0.01-0.05.
Our finding of positive and significant spillovers from foreign activity is robust to a number of different econometric specifications presented in Appendix A. These include the addition of other time-varying firm-level characteristics such as firm’s age and export status (Table A.2); clustering of standard errors at the province-industry level and two-way clustering at the provinceand industry level (Table A.3);17 allowing the coefficients of capital and labour to vary at the 2-digit industry (Table A.4) and using total factor productivity (TFP) (estimated using the Levinsohn and Petrin
(2003) algorithm in the first stage) as the dependent variable (Table A.5) as in Girma and Gong
(2008),Javorcik and Spatareanu (2009) and Abraham et al.(2010).
We then proceed to disentangle the average net positive spillovers according to the source of investment of foreign-owned firms. In particular, we investigate whether the operation of multina-tionals from Hong Kong, Macau and Taiwan (HMT) generates positive spillovers for domestically-owned Chinese firms. The estimates presented in columns 2 and 3 of Table 1 show that the existence of positive spillovers is mainly driven by the operation of firms with investments originating out-side HMT. Based on these findings, the results reported in columns 4 and 5 also show that non state-owned firms are the ones benefitting the most from the presence of foreign firms. The lack of evidence of significant spillovers for state-owned firms is consistent with previous findings by
17The former allows firms’ production function residuals to be correlated within province-industry cells, while the
Table 4: Spillovers from foreign activity
Value-added All domestic firms
State-owned
Non state-owned
(1) (2) (3) (4) (5)
Capital 0.199a 0.194a 0.194a 0.272a 0.191a
(0.011) (0.011) (0.012) (0.037) (0.012) Labour 0.559a 0.559a 0.564a 0.530a 0.556a
(0.018) (0.018) (0.019) (0.062) (0.019)
Foreign 0.024a
(0.008)
Foreignother 0.018b 0.016 0.019b
(0.007) (0.015) (0.009)
ForeignHMT 0.011
(0.007)
Constant 0.512a 0.604a 0.343a -0.053 0.673a (0.131) (0.129) (0.130) (0.421) (0.141) No. of observations 40,537 38,479 34,859 8,354 30,219 No. of firms 11,521 11,135 10,323 3,020 9,435
R-squared 0.231 0.230 0.239 0.147 0.255
Sargan-Hansen statistic 465.19a 471.83a 487.45a 59.10a 495.86a
Robust standard errors clustered at the firm level in parenthesis. a, b , c significantly different from 0 at 1, 5 and 10 percent level respectively. All regressions include firm and year fixed effects. Capital is measured as the real value of tangible fixed assets. Labour is measured as the number of employees. FDI is measured as the total value-added by foreign-owned firms within an industry-province pair in a given year. ForeignHMT is measured as the total value-added accounted for foreign firms originating from Hong Kong, Macau and Taiwan (HMT) in an industry-province cell. Foreignother is measured as the total value-added from foreign firms not originating in HMT in an industry-province pair. The Sargan-Hansen statistic is an overidentifying restrictions test which is robust to heteroskedasticity and clustering. A rejection of the null hypothesis indicates that a fixed effects model is preferred to a random effects model.
Girma and Gong (2008) and Hale and Long(2011). Since we do not find evidence of productivity
spillover benefits arising from foreign firms originating from HMT or accruing to state-owned firms, the remaining of the analysis focuses on whether credit constraints mediate the spillovers generated by the activity of non-HMT firms on non-state-owned, domestic Chinese producers.
Table 5: Credit constraints and spillovers from foreign activity
Value-added of non state-owned domestic firms
EFD EFD1970 EFD1980CAN EFD EFD1970 EFD1980CAN
(1) (2) (3) (4) (5) (6)
Foreignother 0.043a 0.024b 0.059a 0.047a 0.032a 0.056a
(0.012) (0.010) (0.012) (0.012) (0.012) (0.012) Foreignother×EFD -0.097a -0.078 -0.136a
(0.025) (0.048) (0.026) Foreignother×EFD
dummy
-0.067a -0.027c -0.097a
(0.016) (0.016) (0.017) No. of observations 30,219 29,735 26,123 30,219 29,735 26,123
No. of firms 9,435 9,290 8,154 9,435 9,290 8,154
R-Squared 0.256 0.255 0.254 0.256 0.255 0.255
Robust standard errors clustered at the firm level in parenthesis. a,b , c significantly different from 0 at 1, 5 and 10 percent level respectively. All regressions include firm and year fixed effects. The coefficients on capital and labour are not reported to save space. Foreignother is measured as the total real value-added from foreign firms not
originating in HMT in an industry-province cell. EFD is the external finance dependence index constructed as the share of capital expenditures not financed with cash flows from operation for the median publicly-listed firm in each 3-digit industry in the United States averaged over the 1980s. EFD1970 is calculated in the same way as EFD but data is averaged over the 1970s. Both, EFD and EFD1970are constructed byRajan and Zingales(1998) and made
available byBraun (2003). EFD1980CAN is calculated in the same way as the other two measures but using Canadian
data averaged over the period 1982 and 1990. The index was developed and made available byRajan and Zingales
(1998).
the use of different variants of the the EFD index, the only exception being the use of the continuous index based on U.S. data for the 1970s, although in this case, the interaction is just marginally insignificant at the 10% level.
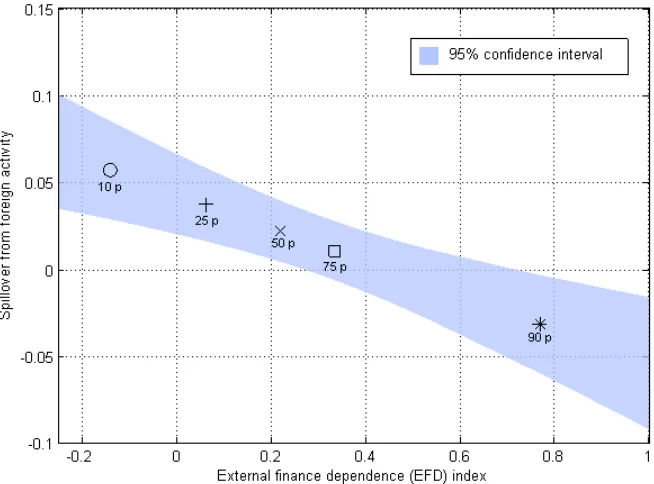
Figure 1: The effect of credit constraints on spillovers from foreign firms
The figure presents the estimated elasticity of real value-added with respect to the activity of foreign firms not originating from Hong Kong, Macau or Taiwan for non state-owned domestic firms for selected quantiles of the external finance de-pendence index. Each symbol in the figure represents the corresponding percentile of the external finance dependence index (e.g. ’x’ denotes the median andthe 75th percentile of the EFD index). The figure is based on the estimates presented in column (1) of Table 5.
Using a dummy variable splitting industries at the median EFD in column 4 of Table 5, indicates the existence of positive spillovers for non-SOE domestic firms in industries with external financial dependence below the median, confirming the results depicted in Figure 1. The dichotomous specification is our preferred one based on the J-test proposed byDavidson and MacKinnon (1981) which rejects the linear specification in favour of the exogenous sample splitting at the median model (see Table A.6). This test involves re-estimating regression (2) including the linear prediction of the competing model in each regression (continuous interaction and exogenous sample splitting).18 We interpret this result as suggestive of a threshold effect determining whether non state-owned Chinese domestic firms can benefit from the activities of foreign firms, i.e. firms unconstrained to access external finance enjoy the spillover benefits, while constrained firms are shut down from this channel for productivity gains. Girma(2005) provides empirical evidence in support of threshold
18
effects of FDI spillovers for domestic firms in the UK.
Our result that credit constraints constitute an important dimension of domestic firms’ absorp-tive capacity to benefit from spillovers from foreign-owned firms is akin to the finding byAlfaro et al.
(2004) that foreign direct investment plays an important role in contributing to economic growth in countries with more developed financial markets. Our result is also consistent with the findings of
Villegas-Sanchez(2009) for Mexico showing that firms located in more financially-developed regions
stand to achieve greater productivity gains from the operation of foreign firms.
An important issue that arises in interpreting the results from regression (2) is whether we truly are measuring cross-industry variation on the tightness of credit constraints, or if on the other hand, we are capturing other industry characteristics that are correlated with the activity of foreign firms. For instance, Defever and Ria˜no (2012) show that local governments in China actively encour-age the operation of foreign firms focused on exporting activities using fiscal incentives channeled through special economic zones. However, it is also the case that firms operating in highly trad-able industries are characterised by longer delivery lags and more complex inventory management
(Alessandria et al.,2010), which makes tradability strongly positively correlated with EFD at the
industry level. Thus, our estimated negative coefficient for the interaction term Foreignother×EFD might be picking up the fact that a greater level of activity by export-oriented multinationals could result in a tougher competitive environment and lower production by domestic Chinese firms. If this was indeed the case, we would expect that including an additional interaction term between our industry-province measure of foreign activity and an industry-level index of tradability should render the coefficient of interest,γ1, in regression (2) statistically insignificant.
We carry out this robustness exercise using a wide set of indices measuring industry characteris-tics besides tradability, which include tangibility, durability, liquidity and an indicator for industries that primarily produce investment goods drawn fromBraun and Larrain(2005) andKroszner et al.
(2007), all of which are calculated using data for publicly-listed firms in the U.S., just as our index for credit constraints.19
A greater degree of tangibility, which is a measure based on the share of total assets accounted for net property, plant and equipment, should, everything else equal, facilitate a firm’s access to external finance as asset hardness reduces the uncertainty regarding a firm’s pledgeable assets. Thus, we would expect domestic Chinese firms in highly tangible industries to enjoy positive, net spillovers from nearby non-HMT foreign firms in the same industry as they would be able to raise the required external finance by pledging hard assets as collateral. Similarly, we would expect firms in capital-intensive sectors, producing goods that are durable, tradable and for investment purposes to realise greater spillovers from multinational activity.
Our finding that only firms operating in industries characterised by low dependence on external finance enjoy spillovers from foreign firms remains statistically and economically significant after controlling for the interaction of a wide range of industry characteristics and the extent of foreign
19The correlation between EFD and the other industry characteristics we investigate ranges from -0.17 with respect
T able 7: Us ing lagged inputs and for e ign activit y V alue-added All domestic firms State-o wned Non state-o wned domestic firms (1) (2) (3) (4) (5) (6) (7) (8) Capital t − 1 0.088 a 0.087 a 0.085 a 0.014 0.094 a 0.094 a 0.094 a 0.092 a (0.011) (0.011) (0.012) (0.036) (0.012) (0.012) (0.012) (0.012) Lab our t − 1 0.194 a 0.193 a 0.197 a 0.046 0.210 a 0.204 a 0.204 a 0.205 a (0.019) (0.020) (0.020) (0.060) (0.020) (0.020) (0.020) (0.020) F oreign t 0.025 c (0.015) F oreign t − 1 0.018 c (0.010) F oreign
other t−
1 0.022 b -0.001 0.026 b 0.043 a 0.042 a 0.054 a (0.009) (0.020) (0.010) (0.014) (0.013) (0.014) F oreign
HMT t−
1 -0.004 (0.009) F oreign other t × EFD -0.082 b (0.036) F oreign
other t−
1 × EFD -0.075 a -0.082 a (0.028) (0.029) F oreign
other t−
1 × EFD dumm y -0.042 b (0.019) Constan t 3.521 a 3.328 a 3.541 a 5.197 a 3.308 a 3.398 a 3.418 3.126 a (0.156) (0.147) (0.148) (0.516) (0.157) (0.160) (0.162) (0.186) No. of observ ations 28,864 27,347 24,914 5,784 21,626 20,543 20,543 20,215 No. of firms 10,188 9,783 9,019 2,499 8,213 7,867 7,876 7,707 R-Squared 0.049 0.049 0.049 0.010 0.067 0.070 0.070 0.070 Robust standard errors clustered at the firm lev el in paren thesis. a , b , c significan tly differen t from 0 at 1, 5 and 10 p ercen t le v el resp ectiv ely . All regressions include firm and y ear fixed effects. Capit alt − 1 is measured as the real v alue of tangible fixed assets. Lab our t − 1 is measured as the n um b er of emplo y ees. F oreign t − 1 is measured as the total v alue-added b y foreign-o wned firms w ithin an industry-pro vince cell in a giv en y ear. F oreign
other t−
1 is me asured as the total v alue-added accoun ted for foreign firms not originating from Hong Kong, Macau or T aiw an (HMT) in an industry-pro vince cell. FDI
HMT t−
[image:19.612.119.507.123.670.2]activity at the province-industry level. The interaction between foreign firms’ value-added and EFD is negative and statistically significant at the 1% level when we control for all other interaction terms one by one, with the exception of the capital-intensity.20 The magnitude of the estimated coefficient
for the interaction between foreign activity and external finance dependence is quite similar across all our specifications. Thus, we are confident that the results presented in Table 5 reflect the fact that operating in an environment with tighter credit constraints reduces substantially the scope for domestic firms to realise external productivity gains arising from the operation of foreign firms.
Further robustness checks
We conduct a battery of robustness checks analogous to the one used for regression (1). Controlling for age and export status (Table A.8), clustering of standard errors at higher levels of aggregation (Table A.9), more flexible estimation of the production function parameters (Table A.10) and using total factor productivity as our dependent variable (Table A.11) all yield estimated interaction terms of similar magnitude as those presented in Table 5, and in all cases statistically significant at the 1% level.
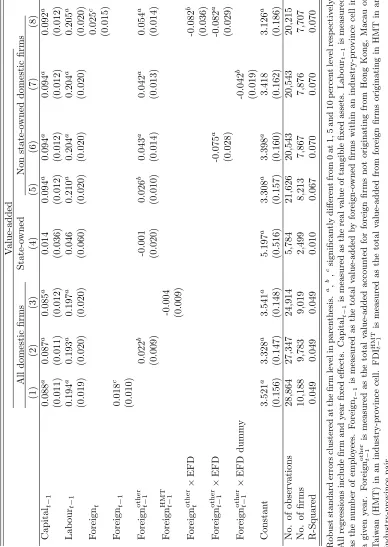
Our finding that external finance dependence is a fundamental factor in a firm’s capacity to benefit from its interaction with foreign firms, indicates that productivity spillovers do not occur automatically and might take time to materialise. Thus, Table 7 presents estimates of regressions (1) and (2) using lagged inputs and a lagged measure of foreign activity.
This empirical specification is also useful to deal with the potential endogeneity of foreign ac-tivity. Simultaneity bias could occur if foreign firm activity increases because the productivity of domestic producers in the same industry-province cell increases. AsLiu(2008) andHale and Long
(2011) point out, this bias is of greater concern when the measures of domestic and foreign activ-ity are at the same level aggregation. In our empirical specification, is plausible to assume that individual firms’ performance does not affect aggregate foreign activity at the province-industry level. Moreover, our inclusion of firm fixed effects should control for time-invariant unobservable characteristics attracting foreign firms to a particular province or industry. Additionally, the use of lagged foreign activity should reduce any concerns of endogeneity problems arising from simultane-ity bias. Keller (2004) in its review of the empirical literature that seeks to identify productivity spillovers from foreign direct investment also notes that this type of endogeneity problem does not appear to be very important for the estimation of productivity spillovers at the firm level.
The main message from Tables 4 and 5 still carries through. We find evidence of positive spillovers from the activity of non-HMT multinationals accruing to non state-owned Chinese firms. Just as in our benchmark results shown in Table 4, the activity of multinationals originating from Hong Kong, Macau or Taiwan does not improve the productivity of domestic firms and state-owned enterprises do not enjoy productivity spillovers from non-HMT foreign firms, in contrast to their
20
non-SOE counterparts.
[image:21.612.112.499.323.580.2]The results presented in columns (6) and (7) of Table 7 show again, that only non state-owned firms not facing credit constraints (operating in sectors with low dependence on external finance) receive positive productivity effects from the operation of non-HMT foreign firms in the same indus-try and province, regardless of whether we use a continuous measure of external finance dependence or an exogenous sample split at the median EFD. Column (8) includes both contemporaneous and lagged effects of foreign activity and its interaction with EFD. Foreign activity in the previous year has a much stronger effect on domestic firms’ added than the level of contemporaneous value-added of foreign firms; however the magnitude of the interaction term between foreign activity and external finance dependence contemporaneously and with one-year lag is virtually identical. At the median EFD, the elasticity of domestic firms’ value added with respect to foreign activity in the same industry and province taking place the year before is 0.037; in contrast, the elasticity with respect to the current level of foreign activity is not statistically different from zero.
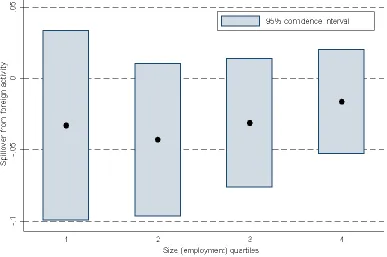
Figure 2: The effect of credit constraints on spillovers across the size distribution
The figure presents the estimated elasticity of real value-added with respect to the activity of foreign firms not originating from Hong Kong, Macau or Taiwan for non state-owned domestic firms with external finance dependence above the median level of the EFD index. Black circles denote the point estimate of the elasticity of domestic firms’ value-added with respect to foreign activity from non-HMT firms.
On the one hand, one would expect small firms to be on average farther away from the technology frontier and thus have a greater scope to benefit from knowledge spillovers from foreign firms as in
Findlay(1978); on the other hand, small firms tend to be younger and their expected profitability is
more uncertain than that of larger, more established firms. Therefore, if the absorption of spillovers necessitates costly investments, the negative effect that credit constraints have on spillovers from foreign activity should be more pronounced for small firms.
To investigate the existence of size-based non-linearities on the effect of credit constraints on domestic firms’ absorption of spillovers from foreign firms, we run regression (2) separately for each quartile of the size distribution in our sample; Figure 2 presents the estimated elasticity of domestic value-added with respect to foreign activity for each size category. Our results do not indicate the existence of significant non-linearities on the effect of credit constraints on foreign spillovers for local firms. Although the magnitude of the point-estimate for this elasticity follows a U-shape across size quartiles, none of the estimates are statistically different from zero. Therefore, our result that firms with external finance dependence above the median do not benefit from spillovers from foreign activity does not depend on firm size.
One possible explanation for this finding is that the majority of firms in our sample are actually quite large in terms of their annual turnover. If, as noted by Aterido et al. (2011), non-linearities are most important for micro and small establishments, this effect would not be evident in our regression results. Also, the results of this exercise need to be interpreted with caution because the use of a sample-splitting criterion (employment in this case) which might be endogenous to the estimating equation, could produce misleading results (seeBond and Van Reenen,2007). This would be the case if, for instance, productivity shocks unobserved by the econometrician affect a firm’s hiring – the traditional simultaneity bias arising in the estimation of production functions.
6
Conclusions
credit constraints, various clustering arrangements of standard errors and controlling for other confounding factors at the sectoral level that might influence the relationship between spillovers from the activity of foreign firms and external finance dependence.
References
Abraham, F., J. Konings, and V. Slootmaekers (2010): “FDI spillovers in the Chinese
manufacturing sector,” The Economics of Transition, 18, 143–182.
Aghion, P. and P. Howitt(1992): “A model of growth through creative destruction,”
Econo-metrica, 60, 323–351.
Aitken, B. J. and A. E. Harrison (1999): “Do domestic firms benefit from direct foreign
investment? evidence from Venezuela,”American Economic Review, 89, 605–618.
Alessandria, G., J. P. Kaboski, and V. Midrigan (2010): “Inventories, lumpy trade, and
large devaluations,”American Economic Review, 100, 2304–2339.
Alfaro, L., A. Chanda, S. Kalemli-Ozcan, and S. Sayek (2004): “FDI and economic
growth: the role of local financial markets,” Journal of International Economics, 64, 89–112.
Allen, F., J. Qian, and M. Qian (2005): “Law, finance, and economic growth in China,”
Journal of Financial Economics, 77, 57–116.
Antr`as, P. and S. R. Yeaple (2013): “Multinational firms and the structure of international trade,” NBER Working Papers 18775, National Bureau of Economic Research.
Arrow, K. J. (1969): “Classificatory notes on the production and transmission of technological knowledge,” American Economic Review, 59, 29–35.
Aterido, R., M. Hallward-Driemeier, and C. Pag´es(2011): “Big constraints to small firms
growth? business environment and employment growth across firms,” Economic Development and Cultural Change, 59, 609–647.
Ayyagari, M., A. Demirg¨uc¸-Kunt, and V. Maksimovic (2010): “Formal versus informal
finance: evidence from China,” Review of Financial Studies, 23, 3048–3097.
——— (2011): “Firm innovation in emerging markets: the role of finance, governance, and com-petition,”Journal of Financial and Quantitative Analysis, 46, 1545–1580.
Bajona, C. and T. Chu (2010): “Reforming state owned enterprises in China: effects of WTO
accession,” Review of Economic Dynamics, 13, 800–823.
Beck, T., A. Demirg¨uc¸-Kunt, L. Laeven, and R. Levine (2008): “Finance, firm size, and
growth,” Journal of Money, Credit and Banking, 40, 1379–1405.
Blomstrom, M. and A. Kokko(1998): “Multinational corporations and spillovers,”Journal of
Economic Surveys, 12, 247–277.
Bloom, N. and J. Van Reenen(2007): “Measuring and explaining management practices across
firms and countries,” The Quarterly Journal of Economics, 122, 1351–1408.
Bond, S. and J. Van Reenen (2007): “Microeconometric models of investment and
employ-ment,” in Handbook of Econometrics, ed. by J. Heckman and E. Leamer, Elsevier, vol. 6 of Handbook of Econometrics, chap. 65.
Braun, M.(2003): “Financial contractibility and asset hardness,” Manuscript, University of Cal-ifornia, Los Angeles.
Braun, M. and B. Larrain(2005): “Finance and the business cycle: international, inter-industry evidence,” Journal of Finance, 60, 1097–1128.
Buckley, P. J., J. Clegg, and C. Wang(2002): “The impact of inward FDI on the performance
of Chinese manufacturing firms,” Journal of International Business Studies, 33, 637–655.
Campello, M., J. R. Graham, and C. R. Harvey (2010): “The real effects of financial
constraints: evidence from a financial crisis,” Journal of Financial Economics, 97, 470–487.
Chen, M. and A. Guariglia (2011): “Financial constraints and firm productivity in China:
do liquidity and export behavior make a difference?” Discussion Papers 11/09, University of Nottingham, GEP.
Cohen, Wesley, M. and D. A. Levinthal(1990): “Absorptive capacity: a new perspective on
learning and innovation,” Administrative Science Quarterly, 35, 128–152.
Cull, R. and L. C. Xu (2003): “Who gets credit? the behavior of bureaucrats and state banks in allocating credit to Chinese state-owned enterprises,” Journal of Development Economics, 71, 533–559.
Das, S. (1987): “Externalities, and technology transfer through multinational corporations: a theoretical analysis,” Journal of International Economics, 22, 171–182.
Dasgupta, P. and J. Stiglitz (1980): “Industrial structure and the nature of innovative activ-ity,” Economic Journal, 90, 266–293.
Davidson, R. and J. G. MacKinnon (1981): “Several tests for model specification in the
presence of alternative hypotheses,” Econometrica, 49, 781–793.
Defever, F. and A. Ria˜no (2012): “China’s pure exporter subsidies,” CEP Discussion Papers 1182.
Dollar, D. and S.-J. Wei (2007): “Das (Wasted) Kapital: firm ownership and investment
efficiency in China,” NBER Working Papers 13103, National Bureau of Economic Research.
Du, J. and S. Girma(2007): “Finance and firm export in China,”Kyklos, 60, 37–54.
Eaton, J. and S. Kortum(1999): “International technology diffusion: theory and measurement,” International Economic Review, 40, 537–570.
Feenstra, R. C., Z. Li, and M. Yu(2011): “Exports and credit constraints under incomplete
information: theory and evidence from China,” NBER Working Papers 16940.
Findlay, R. (1978): “Relative backwardness, direct foreign investment, and the transfer of tech-nology: a simple dynamic model,” The Quarterly Journal of Economics, 92, 1–16.
Fosfuri, A., M. Motta, and T. Ronde (2001): “Foreign direct investment and spillovers
through workers’ mobility,”Journal of International Economics, 53, 205–222.
Girma, S. and Y. Gong(2008): “FDI, linkages and the efficiency of state-owned enterprises in China,” Journal of Development Studies, 44, 728–749.
G¨org, H. and D. Greenaway (2004): “Much ado about nothing? do domestic firms really
benefit from foreign direct investment?” World Bank Research Observer, 19, 171–197.
Grossman, G. and E. Helpman (1991): Innovation and growth in the global economy,
Cam-bridge, MA: MIT Press.
Hale, G. and C. Long(2011): “Are there productivity spillovers from foreign direct investment in China?” Pacific Economic Review, 16, 135–153.
Hansen, B. E. (1999): “Threshold effects in non-dynamic panels: estimation, testing, and infer-ence,”Journal of Econometrics, 93, 345–368.
Haskel, J. E., S. C. Pereira, and M. J. Slaughter (2007): “Does inward foreign direct
investment boost the productivity of domestic firms?” The Review of Economics and Statistics, 89, 482–496.
Holmes, T. J., E. R. McGrattan, and E. C. Prescott(2013): “Quid pro quo: technology
capital transfers for market access in China,” NBER Working Papers 19249, National Bureau of Economic Research.
Javorcik, B. S. (2004): “Does foreign direct investment increase the productivity of domestic firms? in search of spillovers through backward linkages,” American Economic Review, 94, 605– 627.
Javorcik, B. S. and M. Spatareanu (2009): “Liquidity constraints and firms’ linkages with
multinationals,” World Bank Economic Review, 23, 323–346.
Jones, C. I.(2005): “Growth and ideas,” inHandbook of Economic Growth, ed. by P. Aghion and S. Durlauf, Elsevier, vol. 1 of Handbook of Economic Growth, chap. 16, 1063–1111.
Jordaan, J. A.(2005): “Determinants of FDI-induced externalities: New empirical evidence for Mexican manufacturing industries,”World Development, 33, 2103–2118.
Keller, W.(1996): “Absorptive capacity: on the creation and acquisition of technology in devel-opment,” Journal of Development Economics, 49, 199–227.
——— (2004): “International technology diffusion,”Journal of Economic Literature, 42, 752–782.
Kroszner, R. S., L. Laeven, and D. Klingebiel(2007): “Banking crises, financial dependence, and growth,” Journal of Financial Economics, 84, 187–228.
Levine, R.(2005): “Finance and growth: theory and evidence,” inHandbook of Economic Growth, ed. by P. Aghion and S. Durlauf, Elsevier, vol. 1 of Handbook of Economic Growth, chap. 12, 865–934.
Levinsohn, J. and A. Petrin(2003): “Estimating production functions using inputs to control for unobservables,”Review of Economic Studies, 70, 317–341.
Manova, K. (2013): “Credit constraints, heterogeneous firms, and international trade,” Review of Economic Studies, 80, 711–744.
Mansfield, E. and A. Romeo (1980): “Technology transfer to overseas subsidiaries by U.S.
based firms,” Quarterly Journal of Economics, 95, 737–750.
Naughton, B.(1996): “China’s emergence and prospects as a trading nation,”Brookings Papers on Economic Activity, 27, 273–344.
Navaretti, G. B. and A. J. Venables (2006): Multinational firms in the world economy,
Princeton, NJ: Princeton University Press.
Polanyi, M.(1958): Personal knowledge: towards a post-critical philosophy, Chicago, IL: Univer-sity of Chicago Press.
Prasad, E. and S.-J. Wei (2007): “The Chinese approach to capital inflows: patterns and
possible explanations,” in Capital Controls and Capital Flows in Emerging Economies: Policies, Practices and Consequences, National Bureau of Economic Research, 421–480.
Qian, Y. and C. Xu (1998): “Innovation and bureaucracy under soft and hard budget
con-straints,” Review of Economic Studies, 65, 151–164.
Rajan, R. G. and L. Zingales(1998): “Financial dependence and growth,”American Economic
Review, 88, 559–586.
Spence, M.(1984): “Cost reduction, competition, and industry performance,”Econometrica, 52, 101–121.
Strebulaev, I. A. and T. M. Whited(2012): “Dynamic models and structural estimation in
corporate finance,” Manuscript, University of Rochester.
Sun, Q., W. H. S. Tong, and J. Tong (2002): “How does government ownership affect firm
performance? evidence from China’s privatization experience,” Journal of Business Finance & Accounting, 29, 1–27.
Villegas-Sanchez, C. (2009): “FDI spillovers and the role of local financial markets: evidence from Mexico,” Manuscript, University of Houston.
Vives, X. (2008): “Innovation and competitive pressure,” Journal of Industrial Economics, 56, 419–469.
Wang, J.-Y. and M. Blomstrom (1992): “Foreign investment and technology transfer : A
simple model,” European Economic Review, 36, 137–155.
Wei, Y. and X. Liu (2006): “Productivity spillovers from R&D, exports and FDI in China’s manufacturing sector,” Journal of International Business Studies, 37, 544–557.
T
able
A.1:
Correlation
matrix
for
industry-lev
el
characteristics
EFD
EFD
1970
EFD
1980 CAN
T
angibilit
y
index
Capital
in-tensit
y
in-dex
Liquidit
y
index
Durabilit
y
index
In
v
es
tmen
t
price
Index
T
radabilit
y
index
EFD
1
EFD
1970
0.63
1
EFD
1980 CAN
0.59
0.49
1
T
angibilit
y
index
0.01
0.20
-0.24
1
Capital intensit
y
index
-0.09
-0.03
-0.22
0.67
1
Liquidit
y
in-dex
-0.17
-0.05
-0.05
-0.64
-0.49
1
Durabilit
y
index
0.24
0.47
0.42
-0.15
-0.22
0.19
1
In
v
estm
en
t
price
index
0.38
0.68
0.36
-0.19
-0.22
0.16
0.65
1
T
radabilit
y
index
0.14
0.07
-0.18
0.09
-0.10
0.10
0.31
0.03
[image:29.612.189.449.81.712.2]Table A.2: Adding time-varying firm characteristics
Value-added of domestic firms
(1) (2) (3) (4)
Capital 0.199a 0.198a 0.200a 0.198a
(0.011) (0.011) (0.011) (0.011) Labour 0.559a 0.552a 0.559a 0.551a
(0.018) (0.018) (0.018) (0.018) Foreign 0.024a 0.024a 0.024a 0.024a
(0.008) (0.008) (0.008) (0.008)
Export dummy 0.100a 0.100a
(0.016) (0.016)
Age 0.046 0.046
(0.039) (0.039) Constant 0.512a 0.524a 0.508a 0.520a
(0.131) (0.130) (0.131) (0.131) No. of observations 40,537 40,537 40,513 40,513 No. of firms 11,521 11,521 11,519 11,519 R-Squared 0.231 0.232 0.230 0.232
Robust standard errors clustered at the firm level in parenthesis. a, b , c significantly different from 0 at 1, 5 and 10 percent level respectively. All regressions include firm and year fixed effects. Capital is measured as the real value of tangible fixed assets. Labour is measured as the number of employees. Foreign is measured as the total value-added by foreign-owned firms within an industry-province pair in a given year.
Table A.3: Clustering of standard errors at different levels of aggregation
Value-added of domestic firms
One-way Two-way
Standard errors clustered at: Firm Industry-province Industryand province
(1) (2) (3)
Capital 0.199a 0.199a 0.188a
(0.011) (0.011) (0.015)
Labour 0.559a 0.559a 0.568a
(0.018) (0.018) (0.042)
Foreign 0.024a 0.024c 0.023
(0.008) (0.013) (0.020)
Constant 0.512a 0.512a -0.000
(0.131) (0.175) (0.000)
No. of observations 40,537 40,537 32,801
No. of clusters 11,521 466
-R-Squared 0.231 0.231 0.24
a, b , c significantly different from 0 at 1, 5 and 10 percent level respectively. All
[image:30.612.117.496.420.609.2]