Amjad M. Al Tobia,b and Ishbel Duncanb
aCentre of Information Systems, Sultan Qaboos University, Al-Khoud, Sultanate of Oman; bSchool of
Computer Science, University of St. Andrews, Fife, Scotland, UK
ABSTRACT
DARPA 1998 was one of the first Intrusion Detection datasets that was made publicly available. The KDD 1999 dataset was derived from DARPA 1998 to be used by researchers in developing machine learning (ML), classification and clustering algorithms with a security focus. DARPA 1998 has been criticised in literature due to raised concerns of problems in the dataset. Many research- ers have accused KDD 1999 of having similar concerns but insuffi- cient published evidence has been found. In this paper, we review the KDD 1999 generation process and present new proofs of existing inconsistencies in KDD 1999. We then present the process used to link some of the KDD 1999 (TELNET) records back to their origins in DARPA 1998 and discuss the interesting results and findings of this experiment.
KEYWORDS
DARPA 1998 dataset; KDD Cup 1999 dataset; KDD review; KDD generation process; KDD generation faults
1. Introduction
The computer security field, in general, lacks open and easy access to standardised and up-to-date datasets. This might be because of privacy and confidentiality restrictions, which complicates any attempt to create a publicly available dataset. As a result of the vast variations of services and newly developed tools that emerge every day, simulation of different network traffic is a difficult task. Therefore, DARPA 1998 and KDD 1999 datasets have been widely used in research and there have been no alternatives until recently, when new datasets such as the UNB ISCX Intrusion Detection Evaluation DataSet 2012 [1] started to emerge. The DARPA 1998 and KDD 1999 datasets are also used as benchmarks to compare newly developed systems and techniques with old analysis and results. In this paper, the DARPA term refers to the DARPA 1998 dataset, KDD refers to the KDD 1999 dataset and ML refers to machine learning.
1.1. DARPA 1998 dataset
The DARPA dataset [2] was created in a joint project between the Defence Advanced Research Project Agency (DARPA), Lincoln Laboratory at Massachusetts Institute of Technology (MIT) and the Air Force Research Laboratory (AFRL/SNHS). The project (Intrusion Detection Evaluation Project) aimed to evaluate different IDS available at that time. As a result the DARPA dataset was an attempt to be the first standard corpora of its kind in the security field.
The DARPA project produced two sets of data. The first set is used for training purposes and is composed of 35 days of simulation (7 weeks, 5 days a week). The second set was aimed at testing systems under evaluation and contains 10 days of simulation (2 weeks, 5 days a week). For every simulation day, network traffic traces (TCPDUMP) and host audit data and traces (BSM [Basic Security Module]) are provided. Every trace is accompanied by a list file containing the attack details such as time, machines, ports, attack name, etc. These attacks are basically different instances of four main classes of attacks, namely: Denial of Service (DoS), Remote to Local (R2L), User to Root (U2R) and Probing. Also there are some connections, which are labelled as Anomaly.
Journal of Cyber Security Technology Sept2018
2
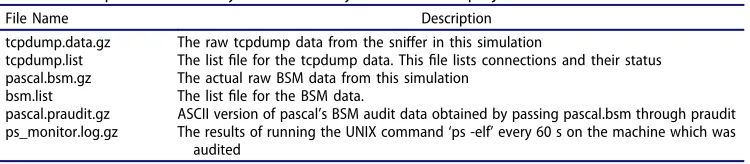
simulation day archive will contain the following important files, which include all the requiredinformation and traces of that day (see Table 1).
Almost all network-based security research focussed on ‘tcpdump.data.gz’ and ‘tcpdump.list’ in the DARPA dataset, whereas host-based security research concentrated on the other files. In this paper, the reported experiment is focused on these two files from every simulation day of the training dataset only, as they are the ones used to generate the KDD dataset.
The ‘tcpdump.list’ files provide the label of every connection in DARPA’s PCAP files (‘tcpdump.data.gz’) as the above example illustrates (Table 2). Every connection with Score zero or Name ‘-’ is normal traffic. These labels were used in the generation and labelling of KDD 1999 dataset as well as used in the analysis presented in this paper.
1.2. KDD 1999 dataset
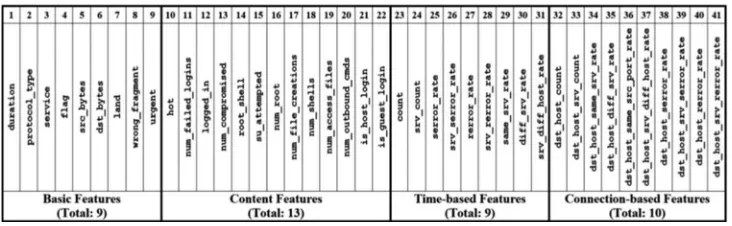
KDD [3] is basically a transformation of DARPA’s network traces into a collection of connections’ features, 41 features in total. Every connection between two hosts will represent a single record in KDD, and every record will provide a high level view of this connection based on the feature value. The 41 features are divided into four groups as shown in Table 3.
Stolfo et al. [4] and Lee et al [5–7]. have provided some details of the KDD’s generation process. They have used Bro (Network Analysis Framework) [8] to process the network traces (‘tcpdump.data.gz’ and ‘tcpdump.list’) from the two DARPA datasets to generate the equivalent KDD sets (training 743MB and testing 430MB). The KDD process has stripped five important pieces of information (start time of connection, source IP, source port, destination IP and destination port) that made it nearly impossible to link any single connection record to its source in the DARPA traces. Without this information, it was that time. As a result the DARPA dataset was an attempt to be thefirst standard corpora
of its kind in the securityfield.
The DARPA project produced two sets of data. The first set is used for training purposes and is composed of 35 days of simulation (7 weeks, 5 days a week). The second set was aimed at testing systems under evaluation and contains 10 days of simulation (2 weeks, 5 days a week). For every simulation day, network traffic traces (TCPDUMP) and host audit data and traces (BSM [Basic Security Module]) are provided. Every trace is accompanied by a list file containing the attack details such as time, machines, ports, attack name, etc. These attacks are basically different instances of four main classes of attacks, namely: Denial of Service (DoS), Remote to Local (R2L), User to Root (U2R) and Probing. Also there are some connections, which are labelled as Anomaly.
Details of the network setup of the simulation environment is provided on the DARPA project’s website [2]. All datasets andfiles are available for download from the project’s archive. In general, every simulation day archive will contain the following important files, which include all the required information and traces of that day (seeTable 1).
Almost all network-based security research focussed on ‘tcpdump.data.gz’ and ‘tcpdump.list’in the DARPA dataset, whereas host-based security research concentrated on the other files. In this paper, the reported experiment is focused on these twofiles from every simulation day of the training dataset only, as they are the ones used to generate the KDD dataset.
The‘tcpdump.list’files provide the label of every connection in DARPA’s PCAPfiles (‘tcpdump.data.gz’) as the above example illustrates (Table 2). Every connection with
Scorezero orName‘-’is normal traffic. These labels were used in the generation and labelling of KDD 1999 dataset as well as used in the analysis presented in this paper.
1.2. KDD 1999 dataset
KDD [3] is basically a transformation of DARPA’s network traces into a collection of connections’ features, 41 features in total. Every connection between two hosts will represent a single record in KDD, and every record will provide a high level view of this connection based on the feature value. The 41 features are divided into four groups as shown inTable 3:
[image:2.595.73.448.120.202.2]Stolfo et al. [4] and Lee et al [5–7]. have provided some details of the KDD’s generation process. They have used Bro (Network Analysis Framework) [8] to process the network traces (‘tcpdump.data.gz’and‘tcpdump.list’) from the two DARPA datasets to generate the equivalent KDD sets (training 743MB and testing 430MB). The KDD
Table 1.Files provided in every simulation day in the DARPA project.
File Name Description
tcpdump.data.gz The raw tcpdump data from the sniffer in this simulation
tcpdump.list The listfile for the tcpdump data. Thisfile lists connections and their status pascal.bsm.gz The actual raw BSM data from this simulation
bsm.list The listfile for the BSM data.
pascal.praudit.gz ASCII version of pascal’s BSM audit data obtained by passing pascal.bsm through praudit ps_monitor.log.gz The results of running the UNIX command‘ps -elf’every 60 s on the machine which was
audited 2 A. M. AL TOBI AND I. DUNCAN
[image:2.595.77.447.375.587.2]process has strippedfive important pieces of information (start time of connection, source IP, source port, destination IPanddestination port) that made it nearly impossible to link any single connection record to its source in the DARPA traces. Without this information, it was impossible, until now, for researchers to validate the KDD creation process. Also, all scripts used and details of tools used along with their versions and parameter settings were not publicly available, which has made any attempt to validate KDD a difficult quest. Given these concerns it is surprising that KDD was accepted as a defacto standard for researchers to test their algorithms and detection systems. Since then no published paper has ever analysed or validated this creation process, although, Perona et al. [9], have replicated the generation process of the KDD1999. However, their replication was not intended to address the limitations of the KDD1999, instead it aimed to extend the connections profiling by including their contents (payloads). Their study showed that analysis of the connections’ content can be used to detect attacks in network traffic. However, thisfinding will be restricted when such traffic is encrypted, as is the case with
Table 2.Example of DARPA 1998‘tcpdump.list’file content.
Table 3.KDD 1999 features.
Journal of Cyber Security Technology Sept2018
3
impossible, until now, for researchers to validate the KDD creation process. Also, all scripts used and details of tools used along with their versions and parameter settings were not publicly available, which has made any attempt to validate KDD a difficult quest. Given these concerns it is surprising that KDD was accepted as a defacto standard for researchers to test their algorithms and detection systems. Since then no published paper has ever analysed or validated this creation process, although, Perona et al. [9], have replicated the generation process of the KDD1999. However, their replication was not intended to address the limitations of the KDD1999, instead it aimed to extend the connections profiling by including their contents (payloads). Their study showed that analysis of the connections’ content can be used to detect attacks in network traffic. However, this finding will be restricted when such traffic is encrypted, as is the case with the modern traffic. This study has resulted in the generation of a new dataset called gureKddcup database [9] that is similar to the KDD1999, however, much cleaner with all payloads extracted.It is worth noting our analysis of KDD has revealed that the definition of a connection for ICMP is different from UDP and TCP. We noted that every ICMP packet is treated as a single connection (state-less),
whereas every connection in UDP and TCP consists of a sequence of exchanged packets between two machines (state-full). This was evident by the fact that the destination bytes field (Feature 6: dst_bytes) in all ICMP connections is always set to zero. That would mean there was no response from the other end of communicating parties. This was not the case for UDP and TCP connections.
In this paper, we present important discoveries that indicate serious flaws in KDD and we question its generation process through comparative analysis and identification of mismatches. We reveal many inconsistencies that affect many of KDD’s features, which question its reliability and suitability.
2. Existing criticism
In this section, we provide the main criticisms discussed in IDS literature about both datasets; DARPA and KDD.
2.1. DARPA
Almost all criticism in the literature is directed against DARPA and mainly concern its representation of reality. All DARPA criticism is inherited by KDD as it is a transformation of the original dataset. However, there was no secondary investigation into how it was generated and the possible faults it might have, independent from DARPA concerns. Brugger [10], has called for stopping the use of KDD in research and provided some criticism against DARPA as the source of KDD, but not the KDD dataset itself. Brugger [10], has criticised the DARPA dataset for including a very limited number of attacks which can be detected with a fixed signature.
Many have investigated the credibility of the DARPA dataset and many others have questioned its validity. For example, McHugh’s [11,12] criticism was focused on the generation methods of DARPA. He has mainly questioned the process of evaluating a real world system’s performance by using
experimental data. He has questioned the level to which the use of synthetic traffic is suitable for the process has strippedfive important pieces of information (start time of connection, source
IP, source port, destination IPanddestination port) that made it nearly impossible to link any single connection record to its source in the DARPA traces. Without this information, it was impossible, until now, for researchers to validate the KDD creation process. Also, all scripts used and details of tools used along with their versions and parameter settings were not publicly available, which has made any attempt to validate KDD a difficult quest. Given these concerns it is surprising that KDD was accepted as a defacto standard for researchers to test their algorithms and detection systems. Since then no published paper has ever analysed or validated this creation process, although, Perona et al. [9], have replicated the generation process of the KDD1999. However, their replication was not intended to address the limitations of the KDD1999, instead it aimed to extend the connections profiling by including their contents (payloads). Their study showed that analysis of the connections’ content can be used to detect attacks in network traffic. However, thisfinding will be restricted when such traffic is encrypted, as is the case with
[image:3.595.82.448.90.203.2]Table 2.Example of DARPA 1998‘tcpdump.list’file content.
Journal of Cyber Security Technology Sept2018
4
evaluation task. He also raised some concerns about the possible effects potentially caused by thearchitecture of the simulation environment on the overall evaluation.
McHugh [11,12] also questioned the use of ROC (Receiver Operating Characteristic) curve as a method for presenting the evaluation results. He has raised doubts about some unexpected problems that might take place by using this form of analysis in the IDS evaluation domain. The main problems that he has
highlighted are, ‘determining appropriate units of analysis, bias towards possibly unrealistic detection approaches, and questionable presentations of false alarm data’.
Mahoney and Chan [13,14] criticised DARPA on the data level. They have noted that most of the attacks in DARPA can be detected using the TTL (Time-to-live) field in packets headers. They have noted that the DARPA training set has eight distinct TTL values, which is an unrealistic setup. This might be caused by the scripts and software used to generate traffic in the testing environment.
2.2. KDD
Although many researchers believe that KDD has inherited DARPA’s problems, no evidence is provided to backup this claim. There were a number of attempts to analyse KDD but no actual validation or firm evaluation, especially on its generation process, was ever conducted.
Tavallaee et al. [15], have attempted to analyse KDD and they have argued that the large number of redundant records in KDD is one of the main deficiencies of this dataset. Therefore, they suggested removing duplicate records and as a result they produced a shorter version called NSL-KDD. They assumed that records with exact feature values were duplicates. However, removing these records from KDD – based on that assumption – was not reasonable, as it is not logical to identify redundant records without having access to their timestamp, source and destination addresses and ports. That is because DARPA was composed of synthetic traffic, which was mostly produced using scripts or software by varying parameters. This could have generated identical traffic but between different hosts at different times, which, when this informa- tion is stripped, will produce the illusion of having identical traffic. Also, as noted in the Introduction, KDD treated every ICMP packet as a single connection. These cases produced traffic that looked identical in many cases, resulting in identical records in the KDD dataset. Based on the discussion in the next section (3. DARPA vs. KDD), this claim of redundancy was confirmed by comparing DARPA and KDD, but identifying the duplicate records is not easy task. Identifying these duplications the way Tavallaee et al. [15], have done has similarly raised concerns.
The production of NSL-KDD has introduced some confusion between researchers, as many believe KDD and NSL-KDD are the same. For example, Wutyi and Thwin [16], used KDD in their experiment, according to their references, but in their paper they referred to the dataset as NSL-KDD. Strangely enough, some researchers get confused between DARPA and KDD. For example, Creech and Hu [17], listed criticism of KDD and its weak performance under classification and ML algorithms, but careful examination of their references demonstrates that they were referring to the DARPA dataset.
In another attempt to analyse KDD, Portnoy et al. [18], have partitioned KDD’s training data into 10 subsets, where each subset is about 10% of the original dataset. They have observed that the attacks in the KDD dataset were not evenly distributed, which has made their attempt to cross-validate very difficult. It seems that they have based their work on an assumption which neglects a crucial fact about KDD. The dataset aggregates 35 days of traffic into a single collection where the record order and
distribution were not taken into consideration. KDD’s documentation provides no hint about the order of these records. Therefore, it is possible to find a connection from the 35th simulation day at the beginning of the KDD dataset, as our experiment has revealed. In addition, a quick analysis on DARPA revealed that traffic and attack distributions between simulation days are not equally distributed; there are days that have far higher attack traffic than others. This was done deliberately to reflect real network traffic as much as possible. Therefore, splitting KDD into ten distinct subsets was neither justified nor reasonable.
Journal of Cyber Security Technology Sept2018
5
tools were to test their capabilities in distinguishing anomalous traffic from benign ones. The highnumber of counts of these two attacks could be a result of the way KDD is treating ICMP traffic -as explained in the Introduction- or due to the duplication presented in the next section (3. DARPA vs. KDD).
Bouzida et al. [20,21] ran statistical analysis on KDD and concluded that KDD’s feature set has serious limitations, rendering ML algorithms inappropriate for the task. They have reasoned the failure to detect the Remote to Local (R2L) attacks are due to problems in the transformation of DARPA into KDD. They also considered the training and test datasets of KDD to be incoherent.
Sabhnani et al. [22,23] have suggested that training and testing datasets of KDD are addressing non similar hypothesis for Remote to Local (R2L) and Local to Remote (L2R) attacks, which has resulted in a low detection rate of these types of attacks. They have also pointed out that the KDD dataset fails to provide an acceptable framework for training as the training dataset contains diminished and distorted attack signatures.
Engen et al. [24] have addressed the problem of misclassification of R2L intrusions, where they have concluded that there are lots of normal connections identical to R2L attacks. This was evident by Bouzida’s [20,21] findings, for example they have shown that there are 8054 normal connections
identical to snmpgetattack intrusions. As a result, Engen et al. [24] have listed four possible causes to this; ‘flaws in the data collection for the DARPA evaluation, limitations in Tcpdump, mislabelling or limitations in the transformation of DARPA Tcpdump to the KDD Cup ’99 data’. The latter is confirmed by the work presented in this paper.
All presented criticism have analysed one dataset independently from the other and no solid evidence for their conclusions and claims have ever been produced. This work provides solid evidence to the claims raised by Mahoney and Chan [13,14], Tavallaee et al. [15], Engen et al. [24] and Brugger’s [10]. It is unique in terms of linking connections between DARPA and KDD and identifying many serious flaws in the generation process itself. Table 4 provides a map of the analysis focus of every publication listed above.
The main contribution of this work is the analysis and the identification of the problems in the generation process of the KDD dataset. The original process was neither evaluated nor analysed in any way to test its validity in comparison to the original data. If this process was perfected and made available for the research community, we could have had various KDD-like datasets. These could have evolved through time, introducing new attacks in new ways or domains, with new feature sets or specific features for certain attack classes.
TCP traffic than what actually existed in DARPA. It also migrated less of ICMP and UDP traffic with no standard proportion sizes. This table was constructed by summing the src_bytesanddst_bytesvalues in KDD for every protocol (ICMP, TCP and UDP). In DARPA, every PCAPfile has been processed to compute the payload size of every packet and sum their total by the traffic type–ICMP, TCP and UDP.
Our initial attempt to understand the logic used to compute theContent Featuresin KDD has led to the analysis discussed in this paper. We linked some KDD connections to DARPA in order to extract the content of these connections and analysed them to reverse engineer the rules used to compute these features. This analysis has led to a deeper exploration to determine the solid linking mechanisms between the parent (DARPA) and the child (KDD) datasets.
In ourfirst experiment to link the two datasets together, we mapped the attack types between DARPA and KDD. We counted the number of every attack type in DARPA as provided in the‘tcpdump.list’files of all the 35 simulation days of the training set and matched them with their equivalents in the KDD dataset. These ‘tcpdump.list’ files provide a connection view of the DARPA dataset–as illustrated inTable 2 –and they form the original ground truth used to construct the KDD.
The following table (Table 6) shows the mapping of ALL attacks in KDD to their sources in DARPA along with the percentage of those attack connections in KDD with respect to DARPA. This table has revealed an important discovery. It clearly shows that KDD has moresmurfandimapattacks than occur in DARPA. This would mean either normal connections were incorrectly classified as attacks in KDD, as pointed out by Engen et al. [24], or duplication has taken place in the generation process, as argued by Tavallaee et al. [15]. This has resulted in KDD having more than double the total attacks in DARPA.
Table 4.Publication’s analysis focus.
DARPA KDD
● Brugger [10],
● McHugh [11,12],
● Mahoney and Chan [13,14]
● Tavallaee et al. [15],
● Portnoy et al. [18],
● Leung and Leckie [19],
● Bouzida et al. [20],
● Bouzida [21]
● Sabhnani et al. [22,23]
Our focus and contributions in this paper. We:
● Compare DARAP and KDD together
● Identify the mismatches between the number of attack connections between DARPA and KDD as well as
the differences in the total exchanged payload (two way analysis),
● Determine a linking key to match records between DARPA and KDD,
● Link Telnet connections from KDD back to their sources in DARPA and extract their content,
● Analyse the content-based features’construction process, based on the matched records,
● Identify–with evidence–problems in feature generation and computation.
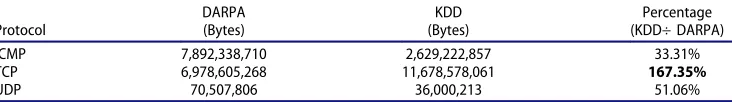
Table 5.DARPA and KDD total exchanged bytes of protocols’payloads.
Protocol DARPA(Bytes) (Bytes)KDD (KDD÷ DARPA)Percentage
ICMP 7,892,338,710 2,629,222,857 33.31%
TCP 6,978,605,268 11,678,578,061 167.35%
UDP 70,507,806 36,000,213 51.06%
Journal of Cyber Security Technology Sept2018
6
3. DARPA vs. KDD3.1. General comparison between DARPA and KDD
In our experiment we have started our analysis by comparing the total size of exchanged packets of every protocol between DARPA and KDD. This analysis – as the following Table 5 shows – has revealed a major flaw in KDD dataset as it contains more TCP traffic than what actually existed in DARPA. It also migrated less of ICMP and UDP traffic with no standard proportion sizes. This table was constructed by summing the src_bytes and dst_bytes values in KDD for every protocol (ICMP, TCP and UDP). In DARPA, every PCAP file has been processed to compute the payload size of every packet and sum their total by the traffic type – ICMP, TCP and UDP.
Our initial attempt to understand the logic used to compute the Content Features in KDD has led to the analysis discussed in this paper. We linked some KDD connections to DARPA in order to extract the
TCP traffic than what actually existed in DARPA. It also migrated less of ICMP and UDP
traffic with no standard proportion sizes. This table was constructed by summing the
src_bytesanddst_bytesvalues in KDD for every protocol (ICMP, TCP and UDP). In
DARPA, every PCAPfile has been processed to compute the payload size of every packet
and sum their total by the traffic type–ICMP, TCP and UDP.
Our initial attempt to understand the logic used to compute theContent Featuresin
KDD has led to the analysis discussed in this paper. We linked some KDD connections to DARPA in order to extract the content of these connections and analysed them to reverse engineer the rules used to compute these features. This analysis has led to a deeper exploration to determine the solid linking mechanisms between the parent (DARPA) and the child (KDD) datasets.
In ourfirst experiment to link the two datasets together, we mapped the attack types
between DARPA and KDD. We counted the number of every attack type in DARPA as
provided in the‘tcpdump.list’files of all the 35 simulation days of the training set and
matched them with their equivalents in the KDD dataset. These ‘tcpdump.list’ files
provide a connection view of the DARPA dataset– as illustrated inTable 2– and they
form the original ground truth used to construct the KDD.
The following table (Table 6) shows the mapping of ALL attacks in KDD to their
sources in DARPA along with the percentage of those attack connections in KDD with respect to DARPA. This table has revealed an important discovery. It clearly shows that
KDD has moresmurfandimapattacks than occur in DARPA. This would mean either
normal connections were incorrectly classified as attacks in KDD, as pointed out by
Engen et al. [24], or duplication has taken place in the generation process, as argued by
Tavallaee et al. [15]. This has resulted in KDD having more than double the total attacks
in DARPA.
Table 4.Publication’s analysis focus.
DARPA KDD
● Brugger [10], ● McHugh [11,12], ● Mahoney and Chan [13,14]
● Tavallaee et al. [15], ● Portnoy et al. [18], ● Leung and Leckie [19], ● Bouzida et al. [20], ● Bouzida [21] ● Sabhnani et al. [22,23] Our focus and contributions in this paper. We:
● Compare DARAP and KDD together
● Identify the mismatches between the number of attack connections between DARPA and KDD as well as the differences in the total exchanged payload (two way analysis),
● Determine a linking key to match records between DARPA and KDD,
[image:6.595.82.448.239.290.2]● Link Telnet connections from KDD back to their sources in DARPA and extract their content, ● Analyse the content-based features’construction process, based on the matched records, ● Identify–with evidence–problems in feature generation and computation.
Table 5.DARPA and KDD total exchanged bytes of protocols’payloads.
Protocol DARPA(Bytes) (Bytes)KDD (KDD÷ DARPA)Percentage
ICMP 7,892,338,710 2,629,222,857 33.31%
TCP 6,978,605,268 11,678,578,061 167.35%
UDP 70,507,806 36,000,213 51.06%
JOURNAL OF CYBER SECURITY TECHNOLOGY 7
Moreover, it is also not clear if the selection of traffic was random or not, as the percentages, also shown in Table 6, demonstrate a great deal of variations between attack types. For instance, we found that only 2.51% of pod attack were added to KDD, whereas 100% of other attacks (ftp-write, spy, etc. . .) were migrated. In addition, it was not stated anywhere in the documentation of KDD how anomaly connections were treated and whether they were added to KDD as normal traffic, or ignored. An anomaly connection is one where there is deliberate uncommon behaviour by users, such as logging in at night time, to test the system.
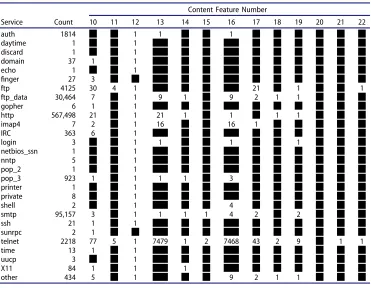
[image:6.595.82.458.339.709.2]As our attempt was to reverse engineer theContent Featuresconstruction process, we analysed KDD to discover what type of traffic affects these features. Therefore, we extracted all connection records that have at least one of theirContent Features(10–22) set to a value greater than zero. After that, we analysed the services within those connections. Table 7shows the services and their respectiveContent Features. Values of those features represent the maximum value found with respect to the service under consideration. For Table 6.DARPA and KDD attacks mapping.
Attack Class
DARPA KDD
Counts Attack Counts Attack
Percentage KDD/DARPA
DOS 2,281 back 2,203 back 96.58%
35 land 21 land 60.00%
1,526,643 neptune 1,072,017 neptune 70.22%
10,498 pod 264 pod 2.51%
250,133 smurf 2,807,886 smurf 1,122.56%
2,173 teardrop 979 teardrop 45.05%
4 syslog 0.00%
R2L 881 dict 53 guess_passwd 5.69%
1 dict_simple
50 guest
8 ftp-write 8 ftp_write 100.00%
8 imap 12 imap 150.00%
9 multihop 7 multihop 77.78%
5 phf 4 phf 80.00%
2 spy 2 spy 100.00%
1,766 warezclient 1,020 warezclient 57.72%
1 warzclient
1 warez 20 warezmaster 100.00%
19 warezmaster
U2R 11 eject 30 buffer_overflow 96.77%
1 eject-fail
10 ffb
1 ffb_clear
6 format
1 format_clear 1 format-fail
1 load_clear 9 loadmodule 75.00%
11 loadmodule
1 perl_clear 3 perl 60.00%
4 perlmagic
254 rootkit 10 rootkit 3.94%
PROBING 16,336 ipsweep 12,481 ipsweep 76.40%
2,357 nmap 2,316 nmap 98.26%
10,617 portsweep 10,413 portsweep 98.08%
32,632 satan 15,892 satan 48.70%
ANOMALY 9 anomaly 0.00%
TOTAL 1,856,771 3,925,650 211.42%
Journal of Cyber Security Technology Sept2018
7
features. This analysis has led to a deeper exploration to determine the solid linking mechanisms between the parent (DARPA) and the child (KDD) datasets.In our first experiment to link the two datasets together, we mapped the attack types between DARPA and KDD. We counted the number of every attack type in DARPA as provided in the ‘tcpdump.list’ files of all the 35 simulation days of the training set and matched them with their equivalents in the KDD dataset. These ‘tcpdump.list’ files provide a connection view of the DARPA dataset – as illustrated in Table 5 – and they form the original ground truth used to construct the KDD.
The following table (Table 6) shows the mapping of ALL attacks in KDD to their sources in DARPA along with the percentage of those attack connections in KDD with respect to DARPA. This table has revealed an important discovery. It clearly shows that KDD has more smurf and imap attacks than occur in DARPA. This would mean either normal connections were incorrectly classified as attacks in KDD, as pointed out by Engen et al. [24], or duplication has taken place in the generation process, as argued by Tavallaee et al. [15]. This has resulted in KDD having more than double the total attacks in DARPA.
Moreover, it is also not clear if the selection of traffic was random or not, as the percentages, also shown in Table 6, demonstrate a great deal of variations between attack types. For instance, we found that only 2.51% of pod attack were added to KDD, whereas 100% of other attacks (ftp-write, spy, etc. . .) were migrated. In addition, it was not stated anywhere in the documentation of KDD how anomaly connections were treated and whether they were added to KDD as normal traffic, or ignored. An anomaly connection is one where there is deliberate uncommon behaviour by users, such as logging in at night time, to test the system.
As our attempt was to reverse engineer the Content Features construction process, we analysed KDD to discover what type of traffic affects these features. Therefore, we extracted all connection records that have at least one of their Content Features (10–22) set to a value greater than zero. After that, we analysed the services within those connections. Table 7 shows the services and their respective Content Features. Values of those features represent the maximum value found with respect to the service under consideration. For example, the maximum value of feature 16 (num_root) in the Telnet service is 7468.
example, the maximum value of feature 16 (num_root) in the Telnet service is 7468. The minimum values of these features is always zero. It is also clear that feature 20 (num_outbound_cmds) is always zero. This raises a serious question about its contribu-tion to the dataset.
[image:7.595.84.455.386.674.2]The Telnet service contributes to 12 out of 13 features as clearly shown inTable 7. Therefore, the experiments described in this paper were focused on Telnet connections.
Table 7 presents another important observation, which is the generalization of features to all services. This generalisation could be considered as one of the main drawbacks of KDD. The presence of these features in connections, such as ICMP connections, will affect the learning abilities of ML algorithms and tools. This could provide an explanation of the failure in detecting attacks based on these features, such as R2L and U2R attacks.
4. Matching connections between DARPA and KDD
The second presented experiment has a number of phases, where every phase was aimed at understanding one part of the KDD’s construction process. Initially basic statistical analysis of the data (KDD and DARPA) was generated and compared. Then subsets of both datasets were selected for further analysis and matching up.
Table 7.Content features for services.
Service Count
Content Feature Number
10 11 12 13 14 15 16 17 18 19 20 21 22
auth 1814 1 1 1
daytime 1 1
discard 1 1
domain 37 1 1
echo 1 1
finger 27 3
ftp 4125 30 4 1 21 1 1
ftp_data 30,464 7 1 9 1 9 2 1 1
gopher 6 1 1
http 567,498 21 1 21 1 1 1 1
imap4 7 2 1 16 16 1
IRC 363 6 1
login 3 1 1 1 1
netbios_ssn 1 1
nntp 5 1
pop_2 1 1
pop_3 923 1 1 1 1 3
printer 1 1
private 8 1
shell 2 1 4
smtp 95,157 3 1 1 1 1 4 2 2
ssh 21 1 1
sunrpc 2 1
telnet 2218 77 5 1 7479 1 2 7468 43 2 9 1 1
time 13 1 1
uucp 3 1
X11 84 1 1 1
other 434 5 1 9 2 1 1
Journal of Cyber Security Technology Sept2018
8
The minimum values of these features is always zero. It is also clear that feature 2 (num_outbound_cmds) is always zero. This raises a serious question about its contribution to the dataset.The Telnet service contributes to 12 out of 13 features as clearly shown in Table 7. Therefore, the experiments described in this paper were focused on Telnet connections.
Table 7 presents another important observation, which is the generalization of features to all services. This generalisation could be considered as one of the main drawbacks of KDD. The presence of these features in connections, such as ICMP connections, will affect the learning abilities of ML algorithms and tools. This could provide an explanation of the failure in detecting attacks based on these features, such as R2L and U2R attacks.
4. Matching connections between DARPA and KDD
The second presented experiment has a number of phases, where every phase was aimed at
understanding one part of the KDD’s construction process. Initially basic statistical analysis of the data (KDD and DARPA) was generated and compared. Then subsets of both datasets were selected for further analysis and matching up.
4.1. Phase 1 – matching telnet attacks
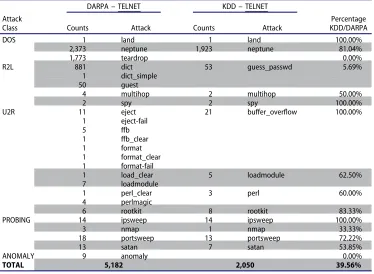
We conducted another general attack type mapping between DARPA and KDD, but this time focused on Telnet connections only. This was to determine the possibility and feasibility of conducting manual matching of these attack connections between the two datasets. The following table – Table 8 – shows that a manageable number of cases exists for the manual matching attempt.
The manual analysis of the actual content of the Telnet connections was not avoid- able. This was because of the nature of dataset and its poor documentation and lack of its original generation tools. This was a result of the fact that, these content-based features in KDD, were generated based on the actual payloads
4.1. Phase 1–matching telnet attacks
We conducted another general attack type mapping between DARPA and KDD, but this time focused on Telnet connections only. This was to determine the possibility and feasibility of conducting manual matching of these attack connections between the two datasets. The following table – Table 8 – shows that a manageable number of cases exists for the manual matching attempt.
The manual analysis of the actual content of theTelnet connections was not avoid-able. This was because of the nature of dataset and its poor documentation and lack of its original generation tools. This was a result of the fact that, these content-based features in KDD, were generated based on the actual payloads of these connections. Hence, as KDD’s generation scripts are not available, we have had to focus on a subset of the dataset to evaluate this generation process. The approach presented in this paper can be easily extended to other services as well.
[image:8.595.88.462.437.711.2]In order to be able to match records from KDD to connections in DARPA, we had to identify matching keys using the existing KDD features. Therefore, manual analysis and matching has introduced the use of duration, source bytes and destination bytes (features 1, 5 and 6) as promising keys to match Telnet connections. In the coming sections, the term‘Successfully mapped’means that we mapped a KDD record to its original connection in DARPA using all three features (duration, src_bytes, dst_bytes). The term‘partially mapped’means we have used two features (src_bytes, dst_bytes) in the mapping process.
Table 8.Mapped attacks of telnet connections in DARPA and KDD.
Attack Class
DARPA–TELNET KDD–TELNET
Counts Attack Counts Attack KDD/DARPAPercentage
DOS 1 land 1 land 100.00%
2,373 neptune 1,923 neptune 81.04%
1,773 teardrop 0.00%
R2L 881 dict 53 guess_passwd 5.69%
1 dict_simple
50 guest
4 multihop 2 multihop 50.00%
2 spy 2 spy 100.00%
U2R 11 eject 21 buffer_overflow 100.00%
1 eject-fail
5 ffb
1 ffb_clear
1 format
1 format_clear 1 format-fail
1 load_clear 5 loadmodule 62.50%
7 loadmodule
1 perl_clear 3 perl 60.00%
4 perlmagic
6 rootkit 8 rootkit 83.33%
PROBING 14 ipsweep 14 ipsweep 100.00%
3 nmap 1 nmap 33.33%
18 portsweep 13 portsweep 72.22%
13 satan 7 satan 53.85%
ANOMALY 9 anomaly 0.00%
TOTAL 5,182 2,050 39.56%
Journal of Cyber Security Technology Sept2018
9
of these connections. Hence, as KDD’s generation scripts are not available, we have had to focus on a subset of the dataset to evaluate this generation process. The approach presented in this paper can be easily extended to other services as well.In order to be able to match records from KDD to connections in DARPA, we had to identify matching keys using the existing KDD features. Therefore, manual analysis and matching has introduced the use of duration, source bytes and destination bytes (features 1, 5 and 6) as promising keys to match Telnet connections. In the coming sections, the term ‘Successfully mapped’ means that we mapped a KDD record to its original connection in DARPA using all three features (duration, src_bytes, dst_bytes). The term ‘partially mapped’ means we have used two features (src_bytes, dst_bytes) in the mapping process.
The first row of Table 9 shows that there are over 50% of Telnet records in KDD with a unique key. That means every record within that 50% has a distinct key that identifies this record alone. This gives us a good probability for one-to-one matching of Telnet connections between KDD and DARPA.
The last row of Table 9 shows that there are 45% of Telnet connections with the same key. Most of these are the neptune and portsweep attack connections, where they share the same matching key value. Appendix A presents an example of some successful mapping of the Telnet attack connections.
We have used the term collision to determine the number of records each key will map to. For example, a key with a collision degree of 3, would mean there are three records which have the same key (duration, src_bytes, dst_bytes).
Throughout our analysis, two out of the 53 guess_passwd attacks in KDD did not map to any of DARPA’s attacks. The mapping key (0,126,179) aggregated 40/53 guess_passwd KDD connections which were successfully mapped to 38 connections in DARPA with the same key. The remaining two connections did not even partially map to any connection.
Table 10 presents the number of connections for every TCP service in KDD. It also shows the percentage of the uniquely identifiable connections among all connections of a certain service. As it can be seen, only X11, IRC, smtp and telnet services have more than 50% of their connections are uniquely identifiable using the Key[dura- tion, src_bytes, dst_bytes]. Services like http_2784 and pm_dump have very small number of connections to be attractive for this investigation.
As a result, the selection of the Telnet service to be the focus of this paper was due to the following main two reasons:
1.
(1) The number of connections is very large for manual analysis. Therefore, focused cases with good diversity of attack scenarios criteria has led to the selection of the Telnet service (as shown in Tables 6 and 9),2.
(2) The Telnet service contributed to 12 out of 13 content-based features. Therefore, it was a reasonable service to focus on to determine the logic of the generation process of these features (see Table 7),Thefirst row ofTable 9shows that there are over 50% ofTelnetrecords in KDD with a unique key. That means every record within that 50% has a distinct key that identifies this record alone. This gives us a good probability for one-to-one matching of Telnet connections between KDD and DARPA.
The last row of Table 9 shows that there are 45% ofTelnet connections with the same key. Most of these are theneptuneandportsweepattack connections, where they share the same matching key value. Appendix A presents an example of some successful mapping of theTelnetattack connections.
We have used the term collision to determine the number of records each key will map to. For example, a key with a collision degree of 3, would mean there are three records which have the same key (duration, src_bytes, dst_bytes).
Throughout our analysis, two out of the 53guess_passwdattacks in KDD did not map to any of DARPA’s attacks. The mapping key (0,126,179) aggregated 40/53guess_passwd
KDD connections which were successfully mapped to 38 connections in DARPA with the same key. The remaining two connections did not even partially map to any connection.
Table 10presents the number of connections for every TCP service in KDD. It also shows the percentage of the uniquely identifiable connections among all connections of a certain service. As it can be seen, onlyX11, IRC, smtpandtelnetservices have more than 50% of their connections are uniquely identifiable using the
Key[dura-tion, src_bytes, dst_bytes]. Services likehttp_2784andpm_dumphave very
small number of connections to be attractive for this investigation.
As a result, the selection of theTelnetservice to be the focus of this paper was due to the following main two reasons:
(1) The number of connections is very large for manual analysis. Therefore, focused cases with good diversity of attack scenarios criteria has led to the selection of the Telnetservice (as shown inTables 6and9),
(2) TheTelnetservice contributed to 12 out of 13 content-based features. Therefore, it was a reasonable service to focus on to determine the logic of the generation process of these features (seeTable 7),
[image:9.595.94.370.313.421.2]Note that the main aim of this study is not tofind problems withTelnetconnections, rather it investigates the process adopted in the KDD generation that was used to engineer the features set.Telnetconnections were used as an example to illustrate many problems in the adopted extraction process and the engineering of many of the KDD’s features. Choosing
Table 9.Key-collision of telnet connections in KDD.
No. of Keys Collision Degree Coverage
2173 1 50.81%
23 2 1.08%
3 3 0.21%
3 4 0.28%
1 5 0.12%
1 7 0.16%
1 9 0.21%
1 11 0.26%
1 40 0.94%
Journal of Cyber Security Technology Sept2018
10
Note that the main aim of this study is not to find problems with Telnet connections, rather it investigates the process adopted in the KDD generation that was used to engineer the features set. Telnet connections were used as an example to illustrate many problems in the adopted extraction process and theengineering of many of the KDD’s features. Choosing connections with their Content-based features set to values greater than zero was the main selection criteria. As these small, randomly picked connections have shown so many problems, there are no guarantees that similar ones do not exist in many other connections types as well, especially services that trigger these content-based features. The approach and method presented in this study can be extended for other connections of other services to link them to their original sources in DARPA and be investigated, evaluated and analysed.
[image:10.595.83.462.98.611.2]connections with their Content-based features set to values greater than zero was the main selection criteria. As these small, randomly picked connections have shown so many pro-blems, there are no guarantees that similar ones do not exist in many other connections types Table 10. KDD TCP services and their connections counts along with their uniquely identifiable proportions.
Service Number of Connections Percentage of Uniquely Identifiable Connections
http_2784 1 100.00%
X11 135 74.07%
IRC 521 68.71%
pm_dump 5 60.00%
smtp 96,554 59.80%
telnet 4277 50.81%
ftp 5214 41.10%
pop_3 1981 24.03%
http 623,091 19.88%
finger 6891 8.42%
other 16,498 3.15%
auth 3382 1.98%
domain 1113 1.17%
imap4 1069 0.75%
time 1579 0.70%
gopher 1077 0.65%
ssh 1075 0.65%
shell 1051 0.57%
bgp 1047 0.38%
discard 1059 0.38%
echo 1059 0.38%
login 1045 0.38%
nntp 1059 0.38%
uucp 1041 0.38%
csnet_ns 1051 0.29%
exec 1045 0.29%
rje 1070 0.28%
uucp_path 1057 0.28%
whois 1073 0.28%
Z39_50 1078 0.19%
ctf 1068 0.19%
hostnames 1050 0.19%
iso_tsap 1052 0.19%
link 1069 0.19%
mtp 1076 0.19%
name 1067 0.19%
netbios_ssn 1055 0.19%
netstat 1056 0.19%
pop_2 1055 0.19%
printer 1045 0.19%
remote_job 1073 0.19%
sql_net 1052 0.19%
supdup 1060 0.19%
systat 1056 0.19%
vmnet 1053 0.19%
courier 1021 0.10%
efs 1042 0.10%
http_443 1044 0.10%
klogin 1050 0.10%
kshell 1040 0.10%
nnsp 1038 0.10%
sunrpc 1056 0.09%
private 1,024,316 0.05%
aol 2 0.00%
ldap 1041 0.00%
Journal of Cyber Security Technology Sept2018
11
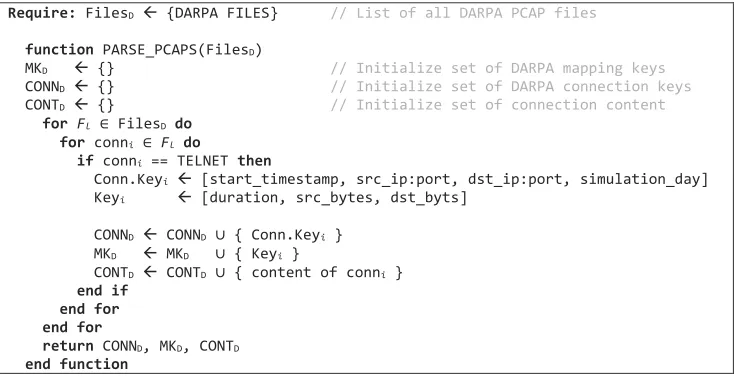
The matching process is in two steps. The first pass will match records between DARPA and KDD using the Key[duration, src_bytes, dst_bytes]. Therefore, all records between the two datasets that have the same combination of values for these fields will be added to the matched set (Successfully mapped). The second pass will attempt to match the remaining (none-matched) connections using Key[src_bytes, dst_bytes] (partial matching). The matched records at this stage will be added to the possible matched set (partially mapped). After the completion of the matching phase, selected cases were used for manual analysis. The details of the matching process is as follows:Step 1. Process every PCAP file in DARPA training dataset using Bro to produce a list of mapping keys (Key[duration, src bytes, dst bytes]) for every Telnet connection and extract their payloads (Algorithm 1 in Figure 1).
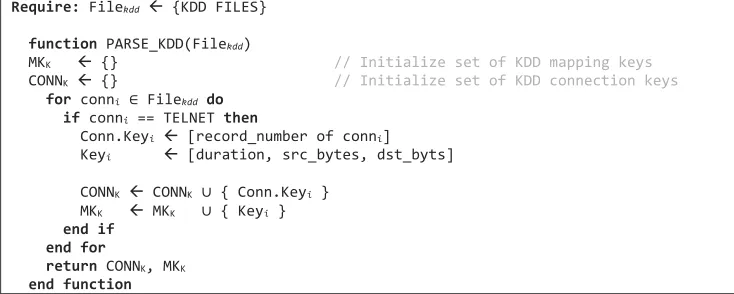
Step 2. Process KDD training dataset to produce a list of mapping keys (Key[duration, src_bytes, dst_bytes]) for every Telnet connection (Algorithm 2 in Figure 2).
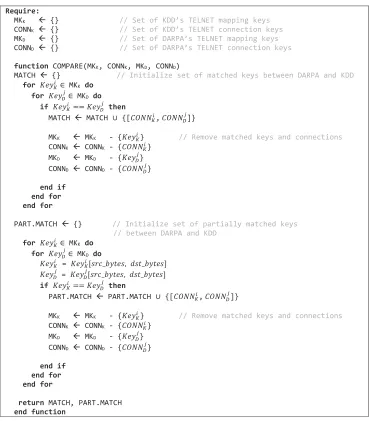
Step 3. Compare the sets of mapping keys between the two datasets as detailed in Algorithm 3 (Figure 3), by performing the following two phases:
●Phase 1 Compare all mapping keys between the two lists (MKD and MKK), if any two keys match each other, then they will be added to the match list and be removed from their respective lists
●Phase 2 Perform a partial comparison for the remaining mapping keys after the removal of the matched ones. This comparison will compare the mapping keys partially (Key[src_bytes,
dst_bytes]). If any two keys match each other, then they will be added to the partially matched list and be removed from their respective lists.
Step 4. Perform manual analysis of the matched connections by comparing the payload of multiple connections – from DARPA PCAPs – and identifying possible patterns that contributed to the setting of the features – as pro- vided by KDD. This was done by selecting a number of connections that have their content-based feature (Fi in {F10…F22}) is set to a value greater than 0.
Then, based on the definition of that feature, we performed a manual and rigorous analysis to identify all possible patterns from those connections that have contributed to this feature. Based on this analysis we were able to identify many irregularities in feature values between similar – in terms of payload – connections.
as well, especially services that trigger these content-based features. The approach and method presented in this study can be extended for other connections of other services to link them to their original sources in DARPA and be investigated, evaluated and analysed.
The matching process is in two steps. The first pass will match records between
DARPA and KDD using theKey[duration, src_bytes, dst_bytes]. Therefore, all records between the two datasets that have the same combination of values for these fields will be added to the matched set (Successfully mapped). The second pass will attempt to match the remaining (none-matched) connections using Key[src_bytes, dst_bytes] (partial matching). The matched records at this stage will be added to the possible matched set (partially mapped). After the completion of the matching phase, selected cases were used for manual analysis. The details of the matching process is as follows:
Step 1. Process every PCAPfile in DARPA training dataset using Bro to produce a list of mapping keys (Key[duration, src bytes, dst bytes]) for every Telnet connection and extract their payloads (Algorithm 1 inFigure 1).
Step 2. Process KDD training dataset to produce a list of mapping keys (Key[dura-tion, src_bytes, dst_bytes]) for everyTelnetconnection (Algorithm 2 inFigure 2).
Step 3. Compare the sets of mapping keys between the two datasets as detailed in
Algorithm 3(Figure 3), by performing the following two phases:
● Phase 1Compare all mapping keys between the two lists (MKDand MKK), if any
two keys match each other, then they will be added to the match list and be removed from their respective lists
● Phase 2 Perform a partial comparison for the remaining mapping keys after the
[image:11.595.76.443.83.271.2]removal of the matched ones. This comparison will compare the mapping keys partially (Key[src_bytes, dst_bytes]). If any two keys match each other,
Journal of Cyber Security Technology Sept2018
12
4.2. Phase 2 – analysing connection contentsApplying this matching technique, we extracted the actual content (command and response sequences) of these connections and analysed them manually. We attempted to extract the relevant patterns depending on the available documentation that, we believed, will have an effect on the content features (10–22). Based on this analysis, as will be shown in the coming sections, we were able to detect a great deal of inconsistencies in the feature generation process in the original KDD.
5. Feature analysis
In this section we present all the inconsistencies that have been detected in every feature examined in these two experiments. Also we provide, where appropriate, a better explanation of those features that were poorly described in the KDD documentation based on our observations of the linked connections with DARPA.
5.1. Basic features
5.1.1. duration (feature 1)
We have identified many irregularities affecting this feature in KDD. It represents the duration of a connection, in seconds, from start to end. In a TCP connection, this represents the period between the first and last packet within a single connection. But in ICMP connections, all durations are zero, because KDD has treated every ICMP packet as a single connection.
Studying this feature within the Telnet connections, we were able to detect that some Telnet connections in KDD have a shorter duration than their equivalent connection in DARPA. After investigating this issue, we have found that if a TCP connection is attempted, where multiple SYN packets were sent at the handshake stage, only the last SYN packet was used to mark the start time of this connection. This makes the total duration shorter by the difference between the first and last SYN packets in this phase.
Another observation was that some Telnet sessions, especially the long ones, were assigned a duration of zero in KDD. There was no explanation in the KDD documentation of these cases. The following table (Table 11) shows some examples, out of over 100 mapped cases between KDD and DARPA, with a difference in durations. The features values of src_bytes and dst_bytes in both datasets were the same for these cases, and allowed us to match the records partially. This will affect the learning capability of ML algorithms.
then they will be added to the partially matched list and be removed from their respective lists.
Step 4. Perform manual analysis of the matched connections by comparing the
payload of multiple connections – from DARPA PCAPs – and identifying
possible patterns that contributed to the setting of the features – as
pro-vided by KDD. This was done by selecting a number of connections that
have their content-based feature (Fi 2fF10! ! !F22g) is set to a value greater
than 0. Then, based on the definition of that feature, we performed a manual
and rigorous analysis to identify all possible patterns from those connections that have contributed to this feature. Based on this analysis we were able to
identify many irregularities in feature values between similar– in terms of
payload–connections.
4.2. Phase 2–analysing connection contents
Applying this matching technique, we extracted the actual content (command and response sequences) of these connections and analysed them manually. We attempted to extract the relevant patterns depending on the available documentation that, we
believed, will have an effect on the content features (10–22). Based on this analysis, as
will be shown in the coming sections, we were able to detect a great deal of incon-sistencies in the feature generation process in the original KDD.
5. Feature analysis
[image:12.595.89.456.82.229.2]In this section we present all the inconsistencies that have been detected in every feature examined in these two experiments. Also we provide, where appropriate, a better explanation of those features that were poorly described in the KDD documenta-tion based on our observadocumenta-tions of the linked connecdocumenta-tions with DARPA.
Figure 2.Algorithm 2 –KDD pre-processing.
Journal of Cyber Security Technology Sept2018
13
5.1.2. wrong_fragments (feature 8)Bro does not detect all fragmented packets as it does packet reassembling before passing them onto it’s event handler. However, Bro documentation [25], does note what it terms ‘weird’ connections whenever a fragment with certain criteria is detected, such as an excessively small fragment or fragment overlap. There are eight cases that Bro regards as fragment problems and raises an event (conn_weird) to report them [Bro 25]. It is not clear how KDD has dealt with this problem and whether the developers have used Bro or some other tool to report wrong fragments.
5.2. Content features
5.2.1. hot (feature 10)
According to the KDD documentation [3] and Stolfo et al. [4], this feature represents the number of hot indicators. Lee et al. [5–7] has explained this as an access to a system directory or a creation or execution of a program. It is not clear what folders are considered as system directories. In our manual checking for what patterns could increment this feature, we found many inconsistencies. For instance, one of these irregularities were caused by – but not limited to- Program compilation with the GCC command, which sometimes increments this feature count and sometimes does not. Therefore, we could not accurately determine the logic for this feature’s computation.
5.1. Basic features
5.1.1. duration (feature 1)
We have identified many irregularities affecting this feature in KDD. It represents the duration of a connection, in seconds, from start to end. In a TCP connection, this represents the period between thefirst and last packet within a single connection. But in ICMP connections, all durations are zero, because KDD has treated every ICMP packet as a single connection.
[image:13.595.87.456.74.495.2]Journal of Cyber Security Technology Sept2018
14
For example, in the following mapped connection (1,446,934), in Table 12, there were four calls to ‘/bin/gcc’ command, but KDD shows only three hot actions. Although connection (1,446,934) has almost the same sequence of commands and the same number of ‘/bin/gcc’ command calls as connection (3,429,269), the former failed to detect one of the ‘/bin/gcc’ command calls for no clear reason. (See Appendixes B and C for actual content.) Based on the fact that the DARPA dataset was generated using
Table
11.
Mapped
telnet
connections
with
wrong
duration
values.
KDD
DARPA
Connection
No.
Duration (sec)
Src.
Bytes
Dest.
Bytes
Duration (sec)
Src.
Port
Dest.
Port
Src.
IP
Dest.
IP
Simulation
Day
Duration
Di
ff
erence
314,400
10
269
264,946
13
2620
23
194.7.248.153
172.16.112.194
week2_wednesday
805,041
11,042
75
1,423
11,063
30,169
23
135.13.216.191
172.16.112.50
week7_tuesday
891,338
11,177
417
9,716
11,198
9432
23
135.13.216.191
172.16.112.50
week7_thursday
1,402,812
111
190
22,102
114
18,569
23
135.13.216.191
172.16.114.168
week4_wednesday
4,828,062
11,271
2,429
20,456
11,280
11,519
23
135.13.216.191
172.16.112.50
week6_friday
Zero
Duration
1,447,033
0
1,151
8,390
60,756
1024
23
205.160.208.190
172.16.112.50
week4_friday
76,079
0
142
26,316
74,258
2514
23
135.13.216.191
172.16.112.50
week1_wednesday
1,448,857
0
1,680
16,934
6,920
11,779
23
153.10.8.174
172.16.114.50
week4_friday
406,573
0
302
31,786
303,780
4578
23
135.13.216.191
172.16.112.50
week3_monday
264,455
0
303
31,907
229,525
11,340
23
135.13.216.191
172.16.112.50
week2_tuesday
[image:14.595.151.280.90.675.2]Journal of Cyber Security Technology Sept2018
15
synthetic traffic and readymade scripts that include predefined attack scenarios, it will not be surprising to see lots of connection between different hosts at different times with nearly the exact same content and payload, which was evident throughout our analysis. Much of the compared traffic will have nearly same payload, but with inconsistently different feature values.
5.2.2. num_failed_logins (feature 11)
This feature counts the number of failed login attempts. In our investigation, we found that it is
incremented whenever the ‘incorrect login’ string is present in the response message from server to the client. This means that if this message appeared in a normal response, such as an email message or SQL result, then this feature will be incremented.
Strangely enough, we identified the following case where KDD has failed to increment this feature (Table 13), even though there were two failed login attempts in this connection, as shown in Figure 4. That is because the response was ‘Login incorrect’ instead of ‘incorrect login’.
5.2.3. logged_in (feature 12)
This feature is used to indicate if a login to service was successful or not. This feature was evaluated by a blind search for the ‘last login’ pattern. Failure to detect this pattern will result in this feature not being set.
Strangely enough, we identified the following case where KDD has failed to increment this feature (Table 13), even though there were two failed login attempts in this connec-tion, as shown inFigure 4. That is because the response was‘Login incorrect’instead of‘incorrect login’.
5.2.3. logged_in (feature 12)
This feature is used to indicate if a login to service was successful or not. This feature was evaluated by a blind search for the‘last login’pattern. Failure to detect this pattern will result in this feature not being set.
Table 14presents some examples; connection (7449) detected a login even though the‘last login’ pattern is missing, whereas in connection (3,927,225) login was not detected because the pattern was missing, even though a successful login took place (seeAppendixes DandE for actual content).
5.2.4. lnum_compromised (feature 13)
According to Lee et al. [5–7], this feature represent counts of error messages, such as,
‘not found’ or‘Jump to’instructions. Our analysis has found that some connections have‘Command not found’and ‘No such file or directory’ errors, but they did not contribute to this feature’s calculation.
Table 15shows that in connection (4,810,953), KDD has counted the‘no suchfile or directory’pattern as a compromising case. Whereas in connection (805,010) the system has failed to detect this pattern but it was incremented for some other pattern.
5.2.5. lroot_shell (feature 14)
According the KDD documentation, this feature is set when a user achieved a root access to the shell. This is triggered when the terminal’s prompt settings change. For example, a change from
‘user@systemName ~ $’ to ‘systemName ~ #’ indicates the user has escalated privilege to root level. This can be useful to detect user-to-root (U2R) attacks. In our observations we found that KDD has used a very simple check to detect this pattern. The KDD generation process checked that if a server response line starts with a‘#’character then Table 12.Two mapped telnet connections with similar command sequences and different counts of hot features.
KDD DARPA
Connection
No. Duration(sec) BytesSrc. Dest.Bytes (10)F Duration(sec) PortSrc. Dest.Port Src. IP Dest. IP Simulation Day 1,446,934 53 2628 3860 3 53 23,070 23 192.168.1.10 172.16.112.50 week4_friday 3,429,269 49 2402 3939 4 49 15,374 23 197.182.91.233 172.16.112.50 week5_wednesday
Table 13.Mapped telnet connection with wrong num_failed_logins values.
KDD DARPA
Connection
No. Duration(sec) BytesSrc. BytesDest. (11)F Duration(sec) PortSrc. Dest.Port Src. IP Dest. IP Simulation Day 1,391,134 60 90 233 0 60 1026 23 207.230.54.203 172.16.114.50 week4_tuesday 18 A. M. AL TOBI AND I. DUNCAN
Strangely enough, we identified the following case where KDD has failed to increment this feature (Table 13), even though there were two failed login attempts in this connec-tion, as shown inFigure 4. That is because the response was‘Login incorrect’instead of‘incorrect login’.
5.2.3. logged_in (feature 12)
This feature is used to indicate if a login to service was successful or not. This feature was evaluated by a blind search for the‘last login’pattern. Failure to detect this pattern will result in this feature not being set.
Table 14presents some examples; connection (7449) detected a login even though the‘last login’pattern is missing, whereas in connection (3,927,225) login was not detected because the pattern was missing, even though a successful login took place (seeAppendixes D andEfor actual content).
5.2.4. lnum_compromised (feature 13)
According to Lee et al. [5–7], this feature represent counts of error messages, such as, ‘not found’or‘Jump to’instructions. Our analysis has found that some connections have ‘Command not found’ and‘No such file or directory’ errors, but they did not contribute to this feature’s calculation.
Table 15shows that in connection (4,810,953), KDD has counted the‘no suchfile or directory’pattern as a compromising case. Whereas in connection (805,010) the system has failed to detect this pattern but it was incremented for some other pattern.
5.2.5. lroot_shell (feature 14)
According the KDD documentation, this feature is set when a user achieved a root access to the shell. This is triggered when the terminal’s prompt settings change. For example, a change from
‘user@systemName ~ $’ to ‘systemName ~ #’ indicates the user has escalated privilege to root level. This can be useful to detect user-to-root (U2R) attacks. In our observations we found that KDD has used a very simple check to detect this pattern. The KDD generation process checked that if a server response line starts with a‘#’character then
Table 12.Two mapped telnet connections with similar command sequences and different counts of hot features.
KDD DARPA
Connection
No. Duration(sec) BytesSrc. BytesDest. (10)F Duration(sec) PortSrc. Dest.Port Src. IP Dest. IP Simulation Day 1,446,934 53 2628 3860 3 53 23,070 23 192.168.1.10 172.16.112.50 week4_friday 3,429,269 49 2402 3939 4 49 15,374 23 197.182.91.233 172.16.112.50 week5_wednesday
Table 13.Mapped telnet connection with wrong num_failed_logins values.
KDD DARPA
Connection
No. Duration(sec) BytesSrc. BytesDest. (11)F Duration(sec) PortSrc. Dest.Port Src. IP Dest. IP Simulation Day 1,391,134 60 90 233 0 60 1026 23 207.230.54.203 172.16.114.50 week4_tuesday
it considers that a root shell has been obtained. However, the detection of such a pattern was not always consistent as manyflaws has been detected throughout our analysis.
In the following connection (406,471) inTable 16, a root shell was obtained, but the KDD generation script has failed to detect it (seeAppendix Ffor actual content).
These inconsistences in detecting patterns might indicate that KDD has used multiple scripts with different logic in their generation process. That is because –as presented throughout this paper- a pattern will increment a feature in one connection, but it fails to do so in another one, even though same command was executed.
Figure 4.Content of telnet connection (KDD No. 1,391,134) with two failed login attempts.
Table 14.Mapped telnet connections with wrong calculation of logged_in feature.
KDD DARPA
Connection
No. Duration(sec) BytesSrc. BytesDest. (12)F Duration(sec) PortSrc. Dest.Port Src. IP Dest. IP Simulation Day 7449 184 1511 2957 1 184 1941 23 135.8.60.182 172.16.112.50 week1_monday 3,927,225 85 277 693 0 85 20,504 23 197.218.177.69 172.16.113.50 week5_friday
Table 16.Mapped telnet connections with wrong lroot_shell values.
KDD DARPA
Connection
No. Duration(sec) BytesSrc. BytesDest. (14)F Duration(sec) PortSrc. Dest.Port Src. IP Dest. IP Simulation Day 406,471 150 1,587 6,707 0 150 25,134 23 202.247.224.89 172.16.112.50 week3_monday Table 15.Mapped telnet connections with wrong lnum_compromised values.
KDD DARPA
Connection
No. Duration(sec) BytesSrc. BytesDest. (13)F Duration(sec) PortSrc. Dest.Port Src. IP Dest. IP Simulation Day 4,810,953 61 2,336 4,194 1 61 4728 23 199.174.194.16 172.16.112.50 week6_thursday 805,010 60 2,328 4,551 1 60 23,147 23 206.47.98.151 172.16.112.50 week7_tuesday