ISSN Print: 2327-6045
DOI: 10.4236/msce.2019.710004 Oct. 22, 2019 40 Journal of Materials Science and Chemical Engineering
The Microstructure and Properties of Copper
with Ceria Nanoparticles Addition
Daniela Passarelo Moura da Fonseca, Waldemar Alfredo Monteiro
Nuclear and Energy Research Institute, IPEN, Cidade Universitária, São Paulo, Brazil
Abstract
Copper-based composites strengthened by ceria nanoparticles were processed by conventional powder metallurgy: mixing (30 min and 46 rpm), compac-tion (cold, uniaxial, 1080 MPa for 10 s) and sintering (800˚C for 6 h in va-cuum atmosphere of 10−5 torr). It was studied the microstructure (optical
mi-croscopy, scanning electron microscopy), X-ray diffraction with Rietveld re-finement and some properties (electrical conductivity, Vickers hardness and fracture analysis) of the compositions 92 wt% Cu - 8 wt% CeO2 and 80 wt%
Cu - 20 wt% CeO2. The results showed uniform phase distribution, low
po-rosity and ceria disperse inside copper grain. In despite of properties, the composites had electrical conductivity of 38% IACS and 15% IACS and hard-ness of 69 and 88 HV5, respectively. The results of 92 wt% Cu - 8 wt% CeO2
composites were promising, and they are in according with actual literature.
Keywords
Copper-Based Composites, Ceria, Microstructure, Electrical Conductivity, Hardness
1. Introduction
Copper is widely used in electrical and electronic applications due to its high electrical conductivity; even so, its low mechanical resistance is a barrier for some applications who requires high mechanical stress.
Metal matrix composites (MMCs) consist in adding ceramic particles in a soft metal with the aim to improve its mechanical resistance; however, this reinforc-ing phase also increases the scatterreinforc-ing of electrons on the material and, conse-quently, decreases its electrical conductivity. The main challenge of MMCs re-searches is to get values of electrical conductivity who allow commercial uses of the material [1] [2] [3]. Various inert particles such as SiC, SiO2, Al2O3, ZrO2 and
How to cite this paper: da Fonseca, D.P.M. and Monteiro, W.A. (2019) The Micro-structure and Properties of Copper with Ceria Nanoparticles Addition. Journal of Materials Science and Chemical Engineer-ing, 7, 40-48.
https://doi.org/10.4236/msce.2019.710004
Received: September 20, 2019 Accepted: October 19, 2019 Published: October 22, 2019
Copyright © 2019 by author(s) and Scientific Research Publishing Inc. This work is licensed under the Creative Commons Attribution International License (CC BY 4.0).
DOI: 10.4236/msce.2019.710004 41 Journal of Materials Science and Chemical Engineering
TiO2 have been used as reinforcement phase. Ceria is a rare earth oxide that has
outstanding properties like high coefficient of thermal expansion, low thermal conductivity, good corrosion resistance, high melting point and chemical and thermal stability [4] [5]. Its high coefficient of thermal expansion is a special as-set for MMCs processed by powder metallurgy, because of the mismatch be-tween the coefficient of thermal expansion of the metallic matrix and ceramic reinforcement usually causes thermal stresses during sintering stage.
Composite 88 wt% Cu - 12.2 wt% CeO2 prepared by electrodeposition
exhi-bited increased microhardness and wear resistance than the pure copper coating, reaching the maximum value of 280 HV0.05, this hardness improvement comes
from crystallite size refinement in the copper matrix structure, produced by ceria dispersion [4]. In according to this, another study observed that ceria may in-crease the hardness of the copper as long its particles has been finely dispersed in the matrix, the presence of agglomerates in the composite microstructure could decrease the hardness. The authors observed that it is more difficult to avoid the occurrence of this agglomerates as ceria contents increases [5] [6] [7] [8]. Com-posite W-Cu with 1 wt% and 2 wt% of ceria processed by powder metallurgy ex-hibit, respectively, electrical conductivity of 47% IACS and 40% IACS, they also show some porosity, aggregated particle and lower density than sample without ceria addition [7].
There are just a few studies concerning the microstructure and the properties of composites strengthened by CeO2. In this scenario, the aim of this work was
to process copper-based MMCs by powder metallurgy and study the micro-structure and some properties (electrical conductivity, hardness and fracture) of the composites 92 wt% Cu - 8 wt% CeO2 and 80 wt% Cu - 20 wt% CeO2.
2. Experimental
Copper (given by Metallic Materials Laboratory of the Nuclear and Energy Re-search Institute) and Ceria (Sigma-Aldrich, average size < 25 nm) powders were mixed in a cylindrical mill for 30 min and 46 rpm, followed by cold compaction into cylindrical pellets (diameter: 10 mm) using uniaxial hydraulic press with applied pressure of 1080 MPa for 10 s. The green samples were then sintered and solubilized in a tubular furnace (800˚C, 6 h, and vacuum atmosphere 10−5 torr)
at a heating rate of 10˚C/min. After these steps, it was obtained cylindrical sam-ples with diameter 10 mm, high 1.5 mm and mass 1 g. It was also processed a standard sample of 100 wt% Cu under the same conditions of composite samples.
The as received copper and ceria powders were characterized by particle size analyzer (only copper powder, CILAS 1064), Scanning Electron Microscope (SEM) with Electron Dispersive X-ray Spectroscope (EDS) (JSM-6010LA JEOL), Transmission Electron Microscope (TEM) (only ceria powder, JEM 2100F JEOL) and Xray Diffractometer (XRD) (Rigaku Multiflex, Cu Kα).
DOI: 10.4236/msce.2019.710004 42 Journal of Materials Science and Chemical Engineering
out using the GSAS/EXPGUI software and ICSD (Inorganic Crystal Structure
Database) files 64699 (copper) and 61595 (ceria), the crystallite size was
calcu-lated from the Lorentzian broadening coefficient (LX):
18,000 LX
K
p= π λ
where p is the crystallite size in nm, K=1 is the Scherrer constant and λ the radiation wavelength (in this case 0.154 nm). Beside the crystallite size, it was acquired from the Rietveld refinement values of phase quantification and cell parameter.
Strengthening of the composites was estimated by hardness measurement us-ing a Vickers hardness tester (Buehler 5100) applyus-ing a load of 5 kgf for a dwell time of 15 s, it was made 9 indentation for sample and it was used adequate number of samples of each composition. Electrical conductivity was measured with an eddy-current instrument (Foerster Sigmatest 2068) using a probe of 14 mm diameter and 60 kHz frequency, it was made 5 measurement for sample and it was used adequate number of samples of each composition. Density was cal-culated using experimental values of high, diameter and mass of samples; theo-retical density was calculated from the rule of mixtures taking fully dense values for copper and ceria 8.95 and 7.65 g∙cm−3, respectively.
3. Results
3.1. Powder Characterization
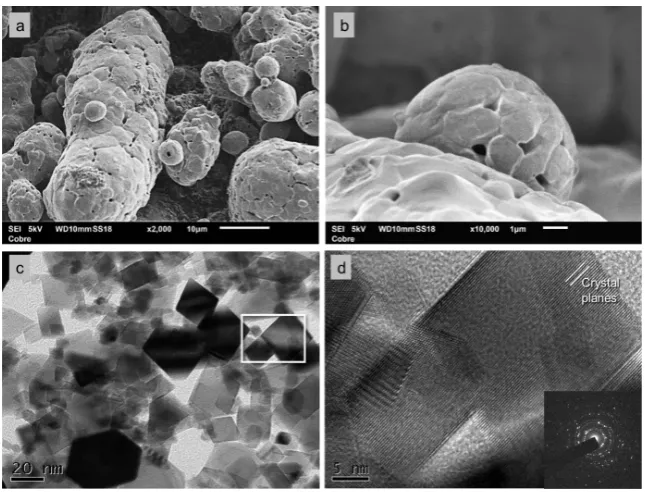
The SEM and TEM images of the powders are shown in Figure 1. The powders
[image:3.595.212.535.438.684.2]DOI: 10.4236/msce.2019.710004 43 Journal of Materials Science and Chemical Engineering
analysis indicated that copper particles has shape of irregular spheres and mean particle diameter of 39.86 µm. Ceria has faceted monocrystalline particles with different geometries and it is possible to infer by TEM images that they are smaller than 25 nm, in according with powder producer report. The EDS microanalysis identify just the expected elements of each powder (100 wt% Cu and 86.39 wt% Ce - 13.61 wt% O). The XRD analysis showed thin peaks and the expected phas-es (Cu and CeO2), with crystallite size of 93.1 nm and 28.9 nm, respectively.
3.2. Microstructure of Composites
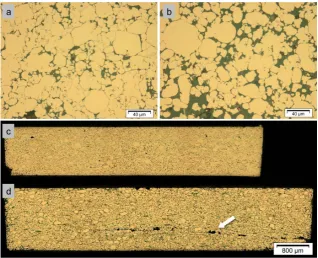
SEM (Figure 2) and OM (Figure 3) images shows for both compositions a mi-crostructure with good densification and with fine grains, the ceria phase was finely dispersed in the grain. In the composite with higher concentration of ceria (Figure 3(b)), it is possible to observe copper particles completely isolated by the ceria. Due to some particles agglomerated in the powder, it was observed larger phases of ceria from these agglomerates.
The composites presented homogeneity in the distribution of the phases and of the microstructure along the height and diameter with microstructure like the normal direction. The absence of segregation could indicate that the mixing process was efficient, mixing using cylindrical mill ensured uniform distribution of the particles in works of Venkateswaran etal. [9] and ASM International [10]. Among the samples, there was a maximum variation in height of 0.2 mm.
The composite with 20 wt% CeO2 had internal cracks (indicated by the arrows
in Figure 3(d)) in the horizontal direction (perpendicular to the compaction di-rection), this type of crack can occur during the beginning of compaction and during the removal of the compacted from the matrix.
[image:4.595.214.538.564.695.2]As the pressure is released from the upper punch to the sample, the sample expands elastically and uniaxially because it tends to return to its original situa-tion, due to sample stiffness or the friction of the matrix wall, this expansion does not occur at the edges, generating the cracks. In the withdrawal, the upper part is released from the compression forces of the matrix wall and undergoes lateral expansion while the lower part is still inside the matrix, in this transient stage shear stresses occur generating the cracks [11] [12] [13].
Figure 2. SEM images of (a) 92 wt% Cu - 8 wt% CeO2 and (b) 80 wt% Cu - 20 wt% CeO2.
DOI: 10.4236/msce.2019.710004 44 Journal of Materials Science and Chemical Engineering
Figure 3. OM images of 92 wt% Cu - 8 wt% CeO2 in (a) normal and (c) transversal
direc-tions; 80 wt% Cu - 20 wt% CeO2 in (b) normal and (d) transversal. Microstructure with good densification of copper particles and homogeneity in the distribution of the phases and of the microstructure along the height and diameter. The arrow indicates internal cracks.
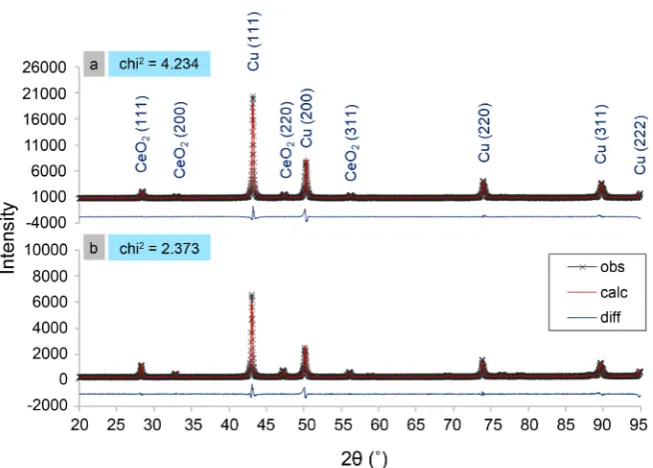
Figure 4 shows the XRD pattern of the composites obtained experimentally (“obs”) accompanied by Rietveld calculated curve (“calc”) and the difference among these curves (“diff”), it is also showed the identification of each peak (phase and planes). It was identified just the expected phases (Cu and CeO2).
The oxidation of copper (Cu2O) at high temperature is a very common
pheno-menon to occur and has been reported by several authors, however, in the XRD patterns there is no indication of peak at the diffraction angles of this phase, which indicates that the control of the vacuum during sintering was efficient. There is a shift in the (200) peak of the copper to positions 2θ smaller for all the composites, that can be observed by the format of the curve “diff” in the position of the 2θ - 50˚ (Figure 4). The same occurs in the pure copper sample (processed under the same conditions), this type of displacement of the (200) peak occurs in CFC materials due to the increase in the probability of intrinsic stacking failure [14].
The crystalline structure of both, copper and ceria, is Face Centred Cubic where, in the case of ceria, the tetrahedral interstitial is filled by oxygen. Table 1 shows phase quantification, crystallite size and cell parameter for each phase of the composites. The crystallite size of the copper phase in the composites with 8 and 20 wt% CeO2 was 61.0 and 72.6 nm, respectively, whereas in the pure copper
DOI: 10.4236/msce.2019.710004 45 Journal of Materials Science and Chemical Engineering
Figure 4. XRD patterns of (a) 92 wt% Cu - 8 wt% CeO2 and (b) 80 wt% Cu - 20 wt%
[image:6.595.210.540.378.618.2]CeO2. It was identified just the expected phases (Cu and CeO2) and a shift in (200) copper peak, due increase in the probability of intrinsic stacking failure.
Table 1. Properties of Cu-CeO2 composites.
92 wt% Cu - 8 wt% CeO2 80 wt% Cu - 20 wt% CeO2
Density (g∙cm−3) 8.12 ± 0.05 7.66 ± 0.03
Specific gravity (%) 92 88
Electrical conductivity (%IACS) 38 ± 5 15 ± 3
Vickers Hardness (HV5) 69 ± 2 88 ± 4
Phase quantification (wt%) Cu 91.90 ± 0.05 82.75 ± 0.06
CeO2 8.1 ± 0.2 17.2 ± 0.2
Crystallite size (nm) Cu 61.0 72.6
CeO2 40.1 49.0
Cell parameter (nm) Cu 0.361825 ± 0.00009 0.36182 ± 0.0001
CeO2 0.54135 ± 0.0004 0.54149 ± 0.0003
EDS (wt%)
Cu 9.13 85.30
Ce 6.58 13.30
O 0.28 1.55
3.3. Properties of Composites
DOI: 10.4236/msce.2019.710004 46 Journal of Materials Science and Chemical Engineering
the composite with 8 wt% CeO2 is adequate and it is in according to the values
found in previous works with copper-based composites [5] [15] [16].
The addition of the ceramic phase increased the hardness of copper, because ceria is inherently harder. Varying the percentage of the ceramic reinforcement from 8 to 20 wt% the hardness increased from 69 to 88 HV5. This behavior
ex-poses good physical adhesion between the metal-ceramic phases [17] [18]. Part of the reason for the hardness not being so high may be due to sinter-ing/homogenization time [19]. For example, Rajkovic et al. [15] observed that the hardness decreases from 1050 to 410 MPa after subjecting Cu-4%Al2O3
[image:7.595.210.539.571.695.2]composite to high temperatures (800˚C for 5h).
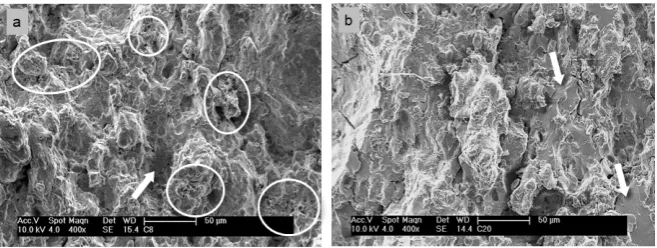
Figure 5 shows the observation of fractographs of the composites using SEM. It is observed a mixed fracture, fragile fracture regions (indicated by the arrows) suggest good adhesion in the matrix-reinforcement interface [20]. In the fracto-graphy of the composite 80 wt% Cu - 20 wt% CeO2 the presence of dimples is
not clearly observed (at least with this magnification) and the fracture is predo-minantly fragile.
4. Conclusions
The copper-based composites reinforced with ceria were processed by powder metallurgy and had their microstructures and properties studied, the conclu-sions are as follows:
• Copper and ceria powders had morphology, composition and particle sizes suitable for sample processing.
• The composites 92 wt% Cu - 8 wt% CeO2 and 80 wt% Cu - 20 wt% CeO2
were processed by conventional powder metallurgy (mixing, compaction and sintering) and presented oxidation-free surface and relative density of 88% and 92%, respectively.
• The microstructure shows good matrix densification, low porosity and good
adhesion between phases with finely dispersed ceria in the copper grain boundary. The EDS microanalyses did not indicate any element other than expected. The XRD patterns did not indicate the formation of other phases beyond that expected and indicated.
Figure 5. Fractographies of (a) 92 wt% Cu - 8 wt% CeO2 and (b) 80 wt% Cu - 20 wt%
DOI: 10.4236/msce.2019.710004 47 Journal of Materials Science and Chemical Engineering • The values of electrical conductivity obtained were 38% IACS and 15% IACS
but reached 51% and 21% in relation to the pure copper sample processed under the same conditions.
• The Vickers hardness values were 69 and 88 HV5, representing 230% and
293% of the hardness of the pure copper sample.
• The composites presented mixed fracture (ductile and brittle); the
fracto-graphs also indicated that the composite 92 wt% Cu - 8 wt% CeO2 is more
ductile.
• Studies have suggested that with 20 wt% CeO2 the electrical conductivity and
fracture behavior of the composite are compromised, however, with 8 wt% CeO2 promising results were obtained.
Acknowledgements
This work was supported by Brazilian graduate fellowship (CAPES).
Conflicts of Interest
The authors declare no conflicts of interest regarding the publication of this pa-per.
References
[1] Lu, L., Shen, Y., Chen, X., Qian, L. and Lu, K. (2003) Ultrahigh Strength and High Electrical Conductivity in Copper.
[2] ASM International (2001) Specialty Handbook: Copper and Copper Alloys. [3] Raabe, D., Miyake, K. and Takahara, H. (2000) Processing, Microstructure, and
Properties of Ternary High-Strength Cu-Cr-Ag in Situ Composites. Materials Science and Engineering A, 291, 186-197. https://doi.org/10.1016/S0921-5093(00)00981-3 [4] Ramalingam, S., Muralidharan, V.S. and Subramania, A. (2013) Electrodeposition
and Characterisation of Cu-CeO2 Nanocomposite Coatings. Surface Engineering, 29, 511-515. https://doi.org/10.1179/1743294413Y.0000000153
[5] Mangam, V., Bhattacharya, S., Das, K. and Das, S. (2010) Friction and Wear Beha-vior of Cu-CeO2 Nanocomposite Coatings Synthesized by Pulsed Electrodeposition. Surface & Coatings Technology, 205, 801-805.
https://doi.org/10.1016/j.surfcoat.2010.07.119
[6] Mangam, V., Das, K. and Das, S. (2010) Structure and Properties of Electrodepo-sited Cu-CeO2 Nanocomposite Thin Films. Materials Chemistry and Physics, 120, 631-635. https://doi.org/10.1016/j.matchemphys.2009.12.017
[7] Lu, Z., Luo, L., Chen, J., Huang, X., Cheng, J. and Wu, Y. (2015) Fabrication of W-Cu/CeO2 Composites with Excellent Electric Conductivity and High Strength Prepared from Copper-Coated Tungsten and Ceria Powders. Materials Science & Engineering A, 626, 61-66. https://doi.org/10.1016/j.msea.2014.12.047
[8] Sharma, A., Bhattacharya, S., Das, S. and Das, K. (2013) Fabrication of Sn-Ag/CeO2 Electro-Composite Solder by Pulse Electrodeposition. Metallurgical and Materials Transactions A, 44, 5587-5601. https://doi.org/10.1007/s11661-013-1894-5
DOI: 10.4236/msce.2019.710004 48 Journal of Materials Science and Chemical Engineering
https://doi.org/10.1177/0021998306069888
[10] ASM International (1998) ASM Metals Handbook—Volume 7 Powder Metal Tech- nologies and Applications.
[11] HÖGANÄS (2013) Höganäs Handbook for Sintered Components—Production of Sintered Components.
[12] Richerson, D.W. (2005) Modern Ceramic Engineering: Properties, Processing and Use in Design. 3rd Edition, Taylor and Francis, Philadelphia.
https://doi.org/10.1201/b18952
[13] Balakrishna, P., Chakraborthy, K.P. and Singh, A. (1996) End-Capping and Other Defects in Pressed Ceramic Compacts. Indian Journal of Engineering & Materials Sciences, 3, 196-200.
[14] Mittemeijer, E.J. and Scardi, P. (2004) Diffraction Analysis of the Microstructure of Materials. Springer, Berlin. https://doi.org/10.1007/978-3-662-06723-9
[15] Rajkovic, V., Bozic, D. and Jovanovic, M.T. (2010) Effects of Copper and Al2O3 Par-ticles on Characteristics of Cu-Al2O3 Composites. Materials and Design, 31, 1962- 1970. https://doi.org/10.1016/j.matdes.2009.10.037
[16] Bera, S., Chowdhury, S.G., Lojkowsky, W. and Manna, I. (2012) Synthesis of CuCr and CuCrAg Alloys with Extended Solid Solubility with Nano-Al2O3 Dispersion by Mechanical Alloying and Consolidation by High Pressure Sintering. Materials Science & Engineering A, 558, 298-308. https://doi.org/10.1016/j.msea.2012.08.004
[17] Daoushb, W.M., Lima, B.K., Moa, C.B., Nama, D.H. and Honga, S.H. (2009) Elec-trical and Mechanical Properties of Carbon Nanotube Reinforced Copper Nano-composites Fabricated by Electroless Deposition Process. Materials Science and En-gineering A, 513-514, 247-253. https://doi.org/10.1016/j.msea.2009.01.073
[18] Panda, S., Dash, K. and Ray, B.C. (2014) Processing and Properties of Cu Based Mi-cro- and Nano-Composites. Bulletin of Materials Science, 37, 227-238.
https://doi.org/10.1007/s12034-014-0643-8
[19] Rajkovic, V., Bozic, D. and Jovanovic, M.T. (2008) Properties of Copper Matrix Reinforced with Nano- and Micro-Sized Al2O3 Particles. Journal of Alloys and Com-pounds, 459, 177-184. https://doi.org/10.1016/j.jallcom.2007.04.307