1
GAPS IN THE HOUSING SAFETY NET
Donald Houston
1, Darja Reuschke, Albert Sabater, Keith Maynard and
Norman Stewart
July 2014
2 CONTENTS
EXECUTIVE SUMMARY 3
1. INTRODUCTION 7
2. WHAT IS THE HOUSING SAFETY NET? 8
3. WHAT ARE THE RISKS? 10
4. WHERE ARE THE GAPS? 18
5. WHO IS RECEIVING SUPPORT FROM THE HOUSING SAFETY NET? 23
6. WHO IS FALLING THROUGH THE HOUSING SAFETY NET? 31
7. CONCLUSIONS 50
ANNEX 1 – METHODS AND DATA 55
ANNEX 2 – ANALYSIS BY INCOME THRESHOLDS 60
3 EXECUTIVE SUMMARY
Low pay, high house prices and a small rental sector combine to produce a housing market in the UK that has many inherent risks. Mindful of these trends, Shelter commissioned the University of St Andrews to assess gaps in the housing safety net. This comprised four main objectives. First, to identify the main risk factors leading people to fall through the net. Second, to identify gaps in the housing safety net. Third, to estimate the number falling through or at risk of falling through. Fourth, to profile the characteristics of those at risk.
The results reported in this report are drawn from:
1. Systematic literature review of ‘academic’, ‘industry’, ‘policy’ and ‘grey’ literatures. 2. Analysis of housing support, housing affordability and economic hardship using the Family
Resources Survey.
Definition of the housing safety net
In this report, the housing safety net is defined as: social housing; housing benefits (Housing Benefit (HB), Local Housing Allowance (LHA), Support for Mortgage Interest (SMI) and
Discretionary Housing Payments (DHPs)); private insurance; and homelessness prevention and alleviation policies.
The statistical analysis of numbers of households falling into and through the housing safety net is limited to the data collected by the Family Resources Survey. The statistical analysis therefore uses the following definition of the housing safety net: social renters; private tenants in receipt of LHA; and homeowners in receipt of SMI.
The analysis defines households as ‘falling through the housing safety net’ if they simultaneously experience: high housing cost relative to income; low income; and ‘financial stress’1. Some households that fall through the housing safety net receive some support. In other words, the definition of falling through the net includes those who fall straight through and those who have their fall broken by the net. The figures are based on the most recent 2011-12 figures from the Family Resources Survey.
The research also identifies the events that lead to households needing support but falling through the housing safety net and the groups particularly poorly served by the housing safety net.
Headline findings
The UK housing system is a risky combination of low pay, high housing costs, small rental sectors and a limited housing safety net.
1
4 At the moment many households have to move if they experience a drop in income as the
support offered by the housing safety net is insufficient to meet their housing costs. Meeting housing costs in the short-run would help enable people search for a new job rather than find a new place to live.
Households who work are a growing proportion of housing safety net users. The UK needs to increase housing supply in all three main housing tenures in order to make housing more affordable and reduce the UK’s reliance on the safety net to meet housing needs.
Households receiving support from the housing safety net
In 2011-12, 6.4 million of the 26.4 million households in the UK received support from the housing safety net. This represents a quarter of all households.
The 6.4 million households receiving housing support comprises: 5.2 million in the social rented sector; 1.0 million renting from a private landlord and in receipt of LHA; and 200,000
homeowners with SMI.
Those receiving support from the housing safety net are more likely to be working now than ten years ago – a reflection of rising housing costs and entrenched low pay.
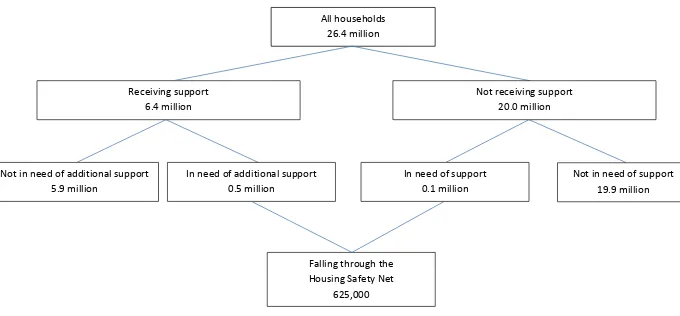
Households who are falling through the housing safety net (see figure 1)
625,000 households currently fall through the housing safety net
Of those falling through the net, 300,000 are social renters, 275,000 are private renters and 50,000 are owner occupiers. Of those falling through the net, 125,000 receive no support and 500,000 receive some support but still fall through. Of the 125,000 receiving no support, around 75,000 are private renters and 50,000 are owner occupiers. Of the 500,000 receiving some support but remaining in need, around 300,000 are social renters and 200,000 are private renters in receipt of LHA. Only a very small number (less than 10,000) are owner occupiers in receipt of SMI.
5 Figure 1: Households who are falling through the housing safety net
Not in need of additional support 5.9 million
In need of additional support 0.5 million
Not in need of support 19.9 million
Falling through the Housing Safety Net
625,000 All households
26.4 million
Receiving support 6.4 million
Not receiving support 20.0 million
6 Households who are at risk of falling through the housing safety net
3.4 million households are at risk of falling through the housing safety net (based on having both low income and having high housing cost relative to their income).
High housing costs relative to income and financial stress are higher among those with children and single-person households. This is largely unchanged from a decade ago.
Those experiencing high housing cost relative to income, low income and financial stress are more likely to be lone parents and younger compared to ten years ago. This reflects those who have been most exposed to benefit reforms.
Those experiencing high housing cost relative to income, low income and financial stress are more likely to be self-employed compared to ten years ago – reflecting a combination of a long-term trend towards self-employment and restricted opportunities for paid employment since the financial crisis.
The events that are most likely to lead to households falling through the housing safety net are:
Household becoming workless
Household experiencing a drop in income but at least one person remains employed Separation/family breakdown
Onset of sickness/disability Bereavement
Groups that are poorly served by the housing safety net are:
single people under 35 in the private rented sector;
working couples in owner occupation who experience a drop in income but at least one person remains employed;
Couples in the social rented sector without children that do not work are at risk to fall through the housing safety net due to cuts in HB because of ‘under-occupancy’ and income reductions under the new Universal Credit (UC) regime.
7 1. INTRODUCTION
Slow economic recovery, low pay and high house prices mean there is continued pressure on the
housing safety net. Meanwhile, welfare reform has progressively lowered and opened a number of gaps in the housing safety net. Homeownership and social renting are difficult to access due to deposits and waiting lists, respectively. Private renting provides an alternative for some, but availability, affordability, quality and security are common problems.
Benefits to help meet housing costs for those on low or no income have been progressively cut back by welfare reforms over the last 20 years, with social tenants, private renters and homeowners all affected. Levels of new house building for both owner occupation and renting have been low for decades and house prices have soared.
Low pay, high house prices and a small rental sector combine to produce a housing market with many inherent risks. It is also difficult to access. As well as more people at risk of falling into and through the housing ‘safety net’, increasing numbers cannot get on the housing ‘tightrope’ in the first place. The UK housing system as a whole isn’t working.
Mindful of these trends, Shelter commissioned the University of St Andrews to assess gaps in the housing safety net. This comprised four main objectives. First, to identify the main risk factors leading people to fall through the net. Second, to identify gaps in the housing safety net. Third, to estimate the number falling through or at risk of falling through. Fourth, to profile the characteristics of those at risk.
The results reported in this report are drawn from:
1. Systematic literature review of ‘academic’, ‘industry’, ‘policy’ and ‘grey’ literatures. 2. Analysis of housing support, housing affordability and economic hardship using the Family
Resources Survey.
The next section of the report (section two) provides a brief description of the ‘housing safety net’. The following section three provides an assessment of the risk factors causing people to fall through the net. Section four identifies the gaps in the housing safety net, in other words who and in what circumstances would not receive much if any support. Section five provides evidence on how many and who are being caught by the housing safety net. Section six provides evidence on how many and who are falling through the net. Section seven synthesises the results and draws conclusions and recommendations for further research and changes in policy direction.
8 2. WHAT IS THE HOUSING SAFETY NET?
The term ‘housing safety net’ is used in this report to capture the range of support available to help those experiencing lower income to access adequate housing and meet housing costs . The housing safety net in Britain broadly has four components: social housing, housing-related benefits, private insurance and homelessness prevention and alleviation. The key features of each are described below.
Social housing. Provided either directly by local municipal authorities or by registered not-for-profit ‘social’ landlords, social housing has a ‘bricks and mortar’ subsidy meaning rents are usually significantly below market levels. Eligibility for social housing is usually based on being homeless or inadequately housed or having particular housing needs, for example arising from disability. Waiting lists often run to years. The social rented sector has shrunk over the last three decades due to a combination of lower rates of investment and building than in the past and the sale of properties to sitting tenants, mainly through the Right to Buy scheme introduced in 1980.
Housing benefits. Housing benefits are personal subsidies for housing costs, which effectively reduce housing costs for a given individual or household. In contrast, ‘bricks and mortar’ subsidies, such as in social housing, reduce housing costs across the board. Those unable to meet their housing costs may qualify for housing-related state benefits to cover some or all of their housing costs. Eligibility is based mainly on having a low household income and savings below £16,000. Additional eligibility restrictions apply to homeowners, chiefly ceilings on how many hours can be worked by the household and what other state benefits can be received alongside. Discretionary Housing Payments (DHPs) can be made, funded by the UK government and administered by local authorities, to households unable to meet their housing costs due to exceptional circumstances.
There are limits on how much housing cost is eligible to be covered by housing benefits. For renters, housing benefits only cover the number of rooms deemed necessary for a given household. For homeowners, only usually part of mortgage interest payment is covered and no capital repayment.
There are significant differences between housing tenures in the eligibility of housing costs for state support. For social renters of working age, eligible rent is limited to the number of bedrooms required by the household – the so-called ‘bedroom tax’ for those with a ‘spare’ room. For private renters, eligible rent is limited to the number of bedrooms required and limited to the 30th percentile (bottom 30 per cent) of prevailing local market rents for that size of property (although in a small number of cases benefit caps may apply below this level). For singles without children under 35 years of age in the private rented sector, eligible rent is limited to shared accommodation. For homeowners, there is no restriction on property size, but support for mortgage interest is subject to a 13-week waiting period and is capped both in terms of the interest rate (currently capped at 3.63%) and the payment level (the basic cap is currently £1,940 per year but this depends on household situation).
9
Private insurance. Many homeowners take out private mortgage payment protection insurance (MPPI). MPPI insures monthly mortgage payments against a drop in income arising from redundancy or sickness, although exclusions vary between policies. Mortgage providers require mortgagors to hold life
assurance, which protects widows, widowers and lenders after the death of an employed mortgagor.
Homelessness prevention and alleviation. Those becoming homeless are given priority in the allocation of social housing, particularly those with children, but often may still need to wait some time before being allocated a property. There are differences around the United Kingdom. For example, in Scotland young single homeless people are given preference on waiting lists which is no longer the case in England. Local authorities have a statutory responsibility to provide emergency or temporary accommodation to certain homeless groups, the cost of which will usually be covered by Housing Benefit if the homeless person or household does not have earnings above a certain threshold. This accommodation can be in hostels, ‘Bed & Breakfasts’ or with a private landlord. These mechanisms for allocating and paying for accommodation are designed to prevent homelessness and rooflessness.
There is a raft of policies aimed at preventing homelessness among at-risk groups, for example those with special needs, problems with drugs or alcohol, victims of domestic violence, ex-offenders and those leaving care or other institutional settings. There is a range of public and third sector funding and provision of these services, with some degree of oversight by the local authority. Many social services, particularly accommodation-based services, are funded through the national Supporting People (SP) programme. This programme was established in 2003. SP funds were ring-fenced for local authorities for use in providing housing-related support. These requirements have been relaxed in recent years
10 3. WHAT ARE THE RISKS?
Compared to many other developed countries, the context of housing risk in the UK is one of a
predominance of homeownership, high house prices, low pay, low savings, high indebtedness, low take-up of income and mortgage protection insurance and strong restrictions on the housing costs eligible to be covered by state benefits.
The expansion of homeownership and the contraction of social and private renting in the latter half of the 20th century attracted increasing numbers of households on low and moderate incomes into owner occupation, with attendant risks. Access to homeownership has become more limited once again in the 21st century due to rapid house price inflation and increasingly prudential lending by mortgage providers since the financial crisis. This is bolstered by new regulations governing mortgage lending which came into effect on 26 April 2014 (Financial Conduct Authority (FCA), 2014).
Restrictions on access to homeownership and social renting have led increasing numbers of low and moderate income households to rent from a private landlord. ). It has the least security of tenure, with landlords under no obligation to renew tenancies.
Housing vulnerabilities are changing. High housing costs are playing an increasingly important role in producing inadequate and insecure housing situations. For most households housing costs form the largest part of their living expenses. For example, in 2011/12 private renters in the bottom fifth of the UK income distribution spend on average 56 per cent of their income on housing (MacInnes et al., 2013). In 2013, ca. 20 per cent of households in Great Britain relied on Housing Benefit to cover some or all of their housing costs (ibid. 116). There are marked geographic differences in the level and cycle of house price changes between the southeast of England plus other prosperous towns and cities and much of the rest of the UK. This means that there are marked geographic differences in risks. For example, in the North East more than 25 per cent of households claimed Housing Benefit (HB) in 2013. Many local authority areas in Greater London have at least one third of households claiming HB (ibid.).
On the income side of the equation, rising labour market insecurity and changes in welfare system together increase financial risks for households and decrease their options to cope with shocks. Real earnings in the private sector have declined by 8.5 per cent between 2009 and 2012 (ONS, 2013a). Low pay and insecure or variable incomes rather than worklessness have become increasing features of poverty in the UK over the last 10-20 years. A sharp rise in self-employment since 2010 is producing increasing numbers of people with low, insecure or variable incomes (ONS, 2013b); and unable to secure a mortgage because of tightening demands from lenders for certification/documentary evidence of income (Reuschke and Maclennan, 2014).
11 uprating of benefits by 1 per cent, replacing Disability Living Allowance by the Personal Independence Payment and the start of the roll-out of Universal Credit (UC). These come after reductions in eligibility and payment levels on the grounds of sickness and disability in 2008 with the replacement of Incapacity Benefit with the Employment and Support Allowance, and progressive restrictions on amounts of Housing Benefit (later the Local Housing Allowance) payable to private tenants.
Risk factors concerning the housing safety net not only stem from changes in employment and housing costs but also from changes in household composition. Family and partnership breakdown bear a high risk of debt and (periods of) homelessness (Fitzpatrick, 2012; Anderson and Christian, 2003; Crane and Warnes, 2000).
The consequences of mortgage default are growing in the current economic and political environment. Arrears and possessions are often a pathway into poverty (Ford and Wallace, 2012). However, rent arrears and mortgage possessions are relatively minor homelessness triggers (Fitzpatrick, 2012a). Causes of statutory homelessness among families (most of them lone women parent households) relate most often to the inability to secure alternative housing, particularly in tight housing markets, when they are confronted with a crisis such as relationship breakdown or eviction which causes them to lose their accommodation (Fitzpatrick, 2012b).
Main sources for both debt arrears (all loans/overdrafts) and homelessness described in the literature are: poverty, low incomes and long-term economic inactivity of households (e.g. Bridges and Disney (2004) for arrears on debt). Thus it is often not unemployment or redundancy but more often reduced earnings (e.g. lower waged job, loss of overtime pay) that causes financial shortfalls and thus mortgage/rent arrears (Beatty et al., 2012; Ford and Wilcox, 1998). Similarly, it is rather evictions than the loss of employment that is the key direct cause of homelessness (Fitzpatrick, 2012a). In the current environment, under-employment and low incomes have become greater problems of housing insecurities.
Housing-related risk factors are multiple and are embedded in personal circumstances and structural processes. Thus it is often not one isolated ‘event’ that causes arrears or homelessness but interactions between multiple factors (see Fitzpatrick et al. (2013) for homelessness and Willen (2012) and Ford and Wallace (2012) for mortgage possessions). Credit impairment, Loan-to-value (LTV) ≥ 80%, self-employment and buy-to-let on their own are not suitable to predict mortgage performance but in combination were able to explain up to 27% of mortgage possessions in the UK in 2012 (FSA, 2012, 42).
12 Shrinking social rented sector and growth in at risk groups in the PRS
The social rented housing stock fell by 400,000 between 2001 and 2011 (MacInnes et al., 2013, p. 100). Since the sharp reduction in new construction in both market and social sectors the Private Rental Sector (PRS) has become more and more significant for low-income and vulnerable groups, members of which would often have been in social housing prior to the 1990s. Since 2011, the private rented sector has been larger than the social rented sector (Sissons and Houston, 2014) and low income households are disproportionally likely to rent privately (Kemp, 2011). At the same time, the PRS accommodates households for whom homeownership has become unattainable.
The changing demography of our society (separation/ divorce, migration, and aging) has further increased the demand for private renting. The PRS can no longer be seen mainly as a temporary home for young mobile households or households who are ‘on hold’ to gain access to social housing or homeownership. High mobile households with high incomes coexist with low-income, relatively immobile households in this varied sector. The sector, features some of the worst housing conditions (Houston et al., 2002; Kemp, 2011). Changes are also taking place on the supply side. There has been a growing number of buy-to-let small landlords attracted by rising house prices and strong demand for rental properties before the financial crisis (Leyshon and French 2009).Since the housing market crisis many ‘accidental landlords’ unable to sell properties have entered the sector (Crook et al 2012).
A group whose increase in the PRS has attracted much attention in research and practice are families (Shelter, 2012). Concerns are that the PRS is least suitable for families, amongst others, because of insecurity of tenure. In fact, most tenancies in the PRS are Assured Shorthold Tenancies (Short Assured Tenancies in Scotland) that provide an initial assured period of six months. Arguably, this regime bears high risks for those who seek longer-term accommodation and low-income households. Short-term tenancy can directly result in (temporary) homelessness and can indirectly worsen households’ financial situation due to moving costs and possible fees for finding a new place to live. Low income households and lone parent households in particular also rely more often on localised networks and community support. Losing this support may result in financial distress and decrease children’s longer-term life chances. The introduction of fixed-term (usually five-year) tenancies by some social landlords in England is therefore particularly risky for those who seek or depend on housing security, i.e. families in particular (Robinson and Walshaw, 2014).
Overcrowding is rising once again in the private rented sector, especially in big cities and London in particular – although is actually falling among homeowners (DCLG, 2008; ONS, 2014). In London one in ten households lives in overcrowded housing (ONS, 2014, 8). Rural areas are little affected by overcrowding (ibid. 11). Groups particularly at risk of living in overcrowded conditions are couples with dependent children (ibid. 14) and ethnic minorities (DCLG, 2008).
Rent arrears and eviction
13 low incomes reported that they find it difficult to afford their rent more often than social renters on low incomes (Kemp, 2011, 1029).
Rent arrears have been rising in recent years, (Beatty et al, 2012). Direct Payment of housing benefits to claimants in the private sector via the LHA and more recently to claimants in the social rented sector in pilot areas via Universal Credit has also contributed to increasing rent arrears (ibid.).
Beatty et al. (2012) conducted a large-scale study commissioned by the DWP on the extent to which the LHA meets rent costs since 2010 changes to the LHA.2 Just over two-thirds of claimants in their sample had to pay rent in excess of their LHA.3 More than two-fifths of claimants – and significantly more in London than elsewhere – reported that it is difficult to afford the rent they are currently charged. Claimants who had a shortfall between their actual rent and their LHA were more likely to be in arrears than those who did not have a shortfall (13 versus 7 per cent, respectively). By far the most common landlord response was to suggest paying back the money gradually over time (48 per cent). Another 18 per cent of claimants were threatened with eviction (including refusal of renewal of tenancy).
The risk of eviction due to rent arrears is higher in the PRS than in the social housing sector (Slatter, 2012). Social housing tenants in a study by Robinson and Walshaw (2014) particularly valued the security of tenure and reported that private landlords were more likely to evict tenants in the case of arrears and late payments
Mortgage arrears and repossession
Mortgage arrears and repossessions in this crisis did not reach 1990s levels and have subsequently fallen. However, concerns remain about homeowners’ exposure to risk. Homeowners in lower income groups are at greater risk after a housing boom, i.e. in a period of slump (Meen, 2008). They are at greater risk of high-level mortgage indebtedness and rising mortgage rates (resulting from possible rising interest rates). Mortgage arrears have substantially increased between 2008 and 2012 and are well above the level in economically stable periods (FSA, 2012, 37). This has not translated into increased possessions chiefly because of the forbearance behaviour of lenders helped by low mortgage interest rates (see below). The Council of Mortgage Lenders (CML) reported that at the peak of the current arrears cycle, at the end of the first half of 2009, 216,400 households were in mortgage arrears.4 This was equivalent to 1.88 per cent of all mortgages. As at the end of 2013, this percentage share came down to 1.29 per cent (CML, 2014a).
There are differences in the experience of different arrears bands. The decline is concentrated in the lowest arrears category. In the highest arrears category, the proportion of mortgages in arrears has remained static between 2009 and 2012 and has only recently slightly declined from 28,900 at the end of 2012 to 28,700 mortgages at the end of 2013 (0.26 per cent of all mortgages) (CML, 2010, 2014a). At
2
1,910 face-to-face interviews with claimants across the 19 case study areas.
3 This includes renters with incomes above the applicable income and those who live with non-dependent persons,
so should not be interpreted as referring only to a ‘shortfall’.
4
14 the peak in 2009, 0.24 per cent of all mortgages fell into the highest arrears category (10 per cent or more) (CML, 2010). Only cross-sectional data are available so that no flows into and out of mortgage arrears can be investigated. One may expect that some households in the higher arrears categories will have decreased their debt and returned to lower arrear categories, other households will have gone through repossession, and for some households mortgage arrears will have worsened. Correspondingly, a large percentage share of mortgage holders find it difficult to make mortgage payments at least from time to time. Figures vary between 42% - 69% in surveys conducted in 2010 and 2011 (FSA, 2012, 18).
Interest rates have remained low and are therefore not (yet) a risk factor for mortgage debt and arrears. Statements from the Bank of England and mortgage lenders throughout 2013 suggest that interest and mortgage rates are likely to remain low for some time (BoE, 2013). However, according to recent statements, a rise in the base lending rate at the end of 2014 is anticipated. Only a small proportion of borrowers who took out a mortgage since 2005 have higher interest rates now than when they took out their mortgage (fewer than five per cent, FSA, 2012). Due to the uncertainty about the future development of interest rates, fixed mortgages have seen an increase in interest rates since the end of 2011 (FSA, 2012). Standard variable mortgages have had relative stable interest rates. However, variable mortgages are directly affected by interest rates shocks (Miles, 2003). If there were future increases in interest rates, the vast majority of mortgagor household in the UK would face the risk of a substantial increase in housing costs.
Households in low income and low house price regions in the UK are more likely to have variable rate mortgages. Households in regions with higher incomes and above-average house prices are more likely to opt for fixed mortgage payments (Koblyakova et al., 2013). The short-run negative effects of an increase of mortgage rates will therefore be greater in North England, Scotland and Wales than in the rest of the UK as here the share of variable rate mortgages is disproportionally high. However, in the longer run, higher house-price regions where housing represents a higher proportion of income would be more vulnerable to rising interest rates as rate rises eventually fed through to fixed-rate mortgages.
The availability and take-up of medium- to long-term fixed-rate mortgages is lower in the UK than many other countries including the US, Germany, Switzerland, Denmark, Canada and France (Lea, 2010). Reasons for these national differences found in the literature include ‘cultural’ differences (Lea, 2010), greater mobility of homeowners in the UK (due to there being many relatively young homeowners in the UK), high house prices meaning people trade risk of an increase in mortgage rate against being able to borrow more, and the risk of monthly payment rises associated with a variable rate being offset by strong growth in the value of the property once purchased (Wilcox and Williams, 2013). The availability and institutional framework may be other relevant reasons. A greater role of longer fixed-term rate mortgages would increase certainty for borrowers against changes in the macro-economy, but the higher cost of fixed-rate mortgages coupled with high housing prices in much of the UK perhaps limits the extent to which fixed-rate mortgages would be taken up.
15 The government (re-)enforced forbearance mainly through the Mortgage Pre-Action Protocol which came into force in November 2008.5 Lenders were forced to wait at least three months before initiating repossession proceedings. Moreover, low interest rates have helped mortgage lenders to be lenient in cases of arrears and allowing many households unable to make full mortgage repayments to move onto more manageable payment plans.
The number of mortgage possession claims published by the Ministry of Justice (2014) peaked in 2008 (142,741) and fell since then by almost two-thirds (53,659 in 2013). The drop in repossession was down from 48,900 in 2009 to 28,900 at the end of 2013 among CML members (CML, 2014a). Repossessions are highest in London due to housing cost and in the Northwest due to low income and job loss.
This fall in repossessions in absolute terms notwithstanding, the repossession rate as a percentage of mortgage loans in serious arrears (six months and more) was much higher in 2008 than at the beginning of the 1990s (FCA, 2013, 34). Thus lenders’ forbearance seems to have helped those in ‘moderate’ arrears but not those with severe payment impairments. Ford et al. (2010) interviewed households who had lost their property through voluntary or compulsory possession and found that if forbearance was offered by the lender it was perceived as beyond their financial means, too short term, or too limited to be a realistic option.
The FSA estimated that in 2012 forbearance applied to 5-8 per cent of mortgages (FSA, 2012, 39). However, forbearance and interest-only mortgage payments in particular are time-limited. This may just delay the problem into the future for those who rely on credit and/or those on low income. It can even worsen households’ financial situation in the medium and longer run, for example when the term has been extended beyond the retirement age (FSA, 2011). In the long run, improvements in economic conditions will be required to protect low-income homeowners from repossession.
The recommendations in the FCA’s Mortgage Market Review (published on 26th April 2014) has introduced tighter regulations to lending. Lenders are still permitted to grant interest-only mortgages, but only if a realistic strategy for repaying the capital is in place. It can therefore be expected that the long-term decline in the number of interest-only mortgages will continue, and that interest-only mortgages are likely to become an increasingly niche option (CML, 2014b).
It is more often a reduction in income (usually resulting from reduced working hours) than redundancy and unemployment that causes difficulties with mortgage payments (FSA, 2012, 49). Reduction of income/working hours, a relationship break-down or divorce and ill-health can cause mortgage payment problems amongst those with little savings. The private insurance market is designed as a buffer for financial risk. However, existing insurance schemes for loss of income as well as mortgage payment protection insurances only cover unemployment, illness and accidents and therefore do not cover the highest risks of financial distress: family breakdown and reduction of income (including, for example, loss of overtime pay). Some commentators are calling for compulsory insurance schemes for homeowners with a mortgage. However, this would not provide cover for the most frequent reasons for mortgage payment difficulties.
5
16 Amongst those with the highest risk of mortgage arrears and possessions are the self-employed. The self-employed were found to be overrepresented in the lower income deciles (Ford and Wilcox, 1998). Ford et al. (2010) also state that in their study of households who lost their homes through repossession a key reason for missed mortgage payments was failed self-employment.
Access to mortgages
Loan-to-Value ratios of 80 per cent and more are increasing again after a sharp increase of deposits required for mortgages from 2007 to 2009 (FSA, 2012, 25). However, due to the high cost of housing, even deposits of 10 per cent are unaffordable to many.
In 2011, the average Loan-to-Income ratio (LTI) was 5 compared to 3.7 ten years ago (FSA, 2012). This means that households have to borrow relatively more of their income than in the past to get on the housing ladder and are more exposed to a rise in interest rates or a drop in income.
The FCA’s Mortgage Market Review has also introduced tighter regulations designed to ensure that mortgage providers do not lend more than borrowers can afford to repay. In particular, the new regulations take account of outgoings as well as income, so will reduce the amount that households with children can borrow. The new regulations also require lenders to consider the impact of an increase in interest rate on a borrower’s ability to meet monthly repayments, which will decrease the amount many people can borrow.
Housing market and negative equity
Negative housing equity is less widespread in this economic crisis than in the 1990s crisis. This is due to great house price rises before the recession so that the majority of mortgagors continued to hold significant buffers of housing equity (Hellebrandt et al., 2009) and that in the early 1990s many borrowers had just bought their own homes when the housing bubble started to burst. However, the location of households in negative housing equity is less ‘favourable’ now than it was in the past. Negative housing equity is currently highest in Northern Ireland, the North East and North West of England. These are regions that are economically most distressed. In contrast, negative equity was highest in 1995 in the South East and South West (FCA, 2013).
Increased informal sharing and living with parents
The literature suggests a shift in vulnerabilities from older people/households to younger people. Whereas the homelessness literature still focuses more on older people recent homeownership and mortgage academic literature and reports stress the vulnerabilities of young people (Clapham et al., 2012).
17 difficulty of interest-only payments because younger homeowners are more likely to be nearer the beginning of their mortgage and so the interest component of monthly payments is large.
The economic crisis has increased the number of young adults aged 20 to 34 who live with their parents. In 2013, over 3.3 million young adults or 26 per cent of this age group lived in the parental home (ONS, 2013c). This corresponds to an increase of 20 per cent between 1997 and 2011 (ONS, 2013c). Accordingly, in the last ten years the household type in the UK with the fastest proportionate growth is multi-family households increasing from 206,000 to 286,000 households between 2003 and 2013 representing growth of 39%.
Young people have increasingly faced problems in entering the housing market. A study by Clapham et al. (2012) found that entering social housing tends to occur mostly after a lengthy spell on waiting lists and having formerly lived in a social rented parental family home. Living with parents until their 30s is a way into owner occupation for some young people as this allows them to save for a deposit on a mortgage. Accordingly, the average age of entering homeownership has increased (CML, 2011; Meen, 2011). This trend is accompanied by a rising share of first time buyers who receive financial support from parents or other relatives (CML, 2011).
18 4. WHERE ARE THE GAPS?
Changes in the welfare system have widened holes in the safety net. In general, fewer securities are provided to owner-occupiers with a mortgage than to renters. Over a number of years, welfare reform has limited the amount of benefits, including housing benefits that younger people without children are eligible for. It is younger people who have borne the brunt of the recession and face the greatest challenge entering owner occupation. Significant risks for the future may be created if younger people are not invested in rather than penalised.
SMI eligibility and changes to payment levels
SMI is the most significant safety net for homeowners. It is a means-tested social security benefit that covers (part of) mortgage interest payments on the mortgage and loans taken out for certain home repairs and improvements (not capital payments or loans taken out for other reasons). It is subject to a loan cap (affecting most claimants) and only available after a certain ‘waiting period’ on benefits. The eligibility for SMI is restricted to those who claim one of the following benefits: Income Support (IS), income-based Jobseeker’s Allowance (JSA), income-related Employment and Support Allowance (ESA) and Pension Credit. IS only covers those with no or low income, who are working less than 16 hours a week. Under Universal Credit, SMI is not paid if the claimant or their partner does any paid work (Kennedy, 2013). For low income households with one member in full-time work, Working Tax Credit6 provides limited direct financial support although it is not designed specifically for covering housing costs. Payments vary according to the household situation, the basic amount being up to £1,940 a year.
Low income households with members in full-time employment fall through the safety net provided through SMI.
“A majority of household respondents were not eligible for help from the state safety-net, Support for Mortgage Interest, (SMI) as many households who had lost income still had one person in employment, or were self-employed and had difficulty meeting the criteria for support. Where relationship breakdown was the key driver of arrears there was no eligibility for SMI as typically borrowers did not experience a loss of income (but increased costs).”
(Ford et al. 2010)
The SMI safety net is also patchy for those who are on income-based JSA for more than two years. Since 2009 SMI is only paid for a maximum of two years to JSA claimants (there is no time limit for IS and ESA claimants and those on Pension Credit). This leaves little scope for lenders other than repossession if a mortgagor remains unemployed after this period (Ford et al., 2011). This appears to be an issue that affects few claimants however. In 2011/12, only 13% of the 220,000 SMI claimants were in receipt of JSA, and only a small minority of JSA recipients remain on JSA for more than two years (Kennedy, 2013).
6
19 In October 2010, the DWP introduced a change to the standard interest rate (SIR) at which Support for Mortgage Interest (SMI) is paid. Formerly a SIR of 6.08 per cent was paid. This is now 3.63 per cent. The SIR is applied to all SMI customers (new and current, all ages, regardless of other claimed benefits) and regardless of the actual mortgage payment of clients. A report by Citizens Advice Bureau (CAB) in 2012 found that the current SMI system fails to meet the needs of a large proportion of their clients. There was a shortfall in around fifty per cent of cases (Pardoe, 2012). Building Societies saw an increase in mortgage arrears in SMI claimants from 25% of claimants to 46% in the 5 months since the lower rate was introduced in October 2010. Groups that have a mortgage interest rate higher than new fixed standard rate are, according to CAB, often people with long-term health problems or disabilities, families with dependent children and people aged 65 and over.
Additional short-term support introduced in the 2008 downturn was provided by the government to mitigate negative effects of the economic crisis on homeowners. These include the Mortgage Rescue Scheme (including help for shared equity, shared ownership and sale and rent-back of property), the Homeowner Mortgage Support Scheme (which aimed at providing extended forbearance by lenders to borrowers), the Preventing Repossessions Fund introduced in England in 2009 (offers mortgagor households small interest-free loans of less than £5,0007) and an improved access to SMI (where waiting times were decreased and the value of the mortgage covered by SMI increased). Apart from the improved access to SMI (changes are temporary, but are still in place), these instruments are now closed after low take-up and repossessions on a large scale not materialising (Wilcox and Williams, 2013).
The private insurance system and wider reasons for loss of income
The take-up of private insurance of mortgage payments against loss of income in Britain has been low (Stephens, 2012). Low take-up is the result of multiple factors including relatively widespread scepticism in the UK about how readily insurers would pay out (Ford et al., 2004). Indeed, a significant number of people would fall through the safety-net of MPPIs as these policies cover the loss of income caused only by certain types of illness and sickness and some instances of unemployment/redundancy. Available insurance policies do not cover reduced income arising from general restructuring (Ford and Wilcox, 1998). Only 39 per cent of MPPI policies cover all kinds of accidents and sickness as well as unemployment (Howard, 2010). Another factor explaining low take-up of private insurance in the UK is widely publicised miss-selling of Mortgage Payment Protection Insurance Policies (MPPIs) particularly in the 1990s (Scanlon and Whitehead, 2004, 34).
Problems of unsecure and variable income of the self-employed as well as self-employment or business failure are not adequately addresses by the current safety net. The self-employed can protect themselves against (some types of) illness or accidents through income protection insurances. However, there are significant holes in unemployment protection. Most are not eligible for JSA after termination of self-employment or if their business closes. Furthermore, the self-employed have often taken out loans on their homes for other reasons than house improvements (for example, to fund their business)
7
20 (Reuschke and Maclennan, 2014). If their household would qualify for SMI, these loans would not be covered by the scheme.
Those with a rise in expenditures (rather than loss of income) after a family or partnership breakdown and the self-employed are falling through the private insurance net. The inclusion of wider reasons for loss of income or disposable income other than illness or sickness (and unemployment for some) would reduce the number of possessions (Ford et al., 2010).
Changes to HB and LHA eligibility and payment levels and introduction of Universal Credit
Cuts to Local Housing Allowance (LHA) levels for private tenants and restrictions in eligibility for Housing Benefit (HB) for social tenants (chiefly due to the removal of the spare room subsidy) are contributing to rising rent arrears and problems with access to adequate housing more generally. This is particularly true of young single people for whom the LHA only provides the cost of shared accommodation and access to owner occupation is increasingly restricted. The age at which the Shared Accommodation Rate (SAR) applies in the LHA system rose from 25 to 35 on 1st April 2012. In the social rented sector, it is estimated that couples under 60 without children are most likely to be affected by the new HB size criteria or ‘bedroom tax’ (DWP, 2012b, p. 11).
HB will be subsumed within Universal Credit (UC) for people of working age (phased in from October 2013) and will thus become part of a single means-tested income subsidy. ‘Winners’ and ‘losers’ of UC have been identified by the DWP and independent research. Taken together, the reduced LHA for young singles/couples without children and payment changes in UC mean that UC couples without children are significant losers (DWP, 2012; Hirsch and Hartfree, 2013).8 This corresponds with the latest poverty and social exclusion report that shows that the poverty rate of working-age adults without children has worsened compared with five and ten years ago while the poverty rate of pensioners has decreased and not changed among working-age adults with children (MacInnes et al., 2013).9
Couples without children that do not work are at risk to fall through the housing safety net due to cuts in HB because of ‘under-occupancy’ and income reductions under the new UC regime.
In April 2011, the maximum eligible rent for private tenants was reduced from median (50th percentile) local market rent to the 30th percentile. The combination of the Shared Accommodation Rate and the restriction of payment to the 30th percentile mean that in many localities the problem of there simply
8
Note that the income losses between the current benefit system and UC decrease quickly for couples without children with rising hours in work.
9
21 not being accommodation available at any given time that can be covered by benefits (see Harvey and Houston, 2005) will have increased.
Before these reforms, in 2010, it was estimated that half of all private tenants in receipt of HB had to top up the amount they received in LHA to cover the cost of their rent (SSAC, 2010). According to a survey of private landlords conducted by Beatty et al. (2012) changes in LHA rate caps by property size10 and payment levels have had a significant impact on private tenants. A third of all interviewed LHA landlords reported that some of their tenants were in arrears because of the 2010 changes to LHA. This proportion was even higher in London (41 per cent) stressing the higher vulnerability of private renters in areas with high housing costs. A quarter of all LHA landlords stated that they had taken action to evict tenants or not renew or to terminate tenancies because of the changes to LHA. More than one-third of landlords letting to LHA claimants said they planned to cease letting to HB/LHA claimants or reduce lettings in certain areas (see also CCHPR, 2010).
Another vulnerable group are ethnic minorities. This group is particularly affected by overcrowding – a housing situation that may have long-term effects on children’s life chances. Furthermore, immigrants from the European Economic Area who are entitled to JSA are not entitled to claim HB since 1st April 2014 (SSAC, 2014).11
Some EEA migrants fall through the HB safety net. This group is already at risk to live in overcrowded housing conditions. This will further worsen their housing and living conditions.
Direct payment to tenants
The housing component of Universal Credit will be paid directly to tenants (this was introduced in 2008 for private renters).12 Housing Associations regard this aspect of the Welfare Reform package as the one likely to have the biggest impact on their business operations (Ipsos MORI, 2013). Housing Associations expect an increase in rent arrears of 51% on average. Evidence from research commissioned by the DWP in ‘Direct Payment Demonstration Projects’ suggests that direct payment will have a dramatic negative effect on a very large number of renters: some tenants who have never been in rent arrears before are now in arrears through direct payment. 31 per cent of research respondents saw themselves coping poorly on direct payments and 38 per cent said they would find it difficult to manage their finances (Hickman and Reeves, 2013). Similarly, in a pilot study conducted by L&Q Housing Association in 2004, the rate of arrears increased from 3% to 7% (Wilson, 2014).
10
The caps are as follows: £258.06 per week for 1 bedroom property, £299.34 for 2 bedrooms, £350.95 for 3 bedrooms and £412.89 for all properties with 4 and more bedrooms (Wilson, 2013, p. 6).
11 This does not affect UK nationals, EEA jobseekers with retained worker status and those who were entitled to
JSA as at 31st March 2014.
12
22 Rent arrears are also likely to be caused by the new size criteria in social housing (the so-called ‘bedroom tax’ or removal of the ‘spare room subsidy’). The DWP (2012b) cites research that reports that 35 per cent of social rented sector HB claimants thought they will fall into arrears if their HB is reduced because of ‘under-occupancy’.
23 5. WHO IS RECEIVING SUPPORT FROM THE HOUSING SAFETY NET?
Introduction
The aim of this section is to provide an overview of the numbers and characteristics of those who are receiving support from the housing safety net in comparison with those not receiving housing state support, and to identify the key trends in who is receiving support from the housing safety net over the last decade. We use information at three time points (2003-04, 2008-09 and 2011-12) from the Family Resources Survey (FRS) and the Household Below Average Income (HBAI) data sub-set to examine the main characteristics of recipients of Housing Benefits (HBs) and Support for Mortgage Interest (SMI) on dimensions such as tenure, family composition, economic status, income and their geographical distribution.
Following section two of this report, we have defined the housing safety net as: social renters; private tenants in receipt of LHA; and homeowners in receipt of SMI. Using the Family Resources Survey and the 2011 Census of Population, we calculated the number of households13 receiving support from the housing safety net.
How many households are receiving support from the housing safety net?
In 2011-12, 6.4 million of the 26.4 million households in the UK received support from the housing safety net (figure 1). This represents a quarter of all households. The 6.4 million households receiving housing support comprises: 5.2 million in the social rented sector; 1.0 million renting from a private landlord and in receipt of LHA; and 0.2 million homeowners with SMI.
Checks against other sources suggests that social renters and SMI claimants are accurately represented in the Family Resources Survey, but that private renters on LHA are under-represented. This is due to the high turnover of properties and tenants in the private rented sector making them more difficult to capture in household-based surveys such as the FRS. DWP figures record 220,000 SMI recipients in 2011 and 1.4 million LHA claimants.
13
24 Figure 1 Housing Safety Net by housing tenure
Source: 2011-12 Family Resources Survey breakdown, grossed to total households in 2011 Census of Population
All households 26.4 million
Receiving support 6.4 million
Not receiving support 20.0 million
Social renters
5.2 million
Private renters with LHA 1.0 million
Owners with SMI 0.2 million
Private renters
3.0 million
Owners
25 Profiles of those receiving support from the housing safety net
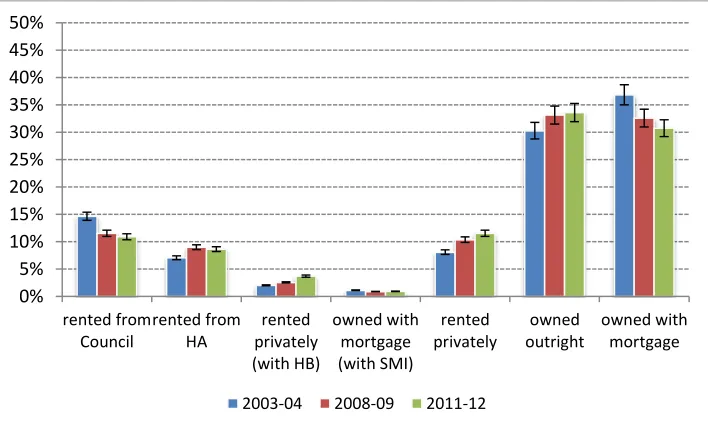
Tenure
A more detailed breakdown by claimants by tenure is: 11% rented from Council; 9% rented from a
Housing Association; 4% rented privately with HB; and 1% owned with SMI (Figure 2). This proportion
has remained stable since 2003-04, the result of a combined 4 percentage point decrease among those
who rented from the Council, and 2 percentage point increases among each of those who rented from
Housing Associations and privately with HB. Presumably this static level is the result of parallel trends
cancelling out. On the one hand, demands on the safety net are likely to have increased arising from the
financial crisis. On the other hand, reductions in the scope of the net have reduced the numbers
receiving support.
FIGURE 2: Percentage of households with and without housing state support (Housing Benefit and
Support for Mortgage Interest) across tenure types. United Kingdom, 2003-04, 2008-09 and 2011-12
0% 5% 10% 15% 20% 25% 30% 35% 40% 45% 50%
rented from Council
rented from HA
rented privately (with HB)
owned with mortgage (with SMI)
rented privately
owned outright
owned with mortgage
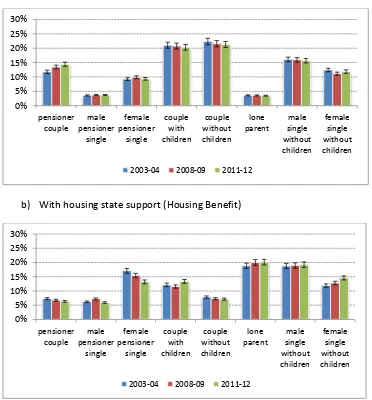
[image:25.612.74.428.324.539.2]26 Family Composition
The largest family compositions among those receiving housing state support are lone parents (20%) and single men without children (19%) (Figure 3). The share of these two groups has remained relatively stable since 2003-04. Among the recipients of HB, the only group that experienced significant growth is the single females without children (15%), with a 3 percentage point increase since 2003-04.
[image:26.612.69.441.309.709.2]The population of households claiming SMI suggests that it is less dominated by family groups since the recession period in 2008-09. Single female pensioners (18%) and lone parents (18%) remain the largest groups. There is a divergent trend over time between pension age groups and younger groups. This requires further interpretation – it perhaps shows that the changes in legislation (2010) with regard to SMI have had a larger effect on older people.
FIGURE 3: Percentage of households with and without housing state support (Housing Benefit and Support for Mortgage Interest) by family composition. United Kingdom, 2003-04, 2008-09 and 2011-12
a) Without housing state support
b) With housing state support (Housing Benefit)
0% 5% 10% 15% 20% 25% 30% pensioner couple male pensioner single female pensioner single couple with children couple without children lone parent male single without children female single without children
2003-04 2008-09 2011-12
0% 5% 10% 15% 20% 25% 30% pensioner couple male pensioner single female pensioner single couple with children couple without children lone parent male single without children female single without children
27 c) With housing state support (Support for Mortgage Interest)
Source: Family Resources Survey, own calculation.
0% 5% 10% 15% 20% 25% 30%
pensioner couple
male pensioner
single
female pensioner
single
couple with children
couple without children
lone parent
male single without children
female single without children
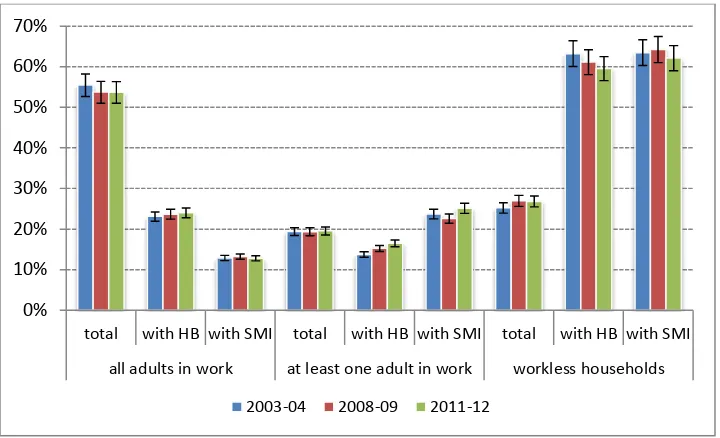
28 Working status
There is an overrepresentation of workless households among those that receive housing state support. Over half (60%) of households in receipt of HB and 62% of households in receipt of SMI (62%) have no one in work (Figure 4). HB and SMI are means tested so can be paid if a household member is in
[image:28.612.72.432.270.489.2]employment. Under Universal Credit, only households with no-one working will be eligible for SMI. The proportion of households with no-one working have decreased among those who receive HBs and SMI by 4 and 1 percentage points respectively since 2003-04. Correspondingly, an increase of these two groups is found within households with all adults in work or at least one adult in work. Consequently, it can be said that those receiving HB/LHA or SMI now have a more ‘working’ profile than 10 years ago.
FIGURE 4: Percentage of households with and without housing state support (Housing Benefit and Support for Mortgage Interest) by economic status. United Kingdom, 2003-04, 2008-09 and 2011-12
Source: Family Resources Survey, own calculation.
0% 10% 20% 30% 40% 50% 60% 70%
total with HB with SMI total with HB with SMI total with HB with SMI
all adults in work at least one adult in work workless households
29 Household income
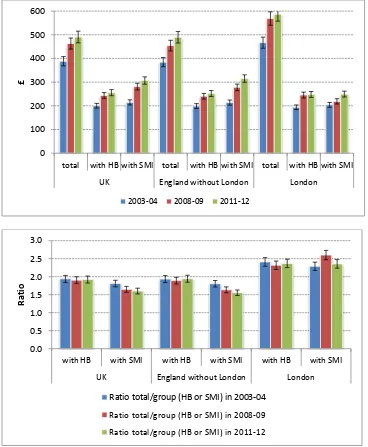
[image:29.612.70.438.241.688.2]There are clear income disparities between those receiving and not receiving housing state support (Figure 5). Mean weekly incomes have grown for all groups in the UK since 2003-04. In 2011/12, the net disposable income for the total population is on average 1.8 times higher than that of recipients of HB and SMI in 2011-12. Income disparities are greater in London, where the net disposable income for the total population is on average 2.4 times higher than for those recipients of HB and SMI in 2011-12.
FIGURE 5: Mean weekly income after housing costs (AHC) in households with and without housing state support (Housing Benefit and Support for Mortgage Interest) and as a ratio of those with: without housing state support. United Kingdom, 2003-04, 2008-09 and 2011-12
Source: Household Below Average Income, own calculation.
0 100 200 300 400 500 600
total with HB with SMI total with HB with SMI total with HB with SMI
UK England without London London
£
2003-04 2008-09 2011-12
0.0 0.5 1.0 1.5 2.0 2.5 3.0
with HB with SMI with HB with SMI with HB with SMI
UK England without London London
R
atio
Ratio total/group (HB or SMI) in 2003-04
Ratio total/group (HB or SMI) in 2008-09
30 Income disparity between households
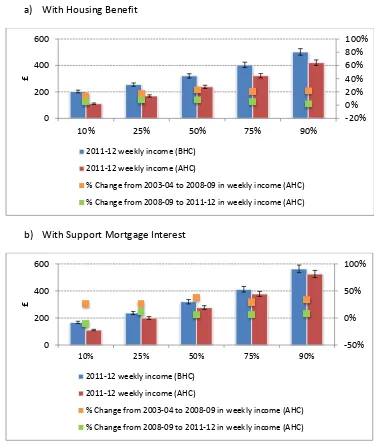
[image:30.612.66.440.254.702.2]Weekly incomes for recipients of HB between the bottom 10% and the top 10% differ by approximately £299 (BHC) and £311 (AHC) in 2011-12 (Figure 6). For recipients of SMI, the difference between the bottom 10% and the top 10% is even larger, and differs by approximately £396 (BHC) and £414 (AHC). In other words, there are significant income disparities within households receiving housing state support, and these differences clearly become more pronounced after taking into consideration housing costs. This is likely to be because regional variation in housing costs is greater than regional variation in the level of HB and SMI payable.
FIGURE 6: Mean weekly income in households with housing state support (Housing Benefit and Support for Mortgage Interest) by percentiles. United Kingdom, for years 2003-04, 2008-09 and 2011-12
a) With Housing Benefit
b) With Support Mortgage Interest
Source: Household Below Average Income, own calculation.
-20% 0% 20% 40% 60% 80% 100%
0 200 400 600
10% 25% 50% 75% 90%
£
2011-12 weekly income (BHC)
2011-12 weekly income (AHC)
% Change from 2003-04 to 2008-09 in weekly income (AHC)
% Change from 2008-09 to 2011-12 in weekly income (AHC)
-50% 0% 50% 100%
0 200 400 600
10% 25% 50% 75% 90%
£
2011-12 weekly income (BHC)
2011-12 weekly income (AHC)
% Change from 2003-04 to 2008-09 in weekly income (AHC)
31 6. WHO IS FALLING THROUGH THE HOUSING SAFETY NET?
Introduction
We define falling through the housing safety net as households simultaneously experiencing: high housing cost relative to income; low income; and ‘financial stress’. Together, these criteria reveal households who are not coping financially, are on a low income, and have high housing costs relative to their income – in other words, are arguably in need of support from the housing safety net. Specifically, we have identified households in the 2011-12 Family Resources Survey that meet all three of the following criteria:
1. Housing costs in excess of 30% of income14;
2. Income below 60% of the national median household income; and 3. Reporting ‘financial stress’.
In the Family Resources Survey, a household is considered to be in ‘financial stress’ if it is behind with payments for one or more of the following items: (1) electricity bill, (2) gas bill, (3) other fuel bills, (4) council tax or water charges, (5) insurance policies, (6) telephone bill, (7) television/video rental, (8) other hire purchase payments.
We include in our definition all households that meet all three of the above criteria, including those receiving some support from the net. In other words, our definition includes households who have their fall broken by the net and those who fall straight through.
There are, of course, other risk categories that we have identified based on our literature review reported in sections three and four. However, in this section of our report we are constrained to the data available in the Family Resources Survey on which we have based our analysis.
14 Total household income, including from benefits, before tax deductions, equivalised to enable comparison
32 How many households are falling through the housing safety net?
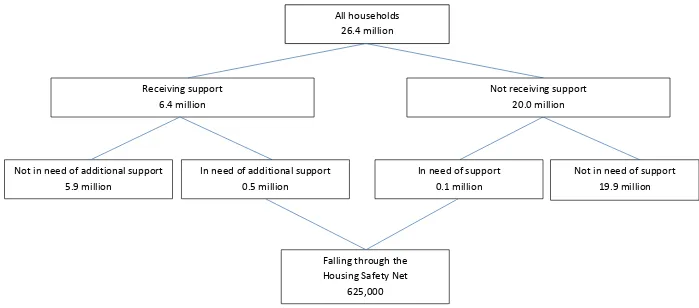
Approximately 625,000 households currently fall through the housing safety net on the basis of simultaneously being in all three of the above categories (figure 7a and Table 2). This represents 2.4 per cent of all households – almost one-in-40 (Table 3).
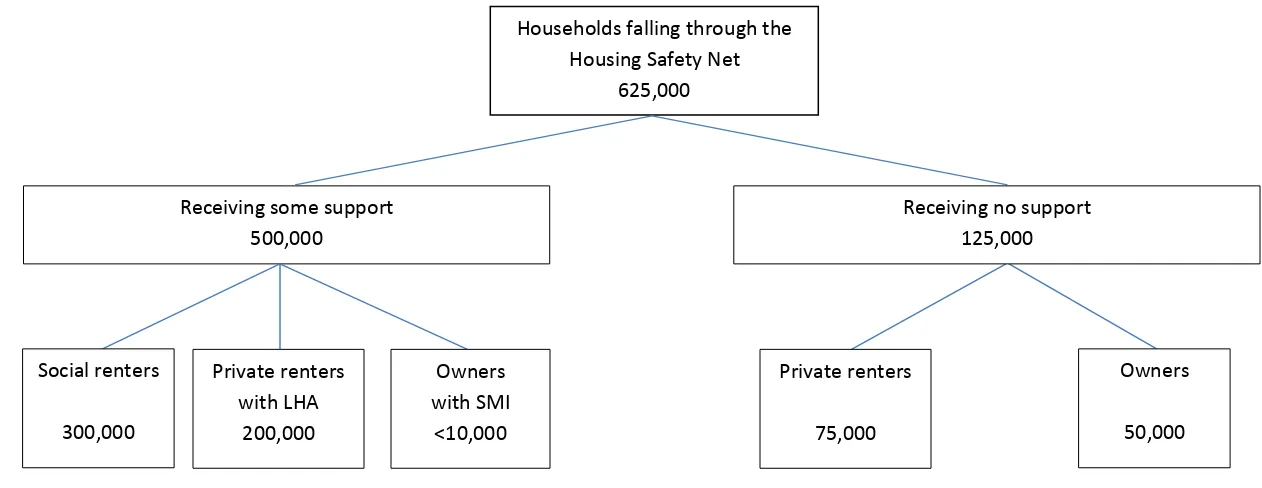
Of the 625,000 households falling through the housing safety net, just less than half (300,000) are social renters, somewhat less than half (275,000) are private renters and around one-in-12 (50,000) are owner occupiers (figure 7b and table 2). Of the 625,000 falling through the housing safety net, 125,000 receive no support from the net and 500,000 receive some support but still fall through.
Of the 125,000 receiving no support, around 60 per cent (75,000) are private renters and 40 per cent (50,000) are owner occupiers. Of the 500,000 receiving some support but remaining in need, around 60 per cent (300,000) are social renters and 40 per cent (200,000) are private renters in receipt of LHA. Only a very small proportion – around one per cent (less than 10,000) – are owner occupiers in receipt of SMI.
33 Figure 7a Households falling through the Housing Safety Net (based on housing costs >30% of income AND income <60% median AND reporting financial stress)
Source: 2011-12 Family Resources Survey breakdown, grossed to total households in 2011 Census of Population
All households 26.4 million
Receiving support 6.4 million
Not in need of additional support 5.9 million
Not receiving support 20.0 million
In need of additional support 0.5 million
In need of support 0.1 million
Not in need of support 19.9 million
Falling through the Housing Safety Net
34 Figure 7b Households falling through the Housing Safety Net (based on housing costs >30% of income AND income <60% median AND reporting financial stress) by housing tenure and support category
Source: 2011-12 Family Resources Survey breakdown, grossed to total households in 2011 Census of Population
Households falling through the Housing Safety Net
625,000
Receiving some support 500,000
Receiving no support 125,000
Social renters
300,000
Private renters with LHA
200,000
Owners with SMI
<10,000
Private renters
75,000
Owners
[image:34.792.121.752.186.430.2]35 How many households are at risk of falling through the housing safety net?
We have defined those at risk of falling through the housing safety net as households that meet the following two criteria:
1. Housing costs in excess of 30% of income; and
2. Income below 60% of the national median household income.
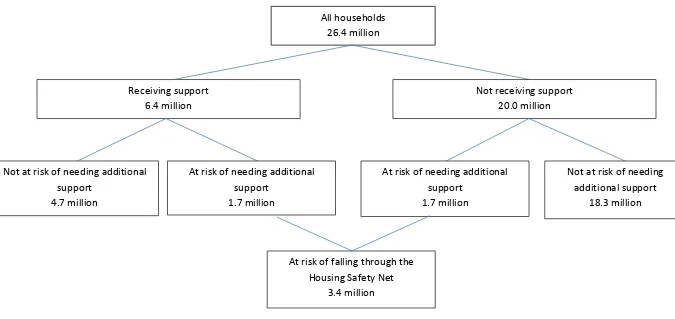
Approximately 3.4 million households have either fallen through the housing safety net or are currently at risk of falling through the net on the basis of being in both the above risk categories (Figure 8a). This represents 12.9 per cent of all households – more than one-in-eight (Table 3).
Of the 3.4 households at risk of falling through the housing safety net, more than one-third (1.3 million) are private renters, one-third (1.1 million) are social renters and somewhat less than one-third (1.0 million) are owner occupiers (Figure 8b and Table 2). Of the 3.4 million households at risk of falling through the housing safety net, half (1.7 million) currently receive some support from the net while the other half (1.7 million) receive no support.
Of the 1.7 million receiving no support, just less than half (0.8 million) are private renters and just over half (0.9 million) are owner occupiers (figure 8b and table 2). Of the 1.7 million receiving some support, just under one-third (1.1 million) are social renters, somewhat less than one-third (0.5 million) are private renters in receipt of LHA and around 1-in-20 (0.1 million) are owner occupiers in receipt of SMI.
36 Figure 8a Households at risk of falling through the Housing Safety Net (based on housing costs >30% of income AND income <60% median)
Source: 2011-12 Family Resources Survey breakdown, grossed to total households in 2011 Census of Population
All households 26.4 million
Receiving support 6.4 million
Not at risk of needing additional support
4.7 million
Not receiving support 20.0 million
At risk of needing additional support
1.7 million
At risk of needing additional support
1.7 million
Not at risk of needing additional support
18.3 million
At risk of falling through the Housing Safety Net
37 Figure 8b Households at risk of falling through the Housing Safety Net (based on housing costs >30% of income AND income <60% median) by housing tenure and support category
Source: 2011-12 Family Resources Survey breakdown, grossed to total households in 2011 Census of Population
Households at risk of falling through the Housing Safety Net
3.4 million
Receiving some support 1.7 million
Receiving no support 1.7 million
Social renters
1.1 million
Private renters with LHA 0.5 million
Owners with SMI 0.1 million
Private renters
0.8 million
Owners