ISSN Online: 2327-4085 ISSN Print: 2327-4077
DOI: 10.4236/jmmce.2019.76029 Nov. 18, 2019 421 J. Minerals and Materials Characterization and Engineering
Studies on the Effects of Bentonite (Nanoclay)
on the Mechanical Properties of High-Density
Polyethylene
Jerome Anokwu
Department of Petroleum and Gas Engineering, University of Salford, Salford, United Kingdom
Abstract
In this work, the effect of Bentonite (Nanoclay) on the mechanical and mor-phology properties of HDPE/Nanoclay composite pipe material was investi-gated. This led to the development of a composite material with improved mechanical properties. The HDPE/nanoclay composites were produced using an injection moulding machine at 200˚C and rotor speed of 50 rpm. The compatibilizer used in this study was Polyethylene-graft-Maleic Anhydride. Different compositions of nanoclay reinforcements were prepared and added to HDPE resin. A particle size of 425 μm was used in proportions of 0%, 5%, 10%, 15%, and 20% on weight fraction basis. All the composites samples were characterized by Zwick Roell tensile testing machine and Scanning Election Microscopy (SEM). Experimental results obtained showed improvements in the tensile strength, and modulus at the expense of elongation. The maximum tensile strength and modulus was obtained at 10% filler composition. These enhanced properties are due to the homogenous dispersion of nanoclay in HDPE matrix, which is evident from the structure that was evaluated using SEM.
Keywords
High-Density Polyethylene, Bentonite, Tensile Strength, Modulus
1. Introduction
Polyethylene (PE) pipes have become increasingly useful in the Oil and Gas in-dustry and beginning to replace the traditional steel and iron pipes. This is due to the fact that polyethylene pipes offer such desirable features as good strength to weight ratio, abrasive resistance, high impact resistance, superior flexibility and reduced transportation and handling costs [1]. This, together with corrosion
How to cite this paper: Anokwu, J. (2019) Studies on the Effects of Bentonite (Nanoclay) on the Mechanical Properties of High-Density Polyethylene. Journal of Minerals and Mate-rials Characterization and Engineering, 7, 421-434.
https://doi.org/10.4236/jmmce.2019.76029
Received: October 2, 2019 Accepted: November 15, 2019 Published: November 18, 2019
Copyright © 2019 by author(s) and Scientific Research Publishing Inc. This work is licensed under the Creative Commons Attribution International License (CC BY 4.0).
http://creativecommons.org/licenses/by/4.0/
DOI: 10.4236/jmmce.2019.76029 422 J. Minerals and Materials Characterization and Engineering resistance and ease of jointing, makes polyethylene an ideal material in the con-struction of piping with usage estimated at around 2 million tonnes per annum in Western Europe alone [2].
Conventional steel pipes used in petroleum industries are characterized by high cost of maintenance, corrosion and lower life cycles. The total annual cost of corrosion in the oil and gas industry is estimated at $1.372 billion, with $589 million representing pipeline and facility costs, down hole tubing expenses con-suming $463 million and $320 million capital expenditures for corrosion control
[3]. The use of composite pipe is expected to greatly reduce the economic losses (due to corrosion and high cost of maintenance) and provides new investment opportunities.
Despite the many benefits associated with PE pipes, it is the weakest in terms of ultimate tensile strength. Polyethylene like all other thermoplastics creeps at ambient temperatures. This implies that even under relatively low stress, the material will very slowly elongate and eventually fail. Although polyethylene is the preferred material for gas distribution up to operating pressure of 10 barg at standard wall thickness due to risk of corrosion in steel pipes. Unfortunately, PE technology do not allow operation with confidence above this pressure. Hence this limits its application to only low pressure systems. Therefore, research in piping material is very significant as the networks of pipes in the US, Europe and Russia run to about 1,200,000 km [4].
However, reinforced plastics provide a further field of opportunity in pipe systems. Firstly, by physical reinforcement with a second material, e.g. glass or carbon fibre, physical properties can be dramatically modified. Depending on the extent of reinforcement, it has been demonstrated that polyethylene will withstand increasing internal pressures to over 400 barg rupture, i.e. ten times the unreinforced material. The combination of corrosion resistance and high pressure performance offers potential in offshore applications where tremend-ous cost savings could be realized when compared to steel and more complex composite structures [2].
DOI: 10.4236/jmmce.2019.76029 423 J. Minerals and Materials Characterization and Engineering Most literatures on composite pipes focused more on fiber layered reinforced composite pipes: Bakaiyan et al., developed multi-layered filament-wound com-posite pipes and analyzed its internal pressure and thermomechanical effect [8]. Xia et al., developed filament-wound fiber reinforced sandwich composite pipe and analyzed it based on internal pressure and thermo-mechanical loading [9]. Ellyin et al., developed multi-directional filament-wound glass fiber/epoxy pipe and analyzed it based on biaxial loading [10].
This research work however, seeks to develop a High-Density Polyethy-lene/Clay composite piping material that can have a potential for high pressure application in the oil industry (distribution and transmission pipe networks). The piping material constituents (HDPE and Bentonite clay) were selected to minimize the effect of corrosion, reduced weight and improved tensile strength and flexural modulus.
2. Methodology
From the review of relevant literatures, it was evident that there was no pre-viously published work investigating the effect of nanoclay (Bentonite) on the mechanical properties of High-Density Polyethylene pipe material. Hence, it was decided to carryout mechanical and morphological testing using equipment available at the University of Salford Manchester, United Kingdom to examine the fundamental behaviour of HDPE pipe material with nanoclay inclusion. The tests conducted were described in this chapter together with a detailed report of raw materials selection, sample preparation and manufacture.
2.1. Materials
The High-density polyethylene sample (HDPE, PE-LA-50D12) with density of 0.957 g/cm3, melt flow index of 2.16 kg/190˚C and processing temperature of 200˚C - 260˚C was supplied by Alfa Aesar Chemical Manufacturing Company USA. Purified bentonite, with cation exchange capacity (CEC) of 96 meq/100g and an interlayer spacing d001 = 15 A˚, which was provided by the department of Petroleum and Gas Engineering at the University of Salford; has been used as the nanofiller. Polyethylene-graft-Maleic Anhydride have been chosen as clay/matrix reactive compatibilizer.
2.2. Preparation of HDPE/Nanoclay Composite
The HDPE, Nanoclay and Polyethylene-graft-Maleic Anhydride were each measured out with the use of a micro measurement digital scale, a weighing can and a spoon for transferring the resin, filler and compatibilizing agent into the measuring can.
DOI: 10.4236/jmmce.2019.76029 424 J. Minerals and Materials Characterization and Engineering
2.3. Mixing and Compounding of the HDPE/Nanoclay Composite
The compounding or mixing together of filler and plastic attracts much interest as a means of arriving at new property combinations without having to synthes-ize novel structures.
Usually when filler is incorporated into a plastic, phase separation occurs which tends to form a homogenous mixture that does not enhance preparation. In order to eliminate the problem of phase separation, the mixing was done properly and thorough. Since speed mixers were not available, the hand was scrupulously used to achieve a good mix.
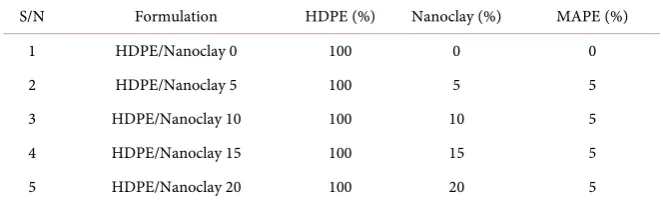
The fabrication of the composite samples was carried out using the injection moulding technique. Separate sets of composites were prepared using the High Density polyethylene, polyethylene-graft-Maleic Anhydride (MAPE) and bento-nite clay as filler. The filler loadings were varied from 0% to 20% weight. Some samples were prepared with a constant weight of 5% of the Polyethy-lene-graft-Maleic Anhydride while the control specimen were prepared without the Polyethylene-graft-Maleic Anhydride. The formulations for the composites fabrication are shown in Table 1 below.
2.4. Production of HDPE/Nanoclay Composites
Referring to Table 1 below, blend rations of HDPE to nanoclay were fixed at 100/0, 100/5, 100/10, 100/20 with the composition of the compatibilizing agent maintained at 5%.
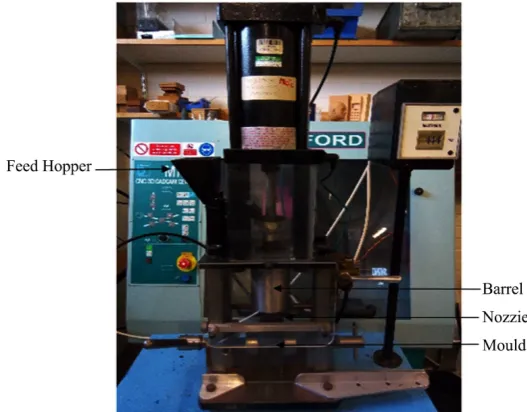
[image:4.595.239.503.486.692.2]The various sample compositions were charged into a medium sized injection molding machine of 10 HP and 50 rpm for 2 minutes, and molded into a dumb-bell sheet having dimensions of 33 mm × 4.85 mm × 2.16 mm. A medium sized injection molding machine is shown in Figure 1 below.
Figure 1. Diagram of injection moulding machine. Source: Materials
DOI: 10.4236/jmmce.2019.76029 425 J. Minerals and Materials Characterization and Engineering
Table 1. Blend composition of HDPE/Nanoclay composites.
S/N Formulation HDPE (%) Nanoclay (%) MAPE (%)
1 HDPE/Nanoclay 0 100 0 0
2 HDPE/Nanoclay 5 100 5 5
3 HDPE/Nanoclay 10 100 10 5
4 HDPE/Nanoclay 15 100 15 5
5 HDPE/Nanoclay 20 100 20 5
Each blend or formulation is poured into the hopper feeder of the injection molding machine. The hopper feeder is connected to the barrel of the machine which helps in transporting the resins to the required point or zones for further processing.
The resins first entered the feed zone where they are pre-heated at a tempera-ture of 200˚C by the heater band and conveyed by the reciprocating screw to the compression zone where the polymer is made more compact and a continuous stream of polymer melt is formed.
The blend or mixture of molten polymer enters the metering zone where it is homogenized to a material of constant temperature of 250˚C and pressure and supplied to the molding unit at constant rate.
As the reciprocating screw rotates, it pumps the molten polymer forward, the screw itself moving backwards allowing accumulation of enough material to fill the mould. The screw stops rotating as the mould is closed and then as it moves forward axially, it plays the role of an injection plunger. The two kinds of motion of the screw are controlled by a hydraulic system. The filler of the mold is ac-complished by the flow of the polymer melt under high injection pressure along the nozzle, runner and gates into the cavities.
Finally, the molten polymer is injected into the dumbbell mould fixed at the die head, through the jet or nozzle which is kept at a much higher temperature leading to fast curing inside the mould. A dumbbell shaped product is then formed on cooling.
2.5. Experimental Procedures
In reality, pressurized PE pipes behave in exactly the same way as tensile speci-mens [2]. Hence, the dumbbell shaped high-density polyethylene/nanoclay composite produced was subjected to tensile test (ASTM-D638), and morphol-ogy test to find out the mechanical properties and to examine the rate of disper-sion of the clay filler into the polymer matrix respectively.
2.5.1. Tensile Test
DOI: 10.4236/jmmce.2019.76029 426 J. Minerals and Materials Characterization and Engineering
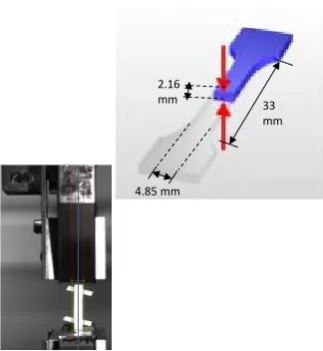
Figure 2. Test specimen clamped to the tensile tester. Source:
Materials engineering laboratory university of salford.
with constant rate of power grip motion test, which is a constant rate of motion, one grip against another fixed grip. The grip holds the ends of the specimen and the mechanical properties of the sample are tested. The tests are performed at a crosshead speed of 100 mm/min, then the force is recorded as a function of the increase in gauge length. While tensile force is applied, the gauge section is elongated and compared to the applied tensile force. Three specimens are tested for each blend composition according to ASTM standards and the mean values are used for discussion. The following properties were tested for at increased fil-ler (nanoclay) loading;
• Maximum load. • Elongation at break. • Tensile strength. • Strain.
• Young modulus. Condition of Test
1) Standard laboratory atmosphere of 21˚C ± 2˚C. 2) Speed of testing: 100.00 mm/min
Dimension of Specimen 1) Gauge length 33 mm 2) Specimen width 4.85 mm 3) Thickness 2.16 mm
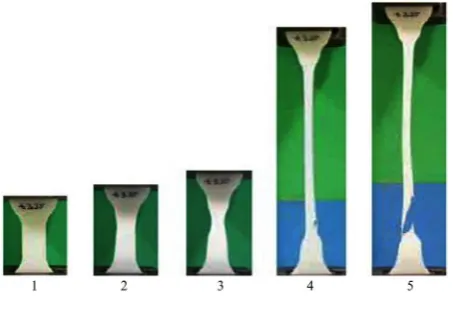
Figure 3 shows the profile of HDPE100%/NC0% during the different stages of the tensile test. The length of the specimen elongated 73.1 mm at break from 33 mm to 106 mm representing an elongation of 221.5% at break.
2.5.2. Morphology Test
Scanning electron microscopy, SEM, (Philips XL30, operating at 500x magnifi-cation, 120 keV) images is also used to study the phase morphology of the com-posite samples. The bonding between fibers and matrix and potential failure
2.16
mm 33
mm
DOI: 10.4236/jmmce.2019.76029 427 J. Minerals and Materials Characterization and Engineering
Figure 3. Profile of the plain HDPE sample during
characteristic stages of the tensile test.
mechanisms otherwise known as the dispersibility of the clay in polymer matrix is studied.
Scanning Electron Microscopy (SEM), is used very effectively in microanalysis and failure analysis of solid inorganic materials. Electron microscopy is carried out at high magnifications, generating high-resolution images and precisely measures very small features and objects. Scanning Electron Microscopy uses a light-beam of electrons to produce a series of waves at the surface of the test sample. While carrying out SEM test, data is gathered over a chosen area of the surface of the specimen and a two-dimensional image is generated that reveals spatial variations in properties including chemical characterization, texture and orientation of materials. The SEM is equally used in studying selected points on the specimen. This technique is very helpful in qualitatively or semi-quantitatively evaluating the chemical compositions, crystalline structure and crystal orienta-tions of the test specimen.
3. Results and Discussion
In this chapter the results of the tensile tests such as tensile strength, elongation at break and modulus are presented and analyzed. Also a detailed report of SEM (scanning electron microscopy) images from the morphology test carried out on the samples is discussed. Table 2 lists the parameters analysed in the tensile test.
3.1. Tensile Test Result
The result of the tensile test performed on the Zwick Roell 2.5 KN testing ma-chine were recorded and tabulated as shown below for each with variations in nanoclay filler composition.
DOI: 10.4236/jmmce.2019.76029 428 J. Minerals and Materials Characterization and Engineering
Table 2. Tensile test result.
Formulation
(%) Max. Load (N) Elongation at Break (mm)
Tensile Strength (N/mm2)
Elongation (%) Strain
Young’s Modulus (N/mm2)
HDPE
100%/NC 0% 242 73.1 23.1 221.5 2.215 10.43 HDPE
100%/NC 5% 220 41.3 21.0 125.15 1.25 16.8 HDPE
100%/NC 10% 279 4.2 26.63 12.72 0.127 209.68 HDPE
100%/NC 15% 166 18.8 15.85 54.5 0.569 27.85 HDPE
100%/NC 20% 202 13.2 19.28 40 0.4 48.2
26.63 N/mm2, 279 N and 209.68 N/mm2 respectively. On the other hand it showed the least elongation at break, elongation and the smallest strain at 4.2 mm, 12.725% and 0.127 respectively. The HDPE100%/NC15% had the least max load at 166 N with a lower tensile strength than the control specimen at 15.8 N/mm2. The HDPE100%/NC20% showed a low elongation at break of 13.2 mm and a higher modulus of 48.2 N/mm2 than the control sample showed.
3.2. Tensile Strength Analysis
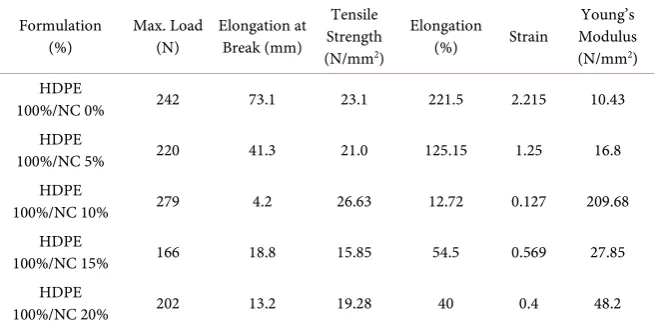
The HDPE/Nanoclay reinforced composite specimen are prepared with different filler proportions and tested in the Zwick Roell Tensile Tester. The typical load versus strain graph generated directly from the machine for tensile test is pre-sented in Figure 4.
From Figure 4, it can be seen that, the load is steeply increases with increasing strain up till the yield point. However, the filled HDPE samples show lower load at yield when compared with virgin HDPE sample.
From the result of the tensile test, the graph and bar chart in Figure 5 and
Figure 6 shows that maximum load is 242 N at 0% filler loading. It decreased at 5% filler composition and peaks at 10% filler loading to 279 N. However, further increment in filler concentration up to 20% resulted in a decrease in maximum load.
From the tensile test, Figure 7 and Figure 8 respectively showed that tion at break was highest at 0% filler composition, 73.1 mm. However, elonga-tion decreases sharply with increasing filler loading with minimum elongaelonga-tion at break, 4.2 mm occurring at 10% filler composition. This means that the incor-poration of clay filler results in a drastic reduction in elongation.
DOI: 10.4236/jmmce.2019.76029 429 J. Minerals and Materials Characterization and Engineering
Figure 4. Stress-strain curve for HDPE/Nanoclay Composite at different
[image:9.595.259.489.377.519.2]filler loading.
Figure 5. Effect of filler composition on maximum load.
Figure 6. Effect of increasing filler composition on
maximum load.
0, 242 5, 220 10, 279
15, 166 20, 202
0 50 100 150 200 250 300
0 5 10 15 20 25
M
ax
im
um
L
oad
(N
)
Percentage Filler Composition (%)
Effects of Filler Composition on Max Load. HDPE/Clay
0 50 100 150 200 250 300
1
M
ax
im
um
L
oad
(N
)
Percentage Filler Composition
[image:9.595.261.487.553.696.2]DOI: 10.4236/jmmce.2019.76029 430 J. Minerals and Materials Characterization and Engineering
Figure 7. Effect of filler composition on elongation.
Figure 8. Effects of increasing filler composition on
[image:10.595.260.487.231.352.2]elongation at break.
Figure 9. Effect of filler composition on tensile strength.
Figure 10. Effects of increasing filler composition on tensile
strength.
0, 73.1
5, 41.3
10, 4.2
15, 18.8 20, 13.2 0 10 20 30 40 50 60 70 80
0 5 10 15 20 25
El on gat ion at B re ak (mm)
Percentage Filler Composition (%)
Effects of Filler Composition on Elongation
HDPE/Clay 0 20 40 60 80 1 El on gat ion at B re ak (mm)
Percentage Filler Composition
0% 5% 10% 15% 20%
0, 23.15, 21 10, 26.63
15, 15.8520, 19.28
0 10 20 30
0 10 20 30
Ten sil e S ten gt h (N /mm 2)
Percentage Filler Composition (%)
Effects of Filler Composition on Tensile
Strength
HDPE/Clay 0 5 10 15 20 25 30 1 2 Ten sil e S tr en gt h (N /mm 2)Percentage Filler Composition
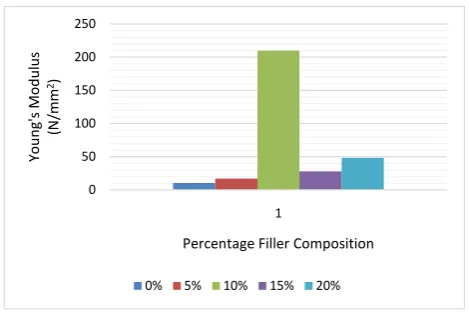
[image:10.595.258.491.399.533.2] [image:10.595.258.490.568.692.2]DOI: 10.4236/jmmce.2019.76029 431 J. Minerals and Materials Characterization and Engineering From the graph and bar chart in Figure 11 and Figure 12, it can be seen that the greatest modulus of 209.68 N/mm2 of the HDPE/Clay composite was at 10% filler loading. However, with increasing filler loading modulus decreased drasti-cally. This means that there is an improvement in modulus of the composite material at 10% filler composition, but above that composition modulus de-creases.
3.3. Microstructural Analysis of HDPE/Nanoclay Composite
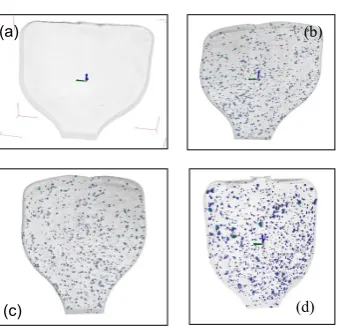
[image:11.595.256.492.343.522.2]The SEM micrograph of different filler loading for the HDPE/Nanoclay sample prior to tensile loading is presented in Figure 13. SEM micrographs are used to observe the internal structure of the composite material and to study the disper-sibility of the clay in polymer matrix.
[image:11.595.256.491.552.710.2]Figure 13 shows SEM images of HDPE/Nanoclay composite samples. In or-der to investigate the dispersibility of silicate clays in the nanocomposite, scan-ning electron microscopy (SEM) was performed on (a) HDPE/Nanoclay 0%, (b) HDPE/Nanoclay 10%, (c) HDPE/Nanoclay 15% and (d) HDPE/Nanoclay 20% samples.
Figure 11. Effect of filler composition on modulus.
Figure 12. Effect of increasing filler composition on modulus.
0, 10.435, 16.8 10, 209.68
15, 27.8520, 48.5 0
50 100 150 200 250
0 10 20 30
Yo
ung
's M
odul
us
(N
/mm
2)
Percentage Filler Composition (%)
Effect of Filler Composition on Modulus
HDPE/Clay
0 50 100 150 200 250
1
Yo
ung
's M
odul
us
(N
/mm
2)
Percentage Filler Composition
DOI: 10.4236/jmmce.2019.76029 432 J. Minerals and Materials Characterization and Engineering
Figure 13. SEM Micrographs of (a) HDPE/Nanoclay0% (b) HDPE/Nanoclay10%
(c) HDPE/Nanoclay15% (d) HDPE/Nanoclay 20% samples.
Figure 13(a). SEM for HDPE/Nanoclay 0% showed brilliant crystal structure of polyethylene as there was inclusion of clay, hence no dispersion.
Figure 13(b). SEM for HDPE/Nanoclay 10%, finely dispersed droplets of the clay can be seen as the blue and green colourations uniformly distributed around the image. It is clear that the organoclay platelets are well dispersed in this sam-ple. This suggests an exfoliated morphology.
Figure 13(c). SEM for HDPE/Nanoclay15%. The dispersion of the nanoclay is not as uniform as the HDPE/Nanoclay10%. This could mean that there is partial intercalation of the extended chain in between the sheets. Therefore an interca-lated structure is obtained.
Figure 13(d). SEM for HDPE/Nanoclay20%. Detectable aggregations and ag-glomeration of the particles in one place can be seen from the image. This means that due to increased filler loading, the polymer is unable to intercalate between the clay sheets, this results in a phase separated nanocomposite structures. This is in agreement with the work of Kung-Jun Hwang on the three types of mor-phology in the case of polymer nanoclay composites [12].
4. Conclusions
The result of the tensile experiment obtained, showed that the tensile properties of the HDPE/Nanoclay composite were optimal at 10% filler composition. This is to say that the HDPE/Clay 10% nanocomposite sample produced higher ten-sile strength, maximum load and modulus of elasticity at the expense of elonga-tion when compared with the 0, 5, 15 and 20wt% respectively.
Conversely, the results of the tensile test were correlated with SEM (Scanning Electron Micrograph) observations in which the dispersibility of silicate clays in the nano composites was investigated. HDPE/Clay nanocomposite with 10wt% clay filler showed better exfoliated structure than their counterpart having 5%, 15% and 20% clay content. This means that at higher loading exfoliation de-creases because the homogenous structure of nanoclay with HDPE is difficult to achieve and mechanical properties decline.
(a)
(c)
(b)
DOI: 10.4236/jmmce.2019.76029 433 J. Minerals and Materials Characterization and Engineering These enhanced properties are due to the homogenous dispersion of nanoclay in HDPE matrix, which is evidenced from the structure that was evaluated using SEM in Figure 13(b). This is because uniform distribution and dispersion of the filler ensures uniform properties of the product. The agglomeration of the par-ticles in one place can cause weakening of the structure [13]. Hence, exfoliated configurations of nanocomposites have shown to have better properties for the desired product compared to intercalated structure.
Recommendations
Based on the experiments and the results obtained, I make the following rec-ommendations.
• This work showed a good use of nanoclay for industrial purpose; as such I will not hesitate to recommend it for products which require high strength applications, good stiffness, resilience and translucency.
• Subsequent researches should consider fillers like mica, talc, carbon nano-tubes and bio-fillers in order to discover other novel properties which could improve polyethylene pipe material, and thus find new areas of application for them, and also modify and compare its properties with mine.
Acknowledgements
The author of this article would love to acknowledge Meisam Babaie of the De-partment of Petroleum and Gas Engineering University of Salford; for his inter-est and invaluable contributions towards the success of this research. Great thanks to Alan Mappin, Phil Walker and Mike Clegg, all of the School of Com-puting Science and Engineering, University of Salford who assisted with the la-boratory work.
Conflicts of Interest
The author declares no conflicts of interest regarding the publication of this pa-per.
References
[1] Currence, D. (2017) Advancements in Corrugated Plastic Pipe Used in Non-Pressure Pipeline: Evolution of HDPE.
https://www.ads-pipe.com/news-media/evolution-hdpe
[2] Askeland, D.R. (2003) The Science and Engineering of Materials. 4th Edition, Brooks/Cole, London.
[3] Ruschau, G.R. and Al-Anezi, M.A. (2003) Oil and Gas Exploration and Production.
http://www.corrosionda.com/prodmanu/
[4] Berisa, M., Lesis, V. and Didziokas, R. (2005) Comparison of Pipe Internal Pressure Calculation Methods.
DOI: 10.4236/jmmce.2019.76029 434 J. Minerals and Materials Characterization and Engineering
https://doi.org/10.4236/msa.2014.51006
[6] Sapaum, S.M., Leenie, A., Harium, M. and Beng, Y.K. (2005) Mechanical Properties of Woven Banana Fibre Reinforced Epoxy Composites. Materials & Design, 27, 689-693. https://doi.org/10.1016/j.matdes.2004.12.016
[7] Oseghale, I.C. and Umeania, N.H. (2011) Application of Reinforced Composite Piping (RCP) Technology to Liquefied Petroleum Gas Distribution. Research Jour-nal of Applied Sciences, 6, 197-204.https://doi.org/10.3923/rjasci.2011.197.204 [8] Bakaiyan, H., Hosseini, H. and Ameri, E. (2009) Analysis of Multi-Layered
Fila-ment-Wound Composite Pipes under Combined Internal Pressure and Ther-momechanical Loading with Thermal Variations. Composite Structures, 88, 532-541.https://doi.org/10.1016/j.compstruct.2008.05.017
[9] Xia, M., Kemmochi, K. and Takayanagi, H. (2001) Analysis of Filamentwound Fi-bre-Reinforced Sandwich Pipe under Combined Internal Pressure and Thermome-chanical Loading. Composite Structures, 51, 273-283.
https://doi.org/10.1016/S0263-8223(00)00137-9
[10] Ellyin, F., Caroll, M. and Chiu, A.S. (1997) The Behaviour of a Multidirectional Filament-Wound Glass-Fibre/Epoxy Tubular under Biaxial Loading. Composites Science and Technology, 28, 781-790.
[11] (1999) American Society for Testing and Materials.
[12] Hwang, K.-J., Park, J.-W., Kim, I., Ha, C.-S. and Kim, G.-H. (2006) Effect of a Compatibilizer on the Microstructure and Properties of Partially Biodegradable LDPE/Aliphatic Polyester/Organoclay Nanocomposites. Macromolecular Research, 14, 179-186. https://doi.org/10.1007/BF03218506