energies
Article
Novel Analytical Microbial Fuel Cell Design for
Rapid in Situ Optimisation of Dilution Rate and
Substrate Supply Rate, by Flow, Volume Control and
Anode Placement
Jiseon You * , John Greenman and Ioannis Ieropoulos *
Bristol BioEnergy Centre, University of the West of England, Bristol BS16 1QY, UK; [email protected] * Correspondence: [email protected] (J.Y.); [email protected] (I.I.); Tel.: +44-117-328-6318 (I.I.)
Received: 6 August 2018; Accepted: 30 August 2018; Published: 9 September 2018
Abstract:A new analytical design of continuously-fed microbial fuel cell was built in triplicate in order to investigate relations and effects of various operating parameters such as flow rate and substrate supply rate, in terms of power output and chemical oxygen demand (COD) removal efficiency. This novel design enables the microbial fuel cell (MFC) systems to be easily adjusted in situ by changing anode distance to the membrane or anodic volume without the necessity of building many trial-and-error prototypes for each condition. A maximum power output of 20.7±1.9µW was obtained with an optimal reactor configuration; 2 mM acetate concentration in the feedstock coupled with a flow rate of 77 mL h−1, an anodic volume of 10 mL and an anode electrode surface area of 70 cm2(2.9 cm2projected area), using a 1 cm anode distance from the membrane. COD removal almost showed the reverse pattern with power generation, which suggests trade-off correlation between these two parameters, in this particular example. This novel design may be most conveniently employed for generating empirical data for testing and creating new MFC designs with appropriate practical and theoretical modelling.
Keywords: microbial fuel cell (MFC); anode distance; anodic volume; flow rate; dilution rate; substrate supply rate; treatment efficiency; power generation
1. Introduction
In the past two decades, scientific interest in the microbial fuel cell (MFC) technology has increased rapidly. Direct conversion of organic matter including various types of waste into electricity is one key aspect that enable this technology to stand out among other renewable energy related technologies. Moreover, its application is not limited to only electrical energy generation and waste treatment. For instance, the same working principles applied to the MFC technology can be used, with the supply of external power, for producing useful products such as hydrogen [1,2], acetate [3,4], methane [5,6] as well as desalinate water [7,8]. Resource recovery and bio-sensing [9–13] are also highly active fields in the MFC research. Along with practical development of the technology, microorganisms involved in electricity generation have drawn a great deal of attention too. Electrochemically active biofilms (EABs) on MFC electrodes continue to be studied to better understand the anodic biofilm properties involved in substrate digestion, utilisation and transformation of chemicals, all resulting electricity generation. EABs have also been used for microbial computing [14–16].
It is generally agreed that continuous flow bioreactors for either planktonic or biofilm culture systems are more efficient than their corresponding batch culture processes in terms of start-up, turnaround, maintenance, efficiency and control. Small-scale MFC using perfusable anode electrodes are particularly suited for continuous operation since biofilms form on a highly porous material,
Energies2018,11, 2377 2 of 12
ensuring that diffusion limitation (of substrate to biofilm) does not limit growth and that following monolayer saturation of the electrode (termed “mother layer”), all new daughter cells that form are shed and washed away by laminar flow of bulk medium at high liquid shear rates. The electrode-attached cell population (the biofilm) remains as a constant number of cells with time and with constant flow, the biofilm quickly reaches dynamic steady state [17]. As a biofilm system, the small-scale perfusion anode MFC is analogous to a chemostat system in terms of steady state, and therefore the effects of flow rate, chamber volume and feedstock concentration can be more easily determined, and well-known terms used in chemostat theory (e.g., Monods equations) applied in modelling.
In this study, a novel analytical MFC design was developed, which enables the system to be easily set, tuned or adjusted to a given condition by altering reactor configurations such as anode position or reactor volume. With the help of this novel MFC design, this study aimed to: (1) demonstrate the effects of anode chamber volume and distance to anode electrode as important parameters in reactor configuration in terms of electricity generation, and (2) investigate the relationships between flow rate, volume, dilution rate and substrate supply rate on power output and COD reduction. In addition to these findings, which validate the new MFC design, potential applications of this analytical MFC can be used for (1) analytical studies, (2) MFC modelling, and (3) enabling new MFC designs with specific target purposes.
2. Materials and Methods
2.1. Microbial Fuel Cell Design
Energies2018,11, 2377 3 of 12
[image:3.595.131.466.89.273.2]Energies 2018, 11, x FOR PEER REVIEW 3 of 13
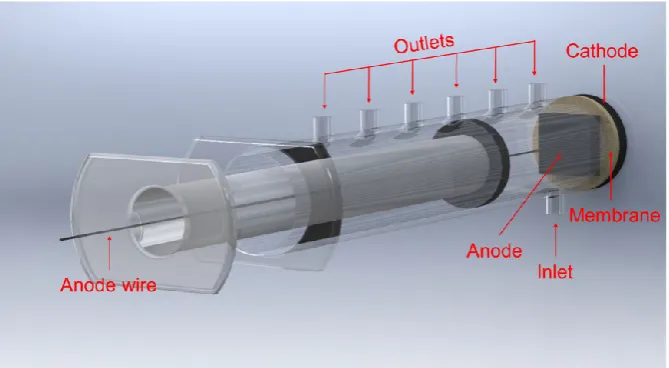
Figure 1. Computer Aided Design (CAD) image of a syringe microbial fuel cell (MFC) used in this study.
2.2. Inoculum, Feedstock and Operation
Sewage sludge from a local wastewater treatment plant (Wessex Water, Saltford, UK) was used to inoculate the MFCs, after being enriched with 1% tryptone and 0.5% yeast extract. During the first week, 10 mL of synthetic wastewater [19] was provided as the feedstock on a daily basis. Subsequently, the batch type of feedstock supply was switched to continuous feeding mode, using a 16‐cahnnel peristaltic pump (205U, Watson Marlow, Falmouth, UK) with variable flow rates, ranging from 19.2 mL h−1 to 306.9 mL h−1. The synthetic wastewater was prepared by adding the following to 1 L of distilled water: 0.270 g (NH4)2SO4, 0.060 g MgSO4·7H2O, 0.006 g MnSO4·H2O, 0.50 g NaCl, 0.13 g NaHCO3, 0.003 g FeCl3·6H2O, 0.006 g CaCl2·2H2O, 0.006 g K2SO4. Sodium acetate was used as the carbon energy source at variable concentrations, ranging between 0.1 mM and 4.0 mM.
Throughout the work, a 1.5 kΩ external load was connected to each MFC, which was determined based on polarisation runs (data not shown) that were carried out at the start of the experiments. Power output of the MFCs was monitored in real time in volts (V) against time using an ADC‐24 Channel Data Logger (Pico Technology ltd., St Neots, UK). All experiments were carried out in a temperature‐controlled environment, at 22 ± 2 °C, and repeated at least 3 times.
2.3. Anode Placement Test
In order to investigate power and COD removal related to the distance between anode and membrane (or cathode since it was directly attached to the obverse side of the membrane), the MFC reactor was set to its maximum volume of 50 mL thus the anode was able to be moved to give adjustment between 0 up to 6 cm from the membrane. For this test, 2 mM of acetate was supplied at a flow rate of 19 mL h−1,which resulted in dilution rate of 0.38 h−1 and nutrient supply rate of 0.04 mmol h−1. The dilution rate (D) is inversely related to the hydraulic retention time (HRT); where HRT = 1/D. The dilution rate was calculated by dividing the flow rate (f) (how much medium flows into the vessel per hour) by the chamber volume (V), since D = f/V.
The substrate supply rate (R) is defined by: R = S × f
where S is the substrate molar concentration (mmol L−1) and f is feedstock flow rate (L h−1).
Figure 1.Computer Aided Design (CAD) image of a syringe microbial fuel cell (MFC) used in this study.
2.2. Inoculum, Feedstock and Operation
Sewage sludge from a local wastewater treatment plant (Wessex Water, Saltford, UK) was used to inoculate the MFCs, after being enriched with 1% tryptone and 0.5% yeast extract. During the first week, 10 mL of synthetic wastewater [19] was provided as the feedstock on a daily basis. Subsequently, the batch type of feedstock supply was switched to continuous feeding mode, using a 16-cahnnel peristaltic pump (205U, Watson Marlow, Falmouth, UK) with variable flow rates, ranging from 19.2 mL h−1to 306.9 mL h−1. The synthetic wastewater was prepared by adding the following to 1 L of distilled water: 0.270 g (NH4)2SO4, 0.060 g MgSO4·7H2O, 0.006 g MnSO4·H2O, 0.50 g NaCl, 0.13 g NaHCO3, 0.003 g FeCl3·6H2O, 0.006 g CaCl2·2H2O, 0.006 g K2SO4. Sodium acetate was used as the carbon energy source at variable concentrations, ranging between 0.1 mM and 4.0 mM.
Throughout the work, a 1.5 kΩexternal load was connected to each MFC, which was determined based on polarisation runs (data not shown) that were carried out at the start of the experiments. Power output of the MFCs was monitored in real time in volts (V) against time using an ADC-24 Channel Data Logger (Pico Technology ltd., St Neots, UK). All experiments were carried out in a temperature-controlled environment, at 22±2◦C, and repeated at least 3 times.
2.3. Anode Placement Test
In order to investigate power and COD removal related to the distance between anode and membrane (or cathode since it was directly attached to the obverse side of the membrane), the MFC reactor was set to its maximum volume of 50 mL thus the anode was able to be moved to give adjustment between 0 up to 6 cm from the membrane. For this test, 2 mM of acetate was supplied at a flow rate of 19 mL h−1, which resulted in dilution rate of 0.38 h−1and nutrient supply rate of 0.04 mmol h−1. The dilution rate (D) is inversely related to the hydraulic retention time (HRT); where HRT= 1/D. The dilution rate was calculated by dividing the flow rate (f) (how much medium flows into the vessel per hour) by the chamber volume (V), sinceD=f/V.
The substrate supply rate (R) is defined by:
R=S×f
whereSis the substrate molar concentration (mmol L−1) andf is feedstock flow rate (L h−1).
2.4. Substrate Supply Rate and Dilution Rate Test
Energies2018,11, 2377 4 of 12
variable changed, the other two variables were fixed. Tested ranges of flow rate and concentration were 19–307 mL h−1for feedstock flow rate and 0.1–4.0 mM for feedstock acetate concentration. For these tests, the anodic volume was set to 30 mL. The effects of changing the anodic volume were studied by changing the volume of the anodic chamber from 10 mL to 50 mL in 10 mL increments. Feedstock concentration and flow rate were fixed at 2.0 mM and 38 mL h−1respectively. During all these tests, the anode was located next to the membrane, thus the distance between the anode and membrane was designated as 0 cm. Each concentration of feedstock or anodic volume condition was set for at least 2 h, which was long enough for MFCs to reach a stable level of power output.
2.5. Chemical Oxygen Demand (COD) Analysis
Influent and effluent were collected from the feedstock storage tank and individual MFCs respectively and samples analysed for COD. The potassium dichromate oxidation method (COD LR test vials; Camlab Ltd., Cambridge, UK) [20] and a photometer (Lovibond MD 200; The Tintometer Ltd., UK) were used to determine COD values of each sample. Efficiency of COD removal was calculated as ECOD(%) = (CODIN−CODOUT)/CODIN×100, where CODIN(mg L−1) is the influent COD and CODOUT(mg L−1) is the effluent COD.
3. Results
3.1. Effect of Anode Distance from the Membrane
As shown in Figure2, power output decreased, and COD removal rate increased as the anode moved a greater distance from the membrane. Power decrease with increasing distance between the two electrodes is most likely due to the longer traveling distance for protons to the membrane, thus higher ohmic losses [21,22]. The optimum distance between the anode and the membrane for power output was 1 cm, where the power output was 4.8% higher than when the anode was in contact with the membrane; arguably this is within the error margin of readings between 0 cm and 1 cm, but possibly the result of oxygen crossover through the membrane to the anode (for the 0 cm condition). However, at distances between 2–6 cm there is a decreasing trend of power output, clearly showing that these distances are sub-optimal.Energies 2018, 11, x FOR PEER REVIEW 5 of 13
Figure 2. Power output and chemical oxygen demand (COD) removal efficiency with different distance between anode and membrane.
3.2. Effect of Dilution Rate
[image:4.595.116.480.498.728.2]Different dilution rates ranging from 0 to 10.2 h−1 were tested by changing feedstock flow rate (19–307 mL h−1), concentration (0.1–4 mM), and anodic volume (10–50 mL). Figure 3 describes relations between dilution rate and power output, and COD reduction rate. Previous work has confirmed that following a moderate period of time in batch culture, once beyond the decline phase, the power output of all MFCs eventually drops to zero, in line with the theoretical principle that a supply rate of zero fuel will eventually give zero metabolism. At low substrate concentrations (0.5 mM, green line in Figure 3), the power output remained low, but measurable across all dilution rates, including the highest tested D (10.2 h−1) with a steady state value around 0.13 µW. At a higher concentration of carbon energy (C/E) source (1.0 mM), a relationship can be seen between increasing dilution rate and increasing power until it reaches a limit at a dilution rate of 5.1 h−1, where the power plateaus at about 4 µW for any higher dilution rates. Similar patterns of behaviour (power increases with increasing D until a plateau is reached) are also observed at higher concentrations of substrate. The power output then remains the same despite further increases in the dilution rate.
Energies2018,11, 2377 5 of 12
For treatment efficiency of each configuration tested, the distance of 5 cm showed the highest removal rate of 98.4±1.4%, although this is not significantly different to the values recorded for 4 cm, or 6 cm. The high removal rate may again be explained by the influence of oxygen diffusion from the cathode, allowing cells in the planktonic phase as well as those in the biofilm to continue utilising the organic substrates, lower the COD, but also competing with, or inhibiting the metabolism of anodophiles, thus reducing electrical output. The overall COD reduction was over 90% in all cases, probably due to the relatively low nutrient supply rate (0.04 mmol h−1) and moderate dilution rate (0.38 h−1) employed during this experiment.
3.2. Effect of Dilution Rate
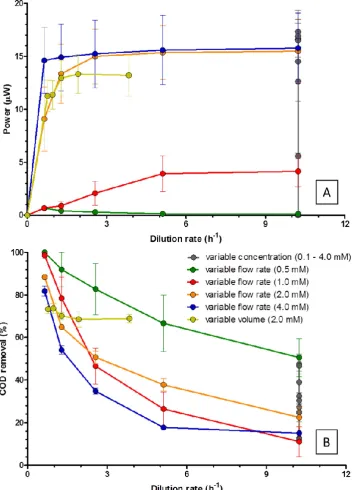
Different dilution rates ranging from 0 to 10.2 h−1were tested by changing feedstock flow rate (19–307 mL h−1), concentration (0.1–4 mM), and anodic volume (10–50 mL). Figure3describes relations between dilution rate and power output, and COD reduction rate. Previous work has confirmed that following a moderate period of time in batch culture, once beyond the decline phase, the power output of all MFCs eventually drops to zero, in line with the theoretical principle that a supply rate of zero fuel will eventually give zero metabolism. At low substrate concentrations (0.5 mM, green line in Figure3), the power output remained low, but measurable across all dilution rates, including the highest tested D(10.2 h−1) with a steady state value around 0.13µW. At a higher concentration of carbon energy (C/E) source (1.0 mM), a relationship can be seen between increasing dilution rate and increasing power until it reaches a limit at a dilution rate of 5.1 h−1, where the power plateaus at about 4µW for any higher dilution rates. Similar patterns of behaviour (power increases with increasingDuntil a plateau is reached) are also observed at higher concentrations of substrate. The power output then remains the same despite further increases in the dilution rate.
At low concentrations of C/E (0.5 and 1.0 mM), growth is strongly limited by lack of fuel (C/E limiting condition), even when supplied at a high flow or dilution rate. Also, it is likely that a significant proportion of the C/E fuel is required for maintaining microbial cell functions (maintenance energy). At higher concentrations of C/E, for example 2.0 and 4.0 mM, the maximum power output reaches levels between 15 and 16µW, and the maintenance energy becomes a much smaller proportion of the total energy output. It should be noted that doubling the concentration from 2.0 to 4.0 mM had no observable effect in producing additional electrical power showing that C/E concentrations are growth limiting at or just below 2.0 mM. At lower fuel concentrations (e.g., between 0 and 1 mM) the power output is strongly dependent on dilution rate, suggesting that the C/E is most probably limiting growth and metabolic rate and thus power generation.
Figure3(vertical black line with points) also shows the results of measuring the energy outputs obtained for a range of nine different concentrations of acetate (from 0.1 to 4.0 mM), but at a constant flow rate/dilution rate (D= 10.2 h−1). At this high and constantD, the effect of C/E alone on power output was again clearly observed. For low concentrations of C/E ranging 0.1 mM and 1.0 mM, power output increased from 0.0µW to 5.6µW, whereas there was no significant increase in power output when higher concentrations of C/E (between 2.0 mM and 4.0 mM) were used.
On the other hand, COD reduction, which reflects substrate utilisation, decreased as the dilution rate increased for all tested conditions (Figure3B). At the lowest dilution rate of 0.6 h−1, COD reduction rate was between 81.9 and 100%. Then, it went down to 11.1–50.6% at the highest dilution rate of 10.2 h−1. In all continuous biofilm flow systems there is a portion of C/E that will flow around the electrode and not be utilised by the microbial cells and this will be higher for higher substrate concentrations and/or higher flow and dilution rates.
Energies2018,11, 2377 6 of 12
[image:6.595.122.476.93.584.2]Energies 2018, 11, x FOR PEER REVIEW 6 of 13
Figure 3. Power output (A) and COD removal efficiency (B), at different dilution rates.
At low concentrations of C/E (0.5 and 1.0 mM), growth is strongly limited by lack of fuel (C/E limiting condition), even when supplied at a high flow or dilution rate. Also, it is likely that a significant proportion of the C/E fuel is required for maintaining microbial cell functions (maintenance energy). At higher concentrations of C/E, for example 2.0 and 4.0 mM, the maximum power output reaches levels between 15 and 16 µW, and the maintenance energy becomes a much smaller proportion of the total energy output. It should be noted that doubling the concentration from 2.0 to 4.0 mM had no observable effect in producing additional electrical power showing that C/E
Figure 3.Power output (A) and COD removal efficiency (B), at different dilution rates.
3.3. Effect of Substrate Supply Rate
EnergiesEnergies 2018,201811, 2377, 11, x FOR PEER REVIEW 8 of 13 7 of 12
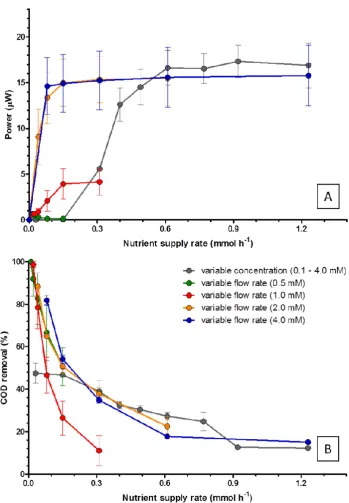
Figure 4. Power output (A) and COD removal efficiency (B), at different nutrient supply rates.
3.4. Perfusion Anode Biofilm and Quasi Steady State
Unlike the planktonic mode of bacterial growth and existence (e.g., as in the case of a chemostat), biofilms are associated with two types of populations, attached cells that are firmly bound and remain at constant populations and the planktonic phase (detached cells washing out). For biofilms, a steady state occurs when growth accumulation is matched by loss of cells from the system and such biofilms can be maintained in quasi‐steady state for as long as the operational factors of the system such as feedstock composition, nutrient supply rate and dilution rate are kept constant. Figure 5 shows stable
Figure 4.Power output (A) and COD removal efficiency (B), at different nutrient supply rates.
In general, the COD removal rate decreased with increasing nutrient supply rates. At very low nutrient supply rates (0.01–0.02 mmol h−1), COD reduction rates were over 90%, which suggests that most of the C/E source was fully utilised for cell growth and maintenance. The COD reduction rate, then decreased at higher supply rates as previously described for effects of dilution rate.
3.4. Perfusion Anode Biofilm and Quasi Steady State
Energies2018,11, 2377 8 of 12
feedstock composition, nutrient supply rate and dilution rate are kept constant. Figure5shows stable power outputs (steady states) produced by triplicate MFCs over seven days demonstrating that the replicate MFC units are highly reproducible.
Energies 2018, 11, x FOR PEER REVIEW 9 of 13
[image:8.595.130.470.143.386.2]power outputs (steady states) produced by triplicate MFCs over seven days demonstrating that the replicate MFC units are highly reproducible.
Figure 5. Stable power generation over seven days, from triplicate MFCs under metabolic steady state.
Inset graph presents a magnified view of the highlighted period.
The Monod model is most commonly used to describe the growth kinetics of cells growing in steady state. Figure 6 describes the response of the MFCs in terms of power output and COD utilisation towards changes in substrate concentration. From these data, it is possible to calculate the half‐rate saturation constant (Ks value) of 1.114 mM.
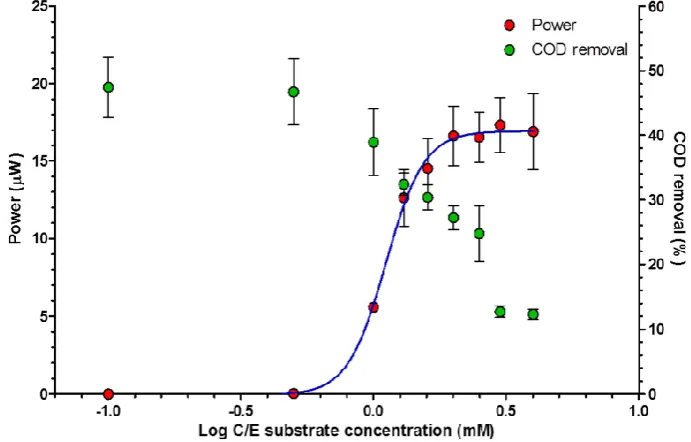
Figure 6. Power generation and COD reduction response to substrate concentration at high dilution
[image:8.595.125.471.500.721.2]rate (D = 10.2 h−1).
Figure 5.Stable power generation over seven days, from triplicate MFCs under metabolic steady state. Inset graph presents a magnified view of the highlighted period.
The Monod model is most commonly used to describe the growth kinetics of cells growing in steady state. Figure6describes the response of the MFCs in terms of power output and COD utilisation towards changes in substrate concentration. From these data, it is possible to calculate the half-rate saturation constant (Ks value) of 1.114 mM.
Energies 2018, 11, x FOR PEER REVIEW 9 of 13
power outputs (steady states) produced by triplicate MFCs over seven days demonstrating that the replicate MFC units are highly reproducible.
Figure 5. Stable power generation over seven days, from triplicate MFCs under metabolic steady state.
Inset graph presents a magnified view of the highlighted period.
The Monod model is most commonly used to describe the growth kinetics of cells growing in steady state. Figure 6 describes the response of the MFCs in terms of power output and COD utilisation towards changes in substrate concentration. From these data, it is possible to calculate the half‐rate saturation constant (Ks value) of 1.114 mM.
Figure 6. Power generation and COD reduction response to substrate concentration at high dilution
rate (D = 10.2 h−1).
Energies2018,11, 2377 9 of 12
3.5. Effect of Anodic Volume on Power and COD Reduction
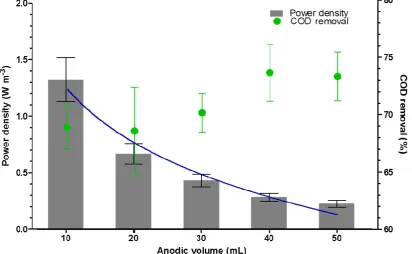
Since anodic volume is usually considered as a fixed design element, controlling dilution rate or hydraulic retention time (HRT) is done through changing the flow rate. However, the novel design of MFCs used in this study enables the anodic volume to change, it can be also an operating parameter. Power output decreased, whereas COD removal efficiency increased with increasing the anodic volume (correspondingDdecreased from 3.8 h−1to 0.8 h−1). Power density normalised by the anodic volume shows an even clearer trend opposite to the anodic volume increase as shown in Figure7. This indicates that under the given parameters such as fixed size of both electrodes and membrane, flow rate, feedstock concentration and electrode spacing, the smallest anodic volume of 10 mL was the best value for maximum power generation. For maximum COD removal, the biggest volume of 50 mL achieved the best output. These results are in accordance to those reported by others [23,24]; a shorterHRTcontributes to a decrease of COD removal. In this test, however,HRTwas controlled by changing the anodic volume instead of flow rates. Although change in planktonic bacterial population is negligible in this test, due to the relatively short time of each volume condition, it can also have an effect on MFC power output and COD removal. Larger anodic chamber volumes provide greater space for planktonic bacteria to grow, thus higher total bacterial population. This does not necessarily contribute to power generation, but consumes more organic matter in the feedstock thus achieving a higher COD removal. If the substrate is complex in terms of its molecular structure, a larger volume would be preferable since fermentative heterotrophs can break the substrate down first, making it more easily available for the anodic biofilm community.
Energies 2018, 11, x FOR PEER REVIEW 10 of 13
3.5. Effect of Anodic Volume on Power and COD Reduction
Since anodic volume is usually considered as a fixed design element, controlling dilution rate or
hydraulic retention time (HRT) is done through changing the flow rate. However, the novel design
of MFCs used in this study enables the anodic volume to change, it can be also an operating parameter.
Power output decreased, whereas COD removal efficiency increased with increasing the anodic
volume (corresponding D decreased from 3.8 h−1 to 0.8 h−1). Power density normalised by the anodic
volume shows an even clearer trend opposite to the anodic volume increase as shown in Figure 7. This indicates that under the given parameters such as fixed size of both electrodes and membrane, flow rate, feedstock concentration and electrode spacing, the smallest anodic volume of 10 mL was the best value for maximum power generation. For maximum COD removal, the biggest volume of 50 mL achieved the best output. These results are in accordance to those reported by others [23,24]; a
shorter HRT contributes to a decrease of COD removal. In this test, however, HRT was controlled by
[image:9.595.94.507.382.636.2]changing the anodic volume instead of flow rates. Although change in planktonic bacterial population is negligible in this test, due to the relatively short time of each volume condition, it can also have an effect on MFC power output and COD removal. Larger anodic chamber volumes provide greater space for planktonic bacteria to grow, thus higher total bacterial population. This does not necessarily contribute to power generation, but consumes more organic matter in the feedstock thus achieving a higher COD removal. If the substrate is complex in terms of its molecular structure, a larger volume would be preferable since fermentative heterotrophs can break the substrate down first, making it more easily available for the anodic biofilm community.
Figure 7. Volumetric power density and COD removal efficiency with different anodic volume (blue
line shows the trend of volumetric power density).
4. Discussion
MFCs with thick diffusion‐limiting biofilms have a low growth rate/metabolic rate (thus slow response time) because of slow diffusion of substrate from the medium through the thick biofilm to the inner conductive layers. Such biofilms typically form over non‐porous (solid) electrodes, especially in batch culture where mechanism of electron transfer is via mediators as much as it is by direct conduction methods. This can be minimised in small‐scale MFCs, by using highly perfusable
Figure 7.Volumetric power density and COD removal efficiency with different anodic volume (blue line shows the trend of volumetric power density).
4. Discussion
Energies2018,11, 2377 10 of 12
electrodes and high flow rate. In these conditions, the biofilm remains thin. The MFC is not limited by diffusion and soluble mediator is rapidly washed away, so it is only the thin biofilm in direct conductance that produces rapid responses and can grow at maximum specific growth rate.
The continuous flow model allows biofilms to grow and reach dynamic steady states, where the attached cell population continues to grow, metabolise and thus produce electrical power, and yet the perfusable biofilm remains constant (i.e., non-accumulating) over time by shedding of new daughter cells [17]. The relatively high flow rates and high dilution rates employed (e.g.,D= 10.2 h−1) did not seem to affect the stability of the biofilm (although this has not yet been determined by use of molecular approaches at the ecological level). However, it can be concluded that for the highest C/E-excess conditions (substrate concentration of 4 mM), a higher flow rate produced no significant change in electrical power output, which remained at maximum power (15–16µW), even at very high flow rates (equivalent toD= 10.2 h−1). For lower concentration of substrate (2.0 mM) increasing the flow rate (from 19.2 to 76.7 mL h−1) gave increasing power output up to a maximum (15µW), which then remained the same despite further increases in flow rate. The same pattern was observed when lower substrate concentration of 1.0 mM was tested. Increases in the flow rate increased the power output up to a dilution rate ofD= 5.1 h−1, where the maximum power for this concentration of substrate (3.9µW) was obtained. Therefore, it can be concluded that if the C/E supply rate is growth limiting, then the power can be maximised by increasing the flow rate. It also suggests that Fick’s laws of diffusion do not need to be incorporated into a mathematical model of the biological behaviour of such biofilm-electrodes. These findings are useful when considering the advantages of cascades and optimising the flow rate down such cascades.
Another important finding was the effect of anode working volume on power output and COD reduction efficiency. As can be seen in Figure7, when normalised for anodic working volume, higher power was generated from the smaller volume (10 mL) than the larger (50 mL) and with an inverse relationship for the tested volumes in between; this is in line with previous reports [25,26]. Treatment (COD) efficiency showed the opposite, and although the percentage reduction varied between 69–74% for all tested parameters, higher COD reduction was recorded for the larger volume experiments; this may have been the result of the fixed flow rate and fixed substrate concentration chosen for this line of experiments, and should therefore be further investigated under different fixed conditions.
5. Conclusions
Novel MFC design allows in situ placement of anode and its distance apart from the membrane-cathode to be optimised. The design is particularly suited for observing the effects of changes in the physicochemical conditions, particularly concentration of C/E in the feedstock, flow rate and thus the supply rate and dilution rate of the system, on metabolism of the anodic biofilm and thus power output. Moreover, this novel design would help to create new design of MFCs by comparing the performance in terms of power generation and treatment efficiency under different operating conditions. It would also be useful for MFC modelling to help better understand the technology. Building a truly tenable MFC system can be achievable with auxetic material as an anode and chassis. Future work needs to seek suitable materials for electrode and chassis.
Author Contributions: Conceptualization, J.G. and I.I.; Formal analysis, J.Y.; Funding acquisition, I.I.; Investigation, J.Y.; Methodology, J.Y. and J.G.; Project administration, J.Y.; Visualization, J.Y.; Writing—original draft, J.Y.; Writing—review & editing, J.G. and I.I.
Funding:This research was funded by the Engineering and Physical Sciences Research Council (EPSRC) UK, grant number EP/N005740/1. The APC was funded by the Research Councils UK (RCUK) Open Access Block Grant, available through the University of the West of England, Bristol.
Energies2018,11, 2377 11 of 12
References
1. Kadier, A.; Simayi, Y.; Abdeshahian, P.; Azman, N.F.; Chandrasekhar, K.; Kalil, M.S. A comprehensive review of microbial electrolysis cells (MEC) reactor designs and configurations for sustainable hydrogen gas production.Alexandria Eng. J.2016,55, 427–443. [CrossRef]
2. Escapa, A.; Mateos, R.; Martínez, E.J.; Blanes, J. Microbial electrolysis cells: An emerging technology for wastewater treatment and energy recovery. From laboratory to pilot plant and beyond.Renew. Sustain.
Energy Rev.2016,55, 942–956. [CrossRef]
3. Jiang, Y.; Su, M.; Zhang, Y.; Zhan, G.; Tao, Y.; Li, D. Bioelectrochemical systems for simultaneously production of methane and acetate from carbon dioxide at relatively high rate.Int. J. Hydrogen Energy2013,38, 3497–3502. [CrossRef]
4. Xafenias, N.; Mapelli, V. Performance and bacterial enrichment of bioelectrochemical systems during methane and acetate production.Int. J. Hydrogen Energy2014,39, 21864–21875. [CrossRef]
5. Villano, M.; Monaco, G.; Aulenta, F.; Majone, M. Electrochemically assisted methane production in a biofilm reactor.J. Power Sources2011,196, 9467–9472. [CrossRef]
6. Babanova, S.; Carpenter, K.; Phadke, S.; Suzuki, S.; Ishii, S.; Phan, T.; Grossi-Soyster, E.; Flynn, M.; Hogan, J.; Bretschger, O. The Effect of Membrane Type on the Performance of Microbial Electrosynthesis Cells for Methane Production.J. Electrochem. Soc.2017,164, H3015–H3023. [CrossRef]
7. Carmalin Sophia, A.; Bhalambaal, V.M.; Lima, E.C.; Thirunavoukkarasu, M. Microbial desalination cell technology: Contribution to sustainable waste water treatment process, current status and future applications.
J. Environ. Chem. Eng.2016,4, 3468–3478. [CrossRef]
8. Al-Mamun, A.; Ahmad, W.; Baawain, M.S.; Khadem, M.; Dhar, B.R. A review of microbial desalination cell technology: Configurations, optimization and applications.J. Clean. Prod.2018,183, 458–480. [CrossRef] 9. Gajda, I.; Greenman, J.; Melhuish, C.; Santoro, C.; Li, B.; Cristiani, P.; Ieropoulos, I. Electro-osmotic-based
catholyte production by Microbial Fuel Cells for carbon capture.Water Res.2015,86, 108–115. [CrossRef] [PubMed]
10. You, J.; Greenman, J.; Melhuish, C.; Ieropoulos, I. Electricity generation and struvite recovery from human urine using microbial fuel cells.J. Chem. Technol. Biotechnol.2016,91. [CrossRef]
11. Xiao, Y.; Zheng, Y.; Wu, S.; Yang, Z.-H.; Zhao, F. Nitrogen recovery from wastewater using microbial fuel cells.Front. Environ. Sci. Eng.2016,10, 185–191. [CrossRef]
12. Brunelli, D.; Tosato, P.; Rossi, M. Microbial fuel cell as a biosensor and a power source for flora health monitoring. In Proceedings of the 2016 IEEE Sensors, Orlando, FL, USA, 30 October–3 November 2016; pp. 1–3.
13. Chouler, J.; Cruz-Izquierdo,Á.; Rengaraj, S.; Scott, J.L.; Di Lorenzo, M. A screen-printed paper microbial fuel cell biosensor for detection of toxic compounds in water.Biosens. Bioelectron.2018,102, 49–56. [CrossRef] [PubMed]
14. Greenman, J.; Ieropoulos, I.; McKenzie, C.; Melhuish, C. Microbial computing using Geobacter electrodes: output stability and consistency.Int. J. Unconv. Comput.2006,2, 249–265.
15. Greenman, J.; Ieropoulos, I.; Melhuish, C. Biological computing using perfusion anodophile biofilm electrodes (PABE).Int. J. Unconv. Comput.2008,4, 23–32.
16. Tsompanas, M.-A.I.; Adamatzky, A.; Sirakoulis, G.C.; Greenman, J.; Ieropoulos, I. Towards implementation of cellular automata in Microbial Fuel Cells.PLOS ONE2017,12, e0177528. [CrossRef] [PubMed]
17. Ledezma, P.; Greenman, J.; Ieropoulos, I. Maximising electricity production by controlling the biofilm specific growth rate in microbial fuel cells.Bioresour. Technol.2012,118, 615–618. [CrossRef] [PubMed]
18. You, J.; Walter, X.A.; Greenman, J.; Melhuish, C.; Ieropoulos, I. Stability and reliability of anodic biofilms under different feedstock conditions: Towards microbial fuel cell sensors.Sens. Bio-Sensing Res. 2015,6, 43–50. [CrossRef]
19. Winfield, J.; Ieropoulos, I.; Greenman, J. Investigating a cascade of seven hydraulically connected microbial fuel cells.Bioresour. Technol.2012,110, 245–250. [CrossRef] [PubMed]
20. Eaton, A.D.; Clesceri, L.S.; Greenberg, A.E.; Franson, M.A.H.Standard Methods for the Examination of Water
and Wastewater; American Public Health Association: Washington, DC, USA, 1995.
Energies2018,11, 2377 12 of 12
22. Ahn, Y.; Hatzell, M.C.; Zhang, F.; Logan, B.E. Different electrode configurations to optimize performance of multi- electrode microbial fuel cells for generating power or treating domestic wastewater.J. Power Sources 2014. [CrossRef]
23. Juang, D.F.; Yang, P.C.; Kuo, T.H. Effects of flow rate and chemical oxygen demand removal characteristics on power generation performance of microbial fuel cells. Int. J. Environ. Sci. Technol. 2012,9, 267–280. [CrossRef]
24. You, S.J.; Zhao, Q.L.; Jiang, J.Q.; Zhang, J.N. Treatment of domestic wastewater with simultaneous electricity generation in microbial fuel cell under continuous operation.Chem. Biochem. Eng. Q.2006,20, 407–412. 25. Papaharalabos, G.; Greenman, J.; Melhuish, C.; Ieropoulos, I. A novel small scale Microbial Fuel Cell design
for increased electricity generation and waste water treatment.Int. J. Hydrogen Energy2015,40, 4263–4268. [CrossRef]
26. Greenman, J.; Ieropoulos, I.A. Allometric scaling of microbial fuel cells and stacks: The lifeform case for scale-up.J. Power Sources2017,356, 365–370. [CrossRef]