Diaqua(2,5-di-4-pyridyl-1,3,4-thia-diazole-
j
N
2)bis(thiocyanato-
j
N
)-nickel(II) dihydrate
Ming-Hua Yang
Department of Chemistry, Lishui University, Lishui 323000, People’s Republic of China
Correspondence e-mail: zjlsxyhx@126.com
Received 19 September 2008; accepted 22 September 2008
Key indicators: single-crystal X-ray study;T= 298 K; mean(C–C) = 0.007 A˚; Rfactor = 0.055;wRfactor = 0.143; data-to-parameter ratio = 13.4.
In the title mononuclear complex, [Ni(NCS)2(C12H8N4S)2
-(H2O)2]2H2O, the Ni II
atom is located on an inversion center and is octahedrally coordinated by four N atoms from two 2,5-di-4-pyridyl-1,3,4-thiadiazole (bpt) ligands and two thio-cyanate molecules forming the equatorial plane; the axial positions are occupied by two O atoms of coordinated water molecules. O—H O, O—H N and O—H S hydrogen bonds, involving the uncoordinated water molecules, result in the formation of a sheet structure developing parallel to (021).
Related literature
For related structures, see: Ma & Yang (2008); Duet al.(2002); Dong et al. (2003); Gudbjarlson et al. (1991). For related literature, see: Suet al.(2005).
Experimental
Crystal data
[Ni(NCS)2(C12H8N4S)2(H2O)2] -2H2O
Mr= 727.50 Triclinic,P1
a= 7.0555 (11) A˚
b= 8.3034 (13) A˚
c= 14.849 (2) A˚
= 93.067 (2)
= 112.228 (2) V= 768.3 (2) A˚3
Z= 1
MoKradiation
= 0.95 mm1
T= 298 (2) K
Bruker SMART diffractometer Absorption correction: multi-scan
(SADABS; Sheldrick, 1996)
Tmin= 0.789,Tmax= 0.855
3967 measured reflections 2747 independent reflections 1810 reflections withI> 2(I)
Rint= 0.028
Refinement
R[F2> 2(F2)] = 0.055
wR(F2) = 0.143
S= 1.06 2747 reflections
205 parameters
H-atom parameters constrained
max= 0.39 e A˚
3
min=0.51 e A˚
3
Table 1
Hydrogen-bond geometry (A˚ ,).
D—H A D—H H A D A D—H A
O1W—H1WB O2W 0.85 1.91 2.762 (5) 175 O2W—H2WB N4i
0.85 2.00 2.833 (5) 170 O1W—H1WA S2ii 0.85 2.47 3.303 (3) 166 O2W—H2WA S2iii
0.85 2.92 3.540 (4) 132
Symmetry codes: (i)xþ1;y;z1; (ii)x1;y;z; (iii)xþ1;y;zþ1.
Data collection:SMART(Bruker, 1998); cell refinement:SAINT (Bruker, 1999); data reduction:SAINT; program(s) used to solve structure:SHELXS97(Sheldrick, 2008); program(s) used to refine structure: SHELXL97 (Sheldrick, 2008); molecular graphics: ORTEPIII (Burnett & Johnson, 1996), ORTEP-3 for Windows (Farrugia, 1997) andCAMERON(Pearceet al., 2000); software used to prepare material for publication:SHELXL97.
The author is grateful to the Natural Science Foundation of Zhejiang Province (No. Y407081) for financial support.
Supplementary data and figures for this paper are available from the IUCr electronic archives (Reference: DN2378).
References
Bruker (1998).SMART. Bruker AXS Inc, Madison, Wisconsin, USA. Bruker (1999).SAINT. Bruker AXS Inc., Madison, Wisconsin, USA. Burnett, M. N. & Johnson, C. K. (1996).ORTEPIII. Report ORNL-6895. Oak
Ridge National Laboratory, Tennessee, USA.
Dong, Y.-B., Cheng, J.-Y., Huang, R.-Q., Smith, M. D. & zur Loye, H.-C. (2003).Inorg. Chem.42, 5699–5706.
Du, M., Bu, X.-H., Guo, Y.-M., Liu, H., Batten, S. R., Ribas, J. & Mak, T. C. W. (2002).Inorg. Chem.41, 4904–4908.
Farrugia, L. J. (1997).J. Appl. Cryst.30, 565.
Gudbjartson, H., Biradha, K., Poirier, K. M. & Zaworotko, M. J. (1991).J. Am. Chem. Soc.121, 2599–2600.
Ma, W.-W. & Yang, M.-H. (2008).Acta Cryst.E64, m630.
Pearce, L., Prout, C. K. & Watkin, D. J. (2000). CAMERON. Chemical Crystallography Laboratory, University of Oxford, England.
Sheldrick, G. M. (1996).SADABS. University of Go¨ttingen, Germany. Sheldrick, G. M. (2008).Acta Cryst.A64, 112–122.
Su, C.-Y., Zheng, X.-J., Gao, S., Li, L.-C. & Jin, L.-P. (2005).Eur. J. Inorg. Chem.pp. 4150–4159.
Structure Reports
Online
supporting information
Acta Cryst. (2008). E64, m1331 [doi:10.1107/S1600536808030444]
Diaqua(2,5-di-4-pyridyl-1,3,4-thiadiazole-
κ
N
2)bis(thiocyanato-
κ
N
)nickel(II)
dihydrate
Ming-Hua Yang
S1. Comment
In the last decades, different kinds of metal-organic frameworks (MOFs) have been synthesized by using linear 4,4′-bi-pyridine, and other bipyridine-like N,N′-donor ligands (Gudbjarlson et al., 1991; Su et al. 2005; Dong et al., 2003). However, the angular N,N′-ligands were less exploited in building the MOFs in the supramolecular chemistry (Du et al., 2002). In this paper, we report the synthesis and characterization of the title compound (I).
the nickel(II) atom located on an inversion center is octahedrally coordinated by four N atoms from two bpt ligands and two thiocyanate molecules forming the equatorial plane, whereas axial positions are occupied by two O atoms of
coordinated water molecules (Fig.1). The Ni—N distances are similar with related complexes (Du et al., 2002; Ma & Yang, 2008).
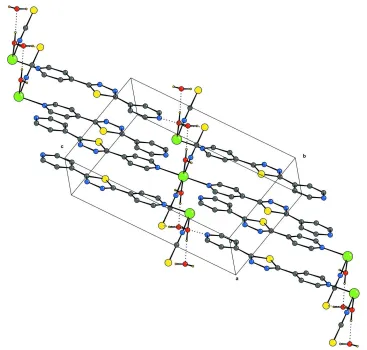
The occurence of O-H···O, O-H···N and O-H···S results in the formation of a two-dimensional sheet structure developping parallel to the (0 2 1) plane (Table 1, Fig.2). The guest water molecule acts as acceptor and donor.
S2. Experimental
Bpt (21 mg,0.6 mmol), NiCl2 (28 mg, 0.9 mmol) and NH4SCN (23 mg,0.8 mmol) were added in methanol. The mixture was heated for one hour under refluxing and stirring. The resulting solution was then cooled to room temperature, and some single crystals were obtained five weeks later.
S3. Refinement
Figure 1
The ORTEP plot of (I), showing the atom-labeling scheme. Displacement ellipsoids are drawn at the 30% probability level. H atoms are represented as small sphere of arbitrary radii. H bond is shown as dashed line. [Symmetry code: (i)
Figure 2
A partial packing view showing the formation of the two dimensional sheet through O-H···O, O-H···N and O-H···S hydro-gren bonds. H bonds are represented as dashed lines. H atoms not involved in hydrogen bondings have been omitted for clarity.
Diaqua(2,5-di-4-pyridyl-1,3,4-thiadiazole-κN2)bis(thiocyanato-κN)nickel(II) dihydrate
Crystal data
[Ni(NCS)2(C12H8N4S)2(H2O)2]·2H2O Mr = 727.50
Triclinic, P1 Hall symbol: -P 1
a = 7.0555 (11) Å
b = 8.3034 (13) Å
c = 14.849 (2) Å
α = 104.629 (2)°
β = 93.067 (2)°
γ = 112.228 (2)°
V = 768.3 (2) Å3
Z = 1
F(000) = 374
Dx = 1.572 Mg m−3
Mo Kα radiation, λ = 0.71073 Å Cell parameters from 2721 reflections
θ = 1.4–25.2°
µ = 0.96 mm−1 T = 298 K Block, green
Bruker SMART diffractometer
Radiation source: fine-focus sealed tube Graphite monochromator
φ and ω scans
Absorption correction: multi-scan (SADABS; Sheldrick, 1996)
Tmin = 0.789, Tmax = 0.855
3967 measured reflections 2747 independent reflections 1810 reflections with I > 2σ(I)
Rint = 0.028
θmax = 25.3°, θmin = 1.4° h = −8→5
k = −9→9
l = −17→17
Refinement
Refinement on F2
Least-squares matrix: full
R[F2 > 2σ(F2)] = 0.055 wR(F2) = 0.143 S = 1.06 2747 reflections 205 parameters 0 restraints
Primary atom site location: structure-invariant direct methods
Secondary atom site location: difference Fourier map
Hydrogen site location: inferred from neighbouring sites
H-atom parameters constrained
w = 1/[σ2(F
o2) + (0.0643P)2 + 0.1149P]
where P = (Fo2 + 2Fc2)/3
(Δ/σ)max < 0.001
Δρmax = 0.39 e Å−3
Δρmin = −0.51 e Å−3
Special details
Geometry. All esds (except the esd in the dihedral angle between two l.s. planes) are estimated using the full covariance matrix. The cell esds are taken into account individually in the estimation of esds in distances, angles and torsion angles; correlations between esds in cell parameters are only used when they are defined by crystal symmetry. An approximate (isotropic) treatment of cell esds is used for estimating esds involving l.s. planes.
Refinement. Refinement of F2 against ALL reflections. The weighted R-factor wR and goodness of fit S are based on F2,
conventional R-factors R are based on F, with F set to zero for negative F2. The threshold expression of F2 > σ(F2) is used
only for calculating R-factors(gt) etc. and is not relevant to the choice of reflections for refinement. R-factors based on F2
are statistically about twice as large as those based on F, and R- factors based on ALL data will be even larger.
Fractional atomic coordinates and isotropic or equivalent isotropic displacement parameters (Å2)
x y z Uiso*/Ueq
Ni1 0.5000 0.5000 0.5000 0.0397 (3)
S1 −0.0367 (2) 0.2796 (2) 0.90422 (9) 0.0507 (4) S2 0.7893 (2) 0.05582 (18) 0.46356 (10) 0.0499 (4) N1 0.4008 (5) 0.4385 (5) 0.6282 (3) 0.0370 (9) N2 0.3264 (6) 0.2926 (6) 0.9413 (3) 0.0507 (11) N3 0.2307 (7) 0.2566 (6) 1.0167 (3) 0.0512 (11) N4 −0.3536 (7) 0.1274 (6) 1.2103 (3) 0.0530 (11) N5 0.6832 (6) 0.3540 (6) 0.4939 (3) 0.0439 (10) O1W 0.2492 (4) 0.2685 (4) 0.4104 (2) 0.0456 (8)
H1WA 0.1300 0.2324 0.4268 0.068*
H1WB 0.2655 0.1751 0.3792 0.068*
C1 0.2114 (7) 0.4119 (6) 0.6465 (3) 0.0448 (12)
H1 0.1217 0.4267 0.6042 0.054*
C4 0.4712 (8) 0.3790 (7) 0.7725 (3) 0.0490 (13)
H4 0.5656 0.3697 0.8149 0.059*
C5 0.5267 (7) 0.4217 (7) 0.6915 (3) 0.0454 (12)
H5 0.6606 0.4399 0.6803 0.054*
C6 0.2059 (7) 0.3069 (6) 0.8769 (3) 0.0408 (12) C7 0.0422 (8) 0.2485 (7) 1.0080 (3) 0.0435 (12) C8 −0.0933 (7) 0.2144 (6) 1.0799 (3) 0.0395 (11) C9 −0.0247 (8) 0.1812 (7) 1.1595 (3) 0.0514 (13)
H9 0.1090 0.1867 1.1704 0.062*
C10 −0.1584 (8) 0.1398 (8) 1.2222 (4) 0.0573 (15)
H10 −0.1108 0.1191 1.2760 0.069*
C11 −0.4142 (8) 0.1632 (7) 1.1355 (4) 0.0516 (13)
H11 −0.5477 0.1593 1.1273 0.062*
C12 −0.2923 (7) 0.2065 (7) 1.0682 (3) 0.0459 (12)
H12 −0.3433 0.2298 1.0160 0.055*
C13 0.7270 (6) 0.2306 (7) 0.4811 (3) 0.0366 (11) O2W 0.3283 (5) −0.0225 (5) 0.3113 (2) 0.0604 (10)
H2WA 0.3641 −0.0509 0.3583 0.091*
H2WB 0.4342 0.0242 0.2871 0.091*
Atomic displacement parameters (Å2)
U11 U22 U33 U12 U13 U23
Ni1—N5 2.072 (4) C1—H1 0.9300
Ni1—N5i 2.072 (4) C2—C3 1.371 (6)
Ni1—O1Wi 2.116 (3) C2—H2 0.9300
Ni1—O1W 2.116 (3) C3—C4 1.385 (6)
Ni1—N1 2.176 (4) C3—C6 1.481 (6)
Ni1—N1i 2.176 (4) C4—C5 1.374 (6)
S1—C7 1.723 (5) C4—H4 0.9300
S1—C6 1.724 (5) C5—H5 0.9300
S2—C13 1.635 (5) C7—C8 1.480 (6)
N1—C1 1.325 (6) C8—C12 1.380 (6)
N1—C5 1.328 (6) C8—C9 1.383 (6)
N2—C6 1.304 (6) C9—C10 1.373 (7)
N2—N3 1.376 (5) C9—H9 0.9300
N3—C7 1.303 (6) C10—H10 0.9300
N4—C11 1.310 (6) C11—C12 1.382 (7)
N4—C10 1.340 (6) C11—H11 0.9300
N5—C13 1.153 (6) C12—H12 0.9300
O1W—H1WA 0.8510 O2W—H2WA 0.8456
O1W—H1WB 0.8497 O2W—H2WB 0.8472
C1—C2 1.371 (6)
N5—Ni1—N5i 180.000 (2) C2—C3—C4 117.8 (4)
N5—Ni1—O1Wi 88.99 (14) C2—C3—C6 121.6 (4)
N5i—Ni1—O1Wi 91.01 (14) C4—C3—C6 120.5 (4)
N5—Ni1—O1W 91.01 (14) C5—C4—C3 118.6 (4) N5i—Ni1—O1W 88.99 (14) C5—C4—H4 120.7
O1Wi—Ni1—O1W 180.0 C3—C4—H4 120.7
N5—Ni1—N1 91.17 (14) N1—C5—C4 124.0 (4) N5i—Ni1—N1 88.83 (14) N1—C5—H5 118.0
O1Wi—Ni1—N1 86.52 (12) C4—C5—H5 118.0
O1W—Ni1—N1 93.48 (13) N2—C6—C3 123.7 (4) N5—Ni1—N1i 88.83 (14) N2—C6—S1 113.8 (3)
N5i—Ni1—N1i 91.17 (14) C3—C6—S1 122.4 (4)
O1Wi—Ni1—N1i 93.48 (13) N3—C7—C8 123.5 (4)
O1W—Ni1—N1i 86.52 (12) N3—C7—S1 113.8 (3)
N1—Ni1—N1i 180.000 (1) C8—C7—S1 122.7 (4)
C7—S1—C6 87.2 (2) C12—C8—C9 118.1 (4)
C1—N1—C5 116.3 (4) C12—C8—C7 121.8 (4) C1—N1—Ni1 122.2 (3) C9—C8—C7 119.9 (4) C5—N1—Ni1 121.4 (3) C10—C9—C8 118.5 (5)
C6—N2—N3 112.5 (4) C10—C9—H9 120.7
C7—N3—N2 112.7 (4) C8—C9—H9 120.7
C11—N4—C10 116.8 (4) N4—C10—C9 123.8 (5) C13—N5—Ni1 159.3 (4) N4—C10—H10 118.1
H1WA—O1W—H1WB 107.7 N4—C11—H11 117.9
N1—C1—C2 124.1 (4) C12—C11—H11 117.9
N1—C1—H1 118.0 C8—C12—C11 118.6 (4)
C2—C1—H1 118.0 C8—C12—H12 120.7
C1—C2—C3 119.1 (5) C11—C12—H12 120.7
C1—C2—H2 120.5 N5—C13—S2 179.7 (4)
C3—C2—H2 120.5 H2WA—O2W—H2WB 109.2
Symmetry code: (i) −x+1, −y+1, −z+1.
Hydrogen-bond geometry (Å, º)
D—H···A D—H H···A D···A D—H···A
O1W—H1WB···O2W 0.85 1.91 2.762 (5) 175 O2W—H2WB···N4ii 0.85 2.00 2.833 (5) 170
O1W—H1WA···S2iii 0.85 2.47 3.303 (3) 166
O2W—H2WA···S2iv 0.85 2.92 3.540 (4) 132