2,4,6-Trifluoroaniline
Richard Betz and Peter Klu¨fers*
Ludwig-Maximilians Universita¨t, Department Chemie und Biochemie, Butenandt-strasse 5–13 (Haus D), 81377 Mu¨nchen, Germany
Correspondence e-mail: [email protected]
Received 10 September 2008; accepted 28 October 2008
Key indicators: single-crystal X-ray study;T= 200 K; mean(C–C) = 0.003 A˚;
Rfactor = 0.034;wRfactor = 0.082; data-to-parameter ratio = 8.5.
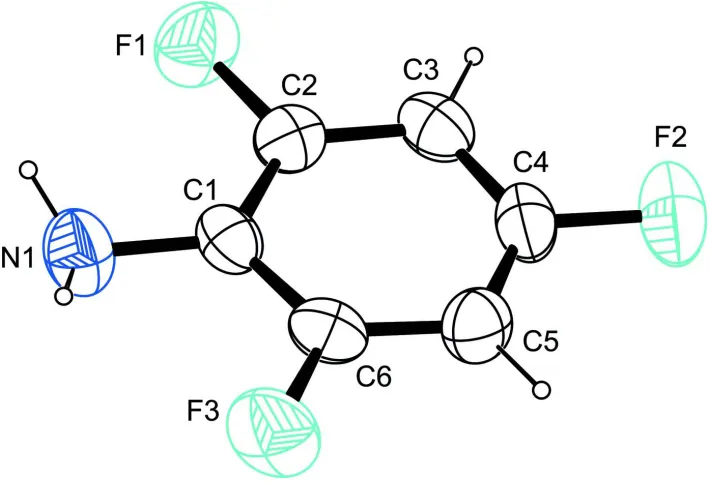
The title compound, C6H4F3N, is a fluoro derivative of aniline. The molecule shows non-crystallographic mirror symmetry. Bond lengths are normal. The C—C—C angles show some deviation from the expected ideal values by up to 5, a finding which is in accordance with a similar structure in the literature. In the crystal structure H F contacts and H N contacts lead to the formation of sheets whose surfaces are made up by the hydrophobic phenyl rings.
Related literature
For the crystal structure of a related compound, see: Gdaniec (2007). For graph-set analysis, see: Bernstein et al. (1995); Etteret al.(1990).
Experimental
Crystal data
c= 3.8545 (5) A˚ V= 604.14 (11) A˚3 Z= 4
= 0.16 mm T= 200 (2) K 0.500.090.05 mm
Data collection
Oxford Diffraction KappaCCD diffractometer
Absorption correction: multi-scan (SCALE3 ABSPACK inCrysAlis RED; Oxford Diffraction, 2005)) Tmin= 0.921,Tmax= 0.992
4517 measured reflections 775 independent reflections 489 reflections withI> 2(I) Rint= 0.034
Refinement
R[F2> 2(F2)] = 0.034 wR(F2) = 0.082 S= 0.94 775 reflections
91 parameters
H-atom parameters constrained max= 0.13 e A˚3
min=0.16 e A˚3
Table 1
Hydrogen-bond geometry (A˚ ,).
D—H A D—H H A D A D—H A
N1—H71 N1i
0.90 2.26 3.110 (3) 157
N1—H72 F3ii
0.88 2.31 3.086 (2) 147
Symmetry codes: (i)xþ3 2;y;z
1 2; (ii)xþ
1 2;y;z
1 2.
Data collection: CrysAlis CCD (Oxford Diffraction, 2005); cell refinement: CrysAlis RED (Oxford Diffraction, 2005); data reduc-tion:CrysAlis RED; program(s) used to solve structure:SHELXS97 (Sheldrick, 2008); program(s) used to refine structure:SHELXL97 (Sheldrick, 2008); molecular graphics: ORTEPIII (Burnett & Johnson, 1996) andMercury(Macraeet al., 2006); software used to prepare material for publication:SHELXL97.
The authors thank Dr Peter Mayer for professional support.
Supplementary data and figures for this paper are available from the IUCr electronic archives (Reference: RN2051).
References
Bernstein, J., Davis, R. E., Shimoni, L. & Chang, N.-L. (1995).Angew. Chem. Int. Ed. Engl.34, 1555–1573.
Burnett, M. N. & Johnson, C. K. (1996).ORTEPIII. Report ORNL-6895. Oak Ridge National Laboratory, Tennessee, USA.
Etter, M. C., MacDonald, J. C. & Bernstein, J. (1990).Acta Cryst.B46, 256–262. Gdaniec, M. (2007).Acta Cryst.E63, o2954.
Macrae, C. F., Edgington, P. R., McCabe, P., Pidcock, E., Shields, G. P., Taylor, R., Towler, M. & van de Streek, J. (2006).J. Appl. Cryst.39, 453–457. Oxford Diffraction (2005). CrysAlis CCD and CrysAlis RED. Oxford
Diffraction Ltd, Abingdon,England. Structure Reports
Online
supporting information
supporting information
Acta Cryst. (2008). E64, o2242 [doi:10.1107/S1600536808035083]
2,4,6-Trifluoroaniline
Richard Betz and Peter Kl
ü
fers
S1. Comment
In a program focused on the synthesis of derivatives of phenylarsonic acid a number of substituted aniline-derivatives
were chosen as starting materials. In order to compare the influence of an arsonic group on the geometry of these starting
materials, the crystal structure of 2,4,6-trifluoroaniline was elucidated by means of single-crystal X-ray diffraction.
In the molecule (Fig. 1) the C–C–C angles deviate from the expected ideal value of 120° by up to 5°. Angles bigger than
the expected value are invariably found at C atoms bonded to fluorine, the smallest angle being present on the C atom
bearing the amino group. This finding is in agreement with the situation observed in 2,3,4,5,6-pentafluoroaniline
(Gdaniec, 2007).
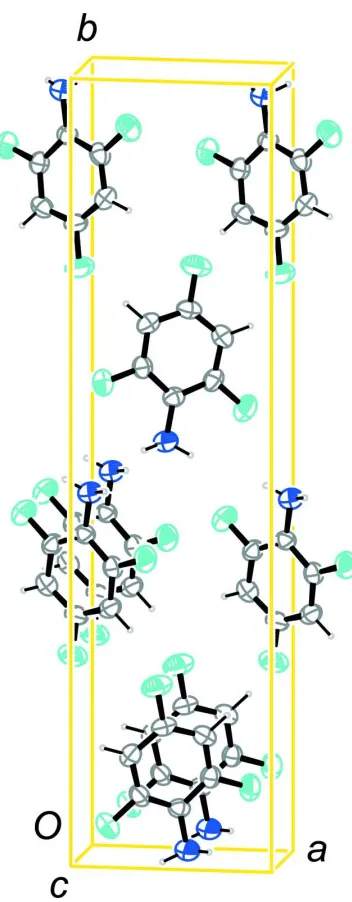
In the crystal structure hydrogen bonds between fluorine and the amino group are present. If contacts whose ranges fall
0.2Å below the sum of van der Waals radii of the respective atoms are taken into consideration, only one of the F atoms
in ortho position to the amino group is participating in these intermolecular interactions. These connect the molecules
into sheets parallel to [1 0 1]. The surfaces of these sheets are made up by the aromatic moieties (Fig. 2 and Fig. 3). In
terms of graph-set analysis (Etter et al., 1990; Bernstein et al., 1995) the N–H···F pattern should be assigned a C(5)
descriptor on the unitary level while the remaining H atom on nitrogen participates in a cooperative chain of hydrogen
bonds (N–H···N).
S2. Experimental
The compound was obtained commercially from Fluorochem. Crystals suitable for X-ray diffraction studies were
obtained upon cooling the compound to 4 °C in a fridge.
S3. Refinement
All H atoms were located in a difference map and refined as riding on their parent atoms with Uiso(H) values of 1.2 Ueq(C)
and 1.2 Ueq(N).
Due to the absence of a significant anomalous scatterer in the molecule, the Flack parameter is meaningless. Friedel
Figure 1
The molecular structure of the title compound, with atom labels and anisotropic displacement ellipsoids (drawn at 50%
supporting information
Figure 2
Figure 3
Intermolecular interactions in the crystal structure of the title compound, viewed along [0 0 1]. Symmetry operators: i -x
+ 3/2, -y, z - 1/2; ii -x + 1/2, -y, z - 1/2.
2,4,6-Trifluoroaniline
Crystal data
C6H4F3N
Mr = 147.10
Orthorhombic, P212121 Hall symbol: P 2ac 2ab
a = 6.3220 (6) Å
b = 24.792 (2) Å
c = 3.8545 (5) Å
V = 604.14 (11) Å3
Z = 4
F(000) = 296
Dx = 1.617 Mg m−3
Mo Kα radiation, λ = 0.71073 Å Cell parameters from 1719 reflections
θ = 4.1–26.3°
µ = 0.16 mm−1
T = 200 K Rod, colourless 0.50 × 0.09 × 0.05 mm
Data collection
Oxford Diffraction KappaCCD diffractometer
Radiation source: fine-focus sealed tube Graphite monochromator
ω scans
Absorption correction: multi-scan
4517 measured reflections 775 independent reflections 489 reflections with I > 2σ(I)
Rint = 0.034
θmax = 26.4°, θmin = 4.1°
supporting information
Hydrogen site location: difference Fourier map H-atom parameters constrained
w = 1/[σ2(F
o2) + (0.0505P)2] where P = (Fo2 + 2Fc2)/3
(Δ/σ)max < 0.001 Δρmax = 0.13 e Å−3 Δρmin = −0.16 e Å−3
Fractional atomic coordinates and isotropic or equivalent isotropic displacement parameters (Å2)
x y z Uiso*/Ueq
F1 0.8818 (2) 0.10411 (5) −0.1028 (5) 0.0618 (5) F2 0.4694 (2) 0.24248 (5) 0.3783 (5) 0.0712 (6) F3 0.2254 (2) 0.06360 (6) 0.3828 (5) 0.0715 (6) N1 0.5886 (3) 0.02701 (7) 0.0726 (7) 0.0564 (7) H71 0.6769 0.0202 −0.1054 0.068* H72 0.4647 0.0109 0.0632 0.068* C1 0.5551 (4) 0.08172 (8) 0.1384 (7) 0.0398 (6) C2 0.7034 (4) 0.12061 (9) 0.0624 (7) 0.0414 (6) C3 0.6805 (4) 0.17436 (8) 0.1376 (7) 0.0447 (7) H3 0.7868 0.2000 0.0811 0.054* C4 0.4963 (4) 0.18920 (8) 0.2983 (7) 0.0451 (7) C5 0.3394 (4) 0.15382 (8) 0.3828 (8) 0.0480 (7) H5 0.2124 0.1652 0.4922 0.058* C6 0.3757 (4) 0.10062 (9) 0.3004 (7) 0.0444 (7)
Atomic displacement parameters (Å2)
U11 U22 U33 U12 U13 U23
F1 0.0434 (9) 0.0688 (9) 0.0731 (11) 0.0014 (7) 0.0104 (9) −0.0040 (10) F2 0.0870 (11) 0.0420 (8) 0.0845 (14) 0.0118 (8) −0.0120 (14) −0.0085 (10) F3 0.0534 (9) 0.0641 (9) 0.0969 (14) −0.0156 (7) 0.0105 (12) 0.0123 (10) N1 0.0574 (14) 0.0408 (11) 0.0712 (18) −0.0029 (10) −0.0014 (15) −0.0017 (12) C1 0.0441 (13) 0.0354 (12) 0.0397 (16) −0.0004 (10) −0.0070 (14) 0.0045 (12) C2 0.0379 (13) 0.0476 (14) 0.0386 (16) 0.0022 (11) −0.0023 (13) 0.0011 (13) C3 0.0503 (17) 0.0412 (14) 0.0426 (17) −0.0103 (11) −0.0064 (16) 0.0057 (14) C4 0.0573 (16) 0.0326 (12) 0.0453 (17) 0.0063 (12) −0.0101 (16) −0.0018 (12) C5 0.0445 (16) 0.0496 (14) 0.0499 (17) 0.0094 (12) 0.0004 (16) 0.0009 (16) C6 0.0408 (13) 0.0473 (14) 0.0453 (19) −0.0087 (12) 0.0001 (14) 0.0094 (13)
Geometric parameters (Å, º)
F1—C2 1.358 (3) C1—C6 1.377 (3) F2—C4 1.367 (2) C2—C3 1.371 (3) F3—C6 1.359 (2) C3—C4 1.369 (4) N1—C1 1.396 (3) C3—H3 0.9500 N1—H71 0.9009 C4—C5 1.364 (3) N1—H72 0.8798 C5—C6 1.376 (3) C1—C2 1.377 (3) C5—H5 0.9500
C2—C1—C6 114.8 (2) F2—C4—C3 117.9 (2) C2—C1—N1 122.6 (2) C4—C5—C6 116.1 (2) C6—C1—N1 122.5 (2) C4—C5—H5 121.9 F1—C2—C3 118.7 (2) C6—C5—H5 121.9 F1—C2—C1 117.04 (19) F3—C6—C5 118.5 (2) C3—C2—C1 124.3 (2) F3—C6—C1 116.9 (2) C4—C3—C2 116.5 (2) C5—C6—C1 124.6 (2) C4—C3—H3 121.7
C6—C1—C2—F1 −178.9 (2) F2—C4—C5—C6 −179.2 (2) N1—C1—C2—F1 4.2 (4) C3—C4—C5—C6 0.7 (4) C6—C1—C2—C3 0.0 (4) C4—C5—C6—F3 179.2 (3) N1—C1—C2—C3 −176.9 (3) C4—C5—C6—C1 −0.8 (4) F1—C2—C3—C4 178.8 (2) C2—C1—C6—F3 −179.5 (2) C1—C2—C3—C4 −0.1 (4) N1—C1—C6—F3 −2.7 (4) C2—C3—C4—C5 −0.2 (4) C2—C1—C6—C5 0.5 (4) C2—C3—C4—F2 179.6 (2) N1—C1—C6—C5 177.3 (3)
Hydrogen-bond geometry (Å, º)
D—H···A D—H H···A D···A D—H···A
N1—H71···N1i 0.90 2.26 3.110 (3) 157 N1—H72···F3ii 0.88 2.31 3.086 (2) 147
![Figure 3Intermolecular interactions in the crystal structure of the title compound, viewed along [0 0 1]](https://thumb-us.123doks.com/thumbv2/123dok_us/621250.562726/5.610.132.479.72.290/figure-intermolecular-interactions-crystal-structure-title-compound-viewed.webp)
