Measuring site fidelity and spatial segregation within
animal societies
Thomas O. Richardson*
,1,2, Luca Giuggioli
3,4,5, Nigel R. Franks
5and Ana B. Sendova-Franks
2 1Department of Ecology and Evolution, University of Lausanne, Lausanne, Switzerland;2Department of Engineering Designand Mathematics, University of the West of England, Bristol, UK;3Bristol Centre for Complexity Sciences, University of Bristol, Bristol, UK;4Department of Engineering Mathematics, University of Bristol, Bristol, UK; and5School of Biological Sciences, University of Bristol, Bristol, UK
Summary
1. Animals often display a marked tendency to return to previously visited locations that contain important resources, such as water, food, or developing brood that must be provisioned. A considerable body of work has demonstrated that this tendency is strongly expressed in ants, which exhibit fidelity to particular sites both inside and outside the nest. However, thus far many studies of this phenomena have taken the approach of reducing an animal’s trajectory to a summary statistic, such as the area it covers.
2. Using both simulations of biased random walks, and empirical trajectories from individual rock ants, Temnothorax albipennis, we demonstrate that this reductive approach suffers from an unacceptably high rate of false negatives.
3. To overcome this, we describe a site-centric approach which, in combination with a spatially-explicit null model, allows the identification of the important sites towards which individuals exhibit statistically significant biases.
4. Using the ant trajectories, we illustrate how the site-centric approach can be combined with social network analysis tools to detect groups of individuals whose members display similar space-use patterns.
5. We also address the mechanistic origin of individual site fidelity; by examining the sequence of visits to each site, we detect a statistical signature associated with a self-attracting walk–a non-Markovian movement model that has been suggested as a possible mechanism for generating individual site fidelity.
Key-words: animal movement, ant, non-Markov, random walk, social network, social insect, Temnothorax albipennis
Introduction
The phenomenon of ‘recurrence’, in which the movement of an individual is biased towards a set of previously visited loca-tions, is widespread in the animal kingdom (Gonzalez, Hidalgo & Barabasi 2008; Boyer, Crofoot & Walsh 2011; Schreier & Grove 2014). Recent work comparing the mobility patterns of humans and vervet monkeys has shown that recurrence is a fundamental statistical property common to both (Boyer, Cro-foot & Walsh 2011). In humans, examples of important loca-tions at which recurrence is most strongly expressed include homes, workplaces, restaurants and the transit routes that con-nect them (Sunet al.2013). In other non-human animals these locations might take the form of watering holes, foraging patches, leks, or nesting areas where there are brood that must be provisioned regularly.
Depending upon the study system and the context, preferen-tial bias towards previously visited locations has been variously labelled recurrence (Gonzalez, Hidalgo & Barabasi 2008; Song
et al. 2010; Boyer, Crofoot & Walsh 2011), recursion (Bar-David et al.2009; Benhamou & Riotte-Lambert 2012; Faganet al.2013; Berger-Tal & Bar-David 2015), site tenacity (Hahn & Maschwitz 1985), site allegiance (Dejean & Turillazzi 1992), site recognition (Salo & Rosengren 2001), site fidelity (Lamb & Ollason 1994; Schwarzkopf & Alford 2002; Giuggioli & Bartumeus 2012), spatial fidelity (Sendova-Franks & Franks 1995), ‘ortstreue’ (Rosengren & Fortelius 1986) and route fide-lity (Rosengren 1971). Recursive movement has been particu-larly well documented in the social insects–ants, bees, wasps and termites–where the phenomenon is most often referred to as site fidelity. Social insects show strong site fidelity both outside the nest (Traniello, Fourcassie & Graham 1991; Four-cassie & Traniello 1994; Lamb & Ollason 1994; Schatz, Lachaud & Beugnon 1995; Beverlyet al.2009; Salo & Rosen-gren 2001), and within it (Seeley 1982; Sendova-Franks & Franks 1995; Jandt & Dornhaus 2009; Frohschammer & Heinze 2009; Baracchiet al.2010; Jeanson 2012). For exam-ple, wood ant workers show a strong tendency to re-use one of the multiple foraging trunk-trails emanating from the nest mound (Rosengren , 1971, 1977), a preference that can persist over several seasons (Rosengren 1971). Inside the nests of ants
*Correspondence author. E-mail: thomas.richardson@unil.ch or tom.richardson30@gmail.com
and bees, there is a strong division of labour, in which work is divided into discrete tasks that are spatially segregated into dif-ferent zones, with each zone being populated by a particular set of worker task specialists (Seeley 1982; Mersch, Crespi & Keller 2013; Baracchi & Cini 2014). This division of labour is thought to increase colony productivity, and has led to social insects being ecologically dominant in many ecosystems (Oster & Wilson 1978). Hence the origin and quantification of indi-vidual spatial fidelity have been and continue to be, of consid-erable interest to scientists interested in the organization of animal societies. Here we study site fidelity in colonies of the rock ant, Temnothorax albipennis. We chose this species because the workers exhibit site fidelity within the nest (Sen-dova-Franks & Franks 1993), and because the nearly two-dimensional geometry of natural rock ant nests–flat cavities between rock layers–makes them ideal for studies of spatial movement.
A variety of methods is now available for identifying differ-ent spatio-temporal compondiffer-ents of site fidelity. For example, there has been a recent growth in methods for identifying routine movement patterns, such as periodic returns to previously-visited locations (Bar-David et al. 2009; Riotte-Lambert, Benhamou & Chamaille-Jammes 2013; Peronet al. 2016), or repetitive sequences of visits to particular locations (Riotte-Lambert, Benhamou & Chamaille-Jammes 2017). Similarly, there are several tools to evaluate whether there is a stable home range over which the animal typically roams, or a core area to which it frequently returns, such as comparing the degree of spatial overlap between consecutive time periods (Cooper 1978; Van Beestet al.2013), or checking whether the time-series of the total area that the animal covers (Van Moor-teret al.2009), or its net displacement (B€orger, Dalziel & Fryx-ell 2008), saturate over time. Despite this plethora of techniques, many studies of within-nest site fidelity in social insects still adopt a ‘reductive’ approach in which a complex spatio-temporal object–an animal trajectory–is aggregated over time and space into a single summary statistic such as the area the trajectory covers (Jandt & Dornhaus 2009; Baracchi et al.2010; Baracchi & Cini 2014). This preference may be derived from the nest wall severely circumscribing individual movement; as the total area covered and the net displacement of a physically bounded random walk both saturate over time, it is difficult for the above methods to distinguish between an agent that moves randomly within the nest, and one that has a preference for one (or several) parts of the nest. Hence, the pri-mary motivation for the current study is to provide an analyti-cal framework that can identify those individuals that exhibit site fidelity that can pinpoint the sites to which they are loyal, and that is robust to the presence of physical boundaries. The second motivation stems from the fact that existing measures of spatial fidelity are often based upon descriptions of the space use patterns of individuals (Sendova-Franks & Franks 1993; Frohschammer & Heinze 2009; Baracchi et al. 2010; Ben-hamou & Riotte-Lambert 2012; Mersch, Crespi & Keller 2013) or groups Baracchi & Cini (2014), rather than upon quantitative comparisons between the observed pattern and an absolute standard (but see Sendova-Franks & Franks 1995;
Jandt & Dornhaus 2009). In other words, rigorous hypothesis-testing, involving comparisons between the observation and the expectation under the assumption of random movement, as predicted by a mathematical or statistical null model, has sometimes been lacking.
In the first part of the paper, we present an extension of a recent site-centric framework which has been developed for the analysis of human digital mobility traces (Crandallet al.2010; Sunet al.2013) and animal movement ecology (Boyer, Cro-foot & Walsh 2011; Benhamou & Riotte-Lambert 2012; Lyons, Turner & Getz 2013; Faganet al.2013; Berger-Tal & Bar-David 2015). Contrary to the traditional reductive approach in which the trajectory is reduced to a single sum-mary statistic, in the site-centric framework space is discretized into a regular grid, and the visitation statistics of a given indi-vidual for each site are analysed independently. In our exten-sion, we demonstrate that sites to which individuals exhibit positive or negative biases can be identified by comparing these site-visitation statistics with an absolute standard, provided by null model synthetic trajectories that exhibit no spatial biases. Further, using both simulations of biased random walks, and empirical analysis of ant trajectories, we show that this com-bined framework is more sensitive at identifying individuals that exhibit site fidelity than the traditional reductive approach.
Whilst our understanding of the social organization of colo-nies of ants (Sendova-Frankset al.2010; Blonder & Dornhaus 2011; Jeanson 2012), bees (Naug & Smith 2007; Otterstatter & Thomson 2007), and other highly social species (Williams & Lusseau 2006; Drewe 2010), has been greatly advanced by the application of tools from network science, these tools are only just beginning to be applied to the spatial organization of these societies (see e.g. Mersch, Crespi & Keller 2013; Baracchi & Cini 2014; Richardson & Gorochowski 2015). Therefore, in the second part of the paper, we use the results of the site-cen-tric analysis of the ant trajectories to construct spatial networks in which each edge represents the spatial overlap in the site-visi-tation patterns of two ants. We then show how modern net-work partitioning methods can be used to identify groups of ants with distinctive space use patterns.
exhibit impressive capacities for both internal (i.e. neuronal, McLeman, Pratt & Franks 2002; Stroeymeyt, Franks & Giurfa 2011; Bowens, Glatt & Pratt 2013), and external (i.e. pheromo-nal, Mallon & Franks 2000) memory storage formats. There-fore, the last part of this paper examines whether the trajectories of individual rock ants exhibit non-Markovian properties, that is, whether movement decisions are history dependent.
Materials and methods
STUDY SYSTEM
Twenty three T. albipennisant colonies were collected on 3 May 2008 in Dorset, UK. They were housed in rectangular nests (internal dimensions: 5093592 mm), constructed by sandwiching a card-board gasket between two glass microscope slides (Sendova-Franks
et al.2010). Food and water were provided ad libitum. All colonies had a single queen that showed normal behaviour for a fertilized queen, for example a strong tendency to take up a position on the brood pile. Forty eight hours prior to the commencement of the experiments, all workers in each colony were individually tagged with a unique colour code of paint marks applied to the top of the head, the thorax, and the gaster. Immediately following the individ-ual marking, the colonies were rehoused in a new nest with food and water provided ad libitum. Then, 24 h after the individual marking had ended 48 h of time-lapse photography began. During this 48 h period, no food or water was provided to the colonies, although they were allowed access to an exploration arena (1009100 mm), which was accessible via a tube attached to the front of the nest. A digital camera captured an image of the nest once every 10 min.
From these images, we extracted 86 023 ant coordinates, compris-ing 335 ant trajectories. From each colony, we extracted the trajec-tory of the queen plus 14–16 randomly selected workers. Each trajectory consisted of a regular sequence of time-stamped{x,y}
coordinates, with a 10-min interval between successive fixes. As ants sometimes left the nest, or were not visible within the nest, some coor-dinates were missing. These gaps accounted for a mean of 10606% of the trajectories, and the average trajectory consisted of 25725 time-stamped coordinates.
Although the brood are not mobile, they are occasionally moved by the workers. Therefore, to map the slowly changing spatial distribution of the brood, several censuses were made over the course of each experi-ment; every 50 photographs (every 8 h) the developmental stage and {x,y}position of each brood item was recorded (Figs S1 and S2 in Appendix S1, Supporting Information). Each brood item was classified into four categories, according to developmental stage: (i) eggs, (ii) small larvae, (iii) medium/large larvae, or (iv) pre-pupae and pupae (Franks & Sendova-Franks 1992). For further details on the brood cen-suses, see the Appendix S1.
G E N E R A T I N G U N B I A S E D S Y NT H E T I C T R A J E C T O R I E S : A RA N D O M WA L K N U L L MO D E L
In order to diagnose the presence of a non-random pattern, one typi-cally compares the observed pattern against an expectation or absolute standard produced by a null model. When testing for a non-random movement pattern, such as site fidelity, the absolute standard is typi-cally obtained by repeatedly randomizing the original trajectory, to
obtain an ensemble of synthetic trajectories that are free from spatial biases and which can then be used as an absolute standard against which the original is compared. At least two previous studies on site fidelity in ants (Sendova-Franks & Franks 1995) and bumblebees (Jandt & Dornhaus 2009) have used what we will call the Location Shuffling (LS) null model, in which a synthetic trajectory is constructed by randomly sampling coordinates from the trajectories of nestmates. However, because the LS procedure samples coordinates from the tra-jectories of multiple individuals, the resulting synthetic tratra-jectories do not preserve two fundamental statistical properties of the original tra-jectory. The first of these fundamental properties is the step-length dis-tribution, where a step is defined as the distance between each coordinate,ðxt;ytÞand the next,ðxtþ1;ytþ1Þ, that is,et(Fig. 1a). The
second is the turn-angle distribution, where a turn is defined as the signed angular deviationht(rangeptop) between successive
line-seg-ments (Fig. 1d). As these distributions are not preserved (Fig. 1b,e), the synthetic LS trajectories exhibit several undesirable traits, for instance, they contain an over-abundance of long-range jumps and heading reversals (Fig. 1h).
Given these shortcomings, we require an alternative null model that produces unbiased synthetic trajectories that lack any spatial biases, but which also retain the fundamental statistical properties of the origi-nal. We therefore adopt a Random Walk (RW) null model that uses constrained randomization to produce synthetic trajectories that exhi-bit no spatial biases but also preserve these distributions (Munger 1984; Danielson & Swihart 1987; Spencer, Cameron & Swihart 1990; Sch-warzkopf & Alford 2002; Richardson & Gorochowski 2015). The RW null model produces a synthetic trajectory by iterative random sam-pling (with replacement) from the step-length and turn-angle distribu-tions of the original trajectory. This iterative sampling is stopped when the synthetic trajectory contains the same number of steps as the origi-nal. Because we use sampling with replacement, the synthetic step-length and turn-angle distributions for a single synthetic trajectory are not necessarily identical to the originals (Fig. 1c,f). Nevertheless, because many synthetic paths are produced for each original path, the aggregate synthetic distributions will converge to the originals.
In order to ensure that the only difference between the original and null model trajectories is the absence of spatial bias in the latter, three further constraints are imposed upon the above procedure. First, the synthetic trajectory is initiated at the same starting coordinates as the original. Second, to ensure that the synthetic path respects the internal borders of the nest, the iterative resampling is constrained: if, after any iteration, a random sample,ðet;htÞ, takes the synthetic ‘ant’ beyond
the internal boundary of the nest, then the sample is discarded and another drawn. Third, because the trajectories contained some gaps, the exact temporal gap structure of each ant trajectory was imposed upon the corresponding synthetic versions. The end result of the RW procedure is a synthetic trajectory that exhibits realistic movement pat-terns, but which lacks any localized spatial biases present within the original (Fig. 1i).
M E A S U R I N G S IT E F ID E L I T Y : A S IT E - C E N T R I C A P P R O A C H
1995; Jandt & Dornhaus 2009). Because this approach is based upon a comparison between the total area covered by the original and syn-thetic trajectories, it can fail to identify an individual that is attracted to a set of important sites but that nevertheless still covers a similar area to the corresponding synthetic trajectories. In Appendix S1, we present a simulation in which the area covered by a spatially biased random walk is compared with the area coverage expected in the absence of spatial biases (Fig. S3 in Appendix S1). This comparison showed no significant difference in the area covered by the spatially biased and unbiased walks, and thus demonstrates the validity of the claim that the reductive approach does not always correctly identify individuals that exhibit spatial bias.
The first stage of the site-centric approach is to divide the study area into a regular grid. Here, we investigated two grid cell sizes, both on the order of the length of a single ant; 393 mm and 494 mm. As the results were very similar for both cell dimensions, in what follows we present only the results for the former.
In order to make comparisons between the reductive and site-centric approaches, we first define a simple measure of the area that a trajec-tory covers; this is the number of unique sites that each antivisits,Ni.
Following the site-centric approach of Boyer, Crofoot & Walsh (2011),
for each individual we next define three measures for each site; the num-ber of visits, the mean dwell time, and the mean first return time. A site visit is defined as an uninterrupted presence of a given individual at a given site. So for individualiand sites, the sequence of uninterrupted visits is,Vs¼ fv
k¼1;vk¼2; :::;vk¼ns
ig, where the total number of visits is
ns
i(Fig. 2, left column).
Each site visit vk also has an associated start and stop time,
vk¼ fvstartk ;v
stop
k g. The dwell time for the kth visit is then
Ds vk¼v
stop
k vstartk , and the mean dwell time across thensivisits of
indi-vidualito sites, is,Ds
i(Fig. 2, middle column). A visit to a site that is
later revisited also has an associated first return time, defined by the interval between the end of one visit and the beginning of the next. So if after thekth visitvk, of individualito sites, individualireturns to the
same site, the first return time is, RTs vk!vkþ1¼v
start
kþ1ðtÞ v stop
k ðtÞ.
How-ever, as the first return times are defined by the intervals between suc-cessive visits, and as the observation period is finite, for each sites
visited by anti, the return time following the last visit,ns
i, is unknown,
or more properly, it is ‘censored’. Censoring complicates the estimation of an average first return time, for example, ignoring the censored returns and instead taking the mean across the uncensored return times induces a downward bias in the mean. Therefore, to obtain an unbiased
Count
0 10 20 30 40 0 10 20 30 40
Step length, εt (mm)
0 10 20 30 40
(a)
Original (b) LS null model (c) RW null model
Turn anlge, θt(rad)
Count
(d)
0 1 2 3
(e)
0 1 2 3 –3 –2 0 1 2 3
(f)
0
5
0
150
250
0
2
04
06
0
05
1
0
2
0
3
0
x (mm)
y (mm)
(g)
0
5
0
150
250
0
2
04
06
0
05
1
0
2
0
3
0
x (mm) (h)
0 10 20 30 40 50 0 10 20 30 40 50 0 10 20 30 40 50
0
5
0
150
250
02
0
4
0
6
0
0
5
10
20
30
x (mm) (i)
Step length, εt (mm) Step length, εt (mm)
Turn anlge, θt(rad) Turn anlge, θt(rad)
–1 –3 –2 –1
[image:4.595.67.531.70.447.2]–3 –2 –1
Fig. 1. Producing unbiased synthetic ant trajectories. (a–c) The step-length distributions is as follows: (a) ant 16 from colony 6, (b) a single
estimate of the typical first return time for a given sites, we calculate the restricted mean (Irwin 1949), which we write RTs
i (Fig. 2, right
column).
To measure the extent to which a given site is ‘important’ to a given individual, it is necessary to compare the observed visit patterns with those expected under the null hypothesis that visits are random. To do so, for each sites, and each individuali, we compare the observed num-ber of visits,ns
i, the mean dwell time,Dsi, and mean first return time,
RTsi, with the corresponding distribution of expected values obtained
from the RW synthetic trajectories. The three expected distributions for individualiat sitesare obtained by first subjectingi’s trajectory to 10 000 null model randomizations, resulting in an ensemble of 10 000 synthetic trajectories, each based uponi’s original trajectory. While not all of the synthetic trajectories will visit sites, the distribution of the number of times that each synthetic trajectory visitssacross the trajec-tory ensemble, gives the expected distribution forns
i. The expected
dis-tributions for the mean dwell timeDs
i, and the mean first return time
RTs
i, are obtained in the same way. To characterize the extent to which
the observed individual site visitation patterns deviate from these
expectations, the observed number of visits, the dwell and return times for each individual at each site were expressed as standardisedz-scores,
z¼xrl, wherexrepresents the observed value,lrepresents themean
of the corresponding distribution of expected values, andrrepresents the standard deviation thereof. We write these individual- and site-spe-cificz-scores, asns
iðzÞ,DsiðzÞ, and RTsiðzÞ. Finally, to identify the
important sites for individuali, for each of the sites that it visits we test the null hypothesis that the observed number of visitsns
i, mean dwell
time,Ds
i, or mean first return time, RTsi, are statistically
indistinguish-able from the corresponding distributions of expected values produced by the RW null model. As there are no particulara priorireasons to predict whether ants should be biased towards or away from particular sites, for each sitesvisited by antiwe perform a two-tailed permutation test using a significance threshold ofa<005. So in the case of the number of visits to a given site,ns
i, the null hypothesis is rejected if the
observedns
i is lower than the leftmost 0025 quantile of the expected
distribution, on the grounds that the ant made significantly fewer visits tosthan expected. Similarly, the null hypothesis is also rejected if the observedns
[image:5.595.62.537.72.455.2]iis greater than the rightmost 0975 quantile of the expected
Fig. 2. Testing for spatial fidelity at the level of individual sites. Each row of three panels represents a single ant from colony 6 (row 1; queen, rows
2–4; workers). The nest entrance is located midway along thex-axis. The nest is divided into a regular 393 mm grid; cell colours indicate the mag-nitude and sign of the deviation of the observed number of visits (ns
i, left column), the observed mean first return time (RTsi, right column), or the
observed mean dwell time (Ds
i, middle column), from the corresponding null model expectation for that cell, expressed as standardizedz-scores. Grey
distribution, because the ant visitedssignificantly more than expected. However, as each antivisitsNidifferent sites, there areNisignificance
tests for each anti, hence it is likely some sites may achieve a statistically significantP-value just by chance. Therefore, to control for the effect of multiple comparisons, we apply the Benjamini–Hochberg false discov-ery rate procedure (Benjamini & Hochberg 1995) to the two-tailed
P-values. After this correction, any remaining sites withP<005 are classified as important.
Lastly, because one of the later analyses requires that we compare between different groups of individuals, we here define three individ-ual-level summary statistics corresponding to the site-centric measures, namely, the mean number of visits per visited sitesni, the mean dwell
time per visited site,Di, and, the mean return time per visited site, RTi.
DI S TI NGU IS HI NG COM MU NIT IE S W IT H D IS T IN CT IV E P A T T E R N S OF S I T E FI D E L IT Y
Here we describe how the site-centric approach can be used to classify individuals into groups with distinctive space use patterns. The process involves three steps. In the first step, for each unique pair of individuals, {i,j}, we use the number of visits that each ant makes to each site (ns
i, nsj) to calculate a well-established measure of spatial overlap,
namely the volume of intersection (Kernohan & Gitzen 2001; Fieberg & Kochanny 2005). Wheniandjvisit each site exactly the same num-ber of times, then the spatial overlap is maximal, and the volume of intersection VIi;j =1 (Fig. 3a,b). Conversely, whenivisits none of the
sites visited byjthen there is no overlap, and hence VIi;j=0 (Fig. 3c,d).
In the second step, these pairwise spatial overlaps are used to con-struct a network in which each individualiis represented by a vertex, and each pair correlation, VIi;j, is assigned as the weight of an
undi-rected edge connecting nodesiandj(Fig. 3e). To identify groups of individuals with similar space use patterns, we apply the Spinglass
community-detection method (Reichardt & Bornholdt 2006). All net-work analyses were conducted, using the IGRAPHpackage (version
1.0.1; Csardi & Nepusz 2006) for R.
As the network is essentially a topological representation of spatial relationships between individuals, in the last step, the space use maps of the different communities were compared. To do so, within-community averages were calculated for the number of visits to each site,ns
i, thus
producing a map of site visitation frequencies that is representative of the community (Fig. 4).
DET E CT IN G T HE STAT IST ICAL S IGN A TUR E OF SELF -R E I N F O -R C I N G S P A T I A L B I A S
We now outline a further elaboration of the site-centric approach, in which we test whether ant movement decisions display the statistical characteristics associated with a particular movement model that has been suggested as a likely candidate for producing site fidelity, that is, the self-attracting walk (Tanet al.2001; B€orger, Dalziel & Fryxell 2008). Because an agent that performs a self-attracting walk is attracted towards locations that it visited in the past, we here explore whether individuals return to the sites that they have previously visited more rapidly than expected by random chance.
We follow the general approach of Boyer, Crofoot & Walsh (2011) and test whether the time an individualidwells at site,s, during itsvth visit,Ds
v, predicts the time it takes until itnextvisits sites, which is the
first return time, RTs
v!vþ1. The null hypothesis that ants move
com-pletely randomly within the nest can be rejected if RTs
v!vþ1exhibits a
statistically significant dependence uponDs
v. A negative relationship–
obtained when long dwell times are associated with short return times– is indicative of a self-attracting walk in which previously visited sites become more attractive with each visit (Tanet al.2001; Foster, Grass-berger & Paczuski 2009). Conversely, a positive relationship indicates a
(a) (b)
(c) (d)
[image:6.595.64.532.460.672.2](e)
Fig. 3. Classifying ants into groups with distinctive space use patterns. This figure illustrates the procedure for colony 1. (a, b) Trajectories of the
two ants with the most similar space use patterns. Site greyscale indicates the number of times the ant visited each site,ns
i. The spatial overlap between
ns
i¼2, andnsi¼4, is VIi;j ¼066. The green line indicates the edge of the brood pile. (c, d) Trajectories of the two ants with the most dissimilar space use
patterns, which have VIi;j ¼003. Note, anti=1 is the queen. (e) Network representation of the spatial relationships between ants. Edge widths are
proportional to the magnitude of the pairwise spatial overlap, VIi;j. Vertex size is proportional to the weighted degree centrality. The queen is
self-avoiding walk in which intensively-visited sites are avoided (Madras & Slade 1993; Richardsonet al.2011). In testing the null hypothesis of no relation betweenDs
vand RTsv!vþ1, Boyer, Crofoot &
Walsh (2011) pooled all site-visits across all individuals, discarded all sites that received less than five visits, and then used linear least-squares regression to test whether the dwell time predicted the return time. Here, however, we use an alternative method to address the same ques-tion; a Cox survival model (Cox 1972), with a mixed-effects extension that allows variation arising from uncontrolled variables to be included as random effects (Therneau 2000). Survival modelling was conducted using the packageCOXME(version 2.2-5) for R. We use this method
because it allows the inclusion of censored time-to-event response vari-ables, such as the unobserved return time that follows the last visit of individualito sites, that is, RTsvn!vnþ
1, and also because the
mixed-effects extensions renders it robust to uncontrolled variation between individuals and colonies.
As in Boyer, Crofoot & Walsh (2011), the response was the time to return to a site following the end of thevth visit, RTs
v!vþ1, and
the predictor was the dwell time during the vth visit,Ds
v.
Further-more, because the return time might have also been influenced by both the physiological or behavioural characteristics of the
individual, or by other environmental features, we included three additional predictors in the model. These were, respectively, the reproductive caste of ant i (queen or worker), the community membership ofi, as defined by the network partitioning, and the number of brood items (eggs, small larvae, large larvae, pupae) at sitesduring thevth visit of anti.
The mixed-effects extension allowed the following uncontrolled variables to be coded as categorical random effects, namely the identity of (i) each colony (21 levels, A,B,. . .,Y), (ii) each indi-vidual (335 levels, A1;A2;. . .;Y13;Y14), and (iii) each site (198
[image:7.595.63.537.73.450.2]levels). From these three random effects, we defined three candi-date models. First, the maximal model that included all three ran-dom effects. The intermediate model retained colony and individual identity, but discarded the random effect with the great-est number of levels, namely, ‘site’. Finally, the minimal model retained the random effect with the fewest levels, namely colony identity. We used AIC to select among the three competing sur-vival models; the model with the lowest AIC was the intermediate model, so we present and interpret the results from that model (Table 1). The results of all three models were qualitatively similar.
Fig. 4. Within-community space use maps for the 21 colonies that had two communities. Site greyscale indicates the number of times antivisited
the site,ns
i, averaged across all community members. Asterisks indicate important sites for community members; those that received significantly
Results
S U P E R IOR I T Y O F T H E S IT E -C E N T R IC A P P R O A C H
The presence of spatial fidelity was strongly supported by both the traditional reductive approach and the combined site-cen-tric approach. Out of the 335 ant trajectories, the reductive approach found that no ants visited a larger area than expected (no roaming), whereas 152 ants visited a significantly smaller area than expected (site fidelity). All of the remaining 183 ants visited an area that was no larger or smaller than expected.
Among 152 ants that the reductive approach classified as exhibiting fidelity, the site-centric approach found 133 that vis-ited at least one site significantly more than expected (site fide-lity), whereas 18 visited at least one site less than expected (site avoidance). Therefore, by and large, the two approaches agreed over the identity of the ants that exhibit site fidelity. However, among the 183 ants that the reductive approach clas-sified as exhibiting no spatial bias, the site-centric approach found 57 that visited at least one site significantly more than expected (site fidelity), whereas 24 visited at least one site less than expected (site avoidance). Because 81 of the 183 ants that the reductive approach classed as exhibiting no spatial bias did in fact exhibit bias, we conclude that the site-centric approach is considerably more sensitive.
There is at least one additional reason to prefer the site-cen-tric approach over the reductive approach: because the reduc-tive approach reduces the trajectory to a single statistic, such as the area covered, it can only assign an individual to one of three categories, namely, site fidelity (area smaller than
expectation), neutral (area equal to expectation), or ‘roaming’ (area larger than expectation). The site-centric approach pro-vides a richer classification scheme, as in addition to the above three categories, it can also identify individuals that are attracted to some sites whilst also avoiding other sites. Further-more, by expressing the site visits statistics as standardized z-scores, it can provide information about the magnitude and direction of the bias to particular sites (Fig. 2).
We now summarize the extent of site fidelity, as measured by the site-centric approach. All three site-centric measures of fidelity,ns
i,Dsiand RT s
i, showed considerable variation in the
extent to which ants exhibit fidelity to particular sites; the mean number of important sites per ant was 85030 for ns
i,
33 017 for RTs
i, and 1501 forDsi. However, across the
three metrics, there was an appreciable degree of consistency in the identity of the important sites (see asterisks in Fig. 2).
Visual inspection showed that across all 23 colonies, the important sites of the queen were almost invariably restricted to sites containing many brood items (Fig. 2, row 1). How-ever, those of the workers either clustered around the queen and brood (Fig. 2, row 2), or formed more peripheral shapes, such as sickle-shaped formations around the border of the brood pile, or tight clusters around the nest entrance (Fig. 2, rows 3–4).
A N T S C A N B E C LA S S I F I E D INT O C O M M U N IT IE S WI T H D I S T I N C T I VE S IT E F ID E L IT Y P A T T E R N S
We now outline the results of the social network analysis of the spatial overlaps between ant pairs. One of the most obvious low-level features of the spatial networks was the clear differ-ences between the workers and the queens: even though queen movement was very biased towards the biological centre of the nest (i.e. the brood pile; Fig. 3c), this spatial centrality did not translate into topological centrality, as queens instead occu-pied peripheral positions on the spatial networks (Figs 3e, S4). To quantify this observation, we measured the weighted degree centrality of each vertex in each network: high values indicate ants whose important sites are shared with many other ants, whereas lower values indicate ants whose important sites are shared with few others. Compared to workers, queens had a significantly lower weighted degree (Q vs W; t=36, P=00003). Therefore, the site-centric approach revealed that despite outward appearances, queens were spatially isolated from workers.
[image:8.595.62.290.136.236.2]The overall structure of the interaction networks was remarkably consistent across colonies: 21 of the 23 spatial works were partitioned into two communities, whilst two net-works could not be partitioned (Fig. S4 in Appendix S1). A universal feature of behavioural organization in the social insects, is that young workers tend to feed and groom the brood and the queen, whereas older workers perform general-ist within-nest tasks, and the oldest workers guard the nest entrance and go outside to forage (Oster & Wilson 1978; Seeley 1982; Mersch, Crespi & Keller 2013). Therefore, in the two-community colonies the identity of the two-community containing the queen provided a convenient means of applying a
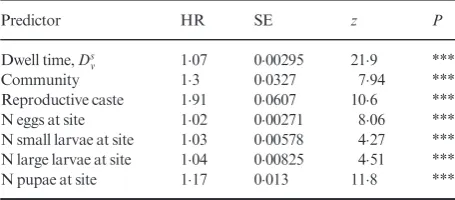
Table 1.Mixed-effects survival model, testing how the time an anti
takes to return to a sitesafter the end of thevth visit, RTsv!vþ1, is
influ-enced by (i) the duration of thevth visit, that is, the dwell timeDs v, (ii)
the reproductive caste of the ant, (iii) the community to which it belongs, and (iv) the spatial distribution of brood of different develop-mental stages
Predictor HR SE z P
Dwell time,Ds
v 107 000295 219 ***
Community 13 00327 794 *** Reproductive caste 191 00607 106 *** N eggs at site 102 000271 806 *** N small larvae at site 103 000578 427 *** N large larvae at site 104 000825 451 *** N pupae at site 117 0013 118 ***
For non-categorical predictors, the hazard ratio (HR) indicates the instantaneous risk of a return visit tos, relative to the baseline hazard. For the categorical predictors, caste and community, the HR indicates respectively, the instantaneous risk that a queen returns to sitesrelative to a worker, and the instantaneous risk that an ant in the ‘nurse’ com-munity returns tos, relative to an ant in the ‘other’ community. Colony and ant identity were coded as random factors, with ant identity nested within colony identity. Two colonies were excluded from the analysis because their spatial interaction network had only 1 community, hence ants could not be labelled according to their community. The model was based upon 50 187 site visits, of which 29 391 were uncensored site-returns.
biological meaningful label to each community: the commu-nity containing the queen was labelled ‘nurses’ (N), and the remaining community was labelled ‘others’ (O).
In the two community colonies, the movement patterns of the ants varied according to the identity of their community. In the 21 two-community colonies, the ants in the ‘nurse’ commu-nity visited significantly fewer sites (linear mixed-effects regres-sion, response; Ni, predictor; caste, random effect; colony
identity,F1;288 ¼ 1150,P<104, henceforth ‘’), made
sig-nificantly more visits to each of the sites that they did visit (re-sponseni;F1;295 ¼ 592,P=), had a significantly longer
site dwell time (response Di; F2;289 ¼ 317, P=), and
returned to previously-visited sites significantly more rapidly (response RTi;F1;297 ¼ 733,P=) than ants in the ‘other’
community. So, nurse workers exhibited a much greater degree of spatial fidelity than the other workers.
Converting the network partitions into within-community space use maps, revealed that the topologically distinct com-munities corresponded to groups with quite distinct space use patterns. The nurse community tended to visit sites within the brood pile and only rarely visited sites outside the brood pile (Fig. 4). In the 21 colonies with two communities, the second community (which we labelled ‘other’) tended to avoid sites at the centre of the brood pile, and instead occupied positions at its edge, and also around the nest entrance (Fig. 4).
A N T S E X H IB I T S E LF - R E I N F O R C I N G S P A T I A L B IA S
The survival model confirmed that ant movement displays biased return statistics that are not consistent with a Marko-vian movement model: each additional minute that an ant spent at a given site before departing, modified the instanta-neous risk of a return by 107-fold over the baseline hazard rate, which is an increase of 7% per minute (Table 1). There-fore, short visits were associated with long waits until the next visit, whereas long visits were associated with short waits until the next visit. This association is consistent with a self-attract-ing walk, a movement model in which visited sites become more attractive with each visit. Because in this model, previous site-visits influence future behaviour, self-attracting walks are history dependent, or more properly, they are non-Markovian. Several other factors also influenced the time taken to return to a previously visited site: the effect of an ant belonging to the ‘nurse’ community was to modify its instantaneous return risk by 13-fold relative to those ants in the ‘other’ community. This confirms the result from the between-community comparisons in the previous section. However, the reproductive caste of the ant was by far the strongest determinant of the return time: the effect of an ant being a queen was to increase its instantaneous return risk by 19-fold, that is, a 90% increase relative to a worker. Thus, queens more rapidly returned to previously-vis-ited sites than workers. The presence of brood items at a site did significantly influence the instantaneous risk that the indi-vidual would return there. However, the direction of the effect was dependent upon the developmental stage of the brood item. Each additional egg at a site was associated with a 102-fold increase in the instantaneous return risk over the baseline
hazard rate. Similarly, each additional small larva, large larva and pupa were associated with a 103, 104, and 117-fold respective increase in the return risk. Therefore, all brood stages were attractive to the ants, and more the brood were pre-sent at a given site during the visit of an ant, the more rapidly the ant returned there.
Discussion
In this paper, we have presented an analytical framework that leverages the spatial and temporal information con-tained within an animal trajectory to identify important sites within the environment, identify groups of animals with distinctive space-use patterns, and shed light on the mechanisms that underpin animal movement. We have also shown that this combined framework is considerably more sensitive than previous approaches which reduce a complex spatio-temporal object –an animal trajectory –to a single summary statistic. This sensitivity is derived from the for-mal statistical hypothesis testing provided by comparisons between the original trajectories and the synthetic trajecto-ries produced by the RW null model. It should be empha-sized that this null model could profitably be combined with other site-specific methods for quantifying local space-use intensities, such as those of Benhamou & Riotte-Lam-bert (2012) and Lyons, Turner & Getz (2013), to identify locations that are more intensively exploited or more fre-quently revisited than expected by chance alone.
interpreted as organizational features that reduce the exposure of the colony to pathogens.
The second conclusion concerns the mechanisms responsible for generating site fidelity. Although the presence of site fidelity is well documented across a range of social insect species, to the best of our knowledge nothing is known about how indi-viduals first establish and then maintain bias towards a set of important sites. The finding that the longer an ant dwells at a site the more quickly it will return after leaving it, indicates that ant movement is not compatible with a Markov movement model, or in other words, ‘history’ influences current beha-viour. The observed statistical signatures appear consistent with a particular class of non-Markov movement model, the so-called self-attracting walk, in which sites become progres-sively more attractive with each visit. Indeed, the self-attracting walk has been proposed as a candidate mechanism that would allow an animal to establish and maintain fidelity towards a set of important sites (Tanet al.2001; Foster, Grassberger & Pac-zuski 2009). However, it is important to note two caveats. First, this association is a correlation, so it cannot be claimed that the long site dwell times cause short returns. Second, whilst the presence of a statistical signature of a self-attracting walk indicates that this may underly the generation of site fide-lity inT. albipennisants, this result does not say anything about the nature of the ‘memory’ that allows the reinforcement to be brought about. Nevertheless, there are at least two (potentially complimentary) candidate mechanisms, namely, chemical pheromones deposited onto the substrate, and internal place memory. As rock ants have evolved sophisticated strategies for chemical marking (Mallon & Franks 2000), and navigation strategies (McLeman, Pratt & Franks 2002; Bowens, Glatt & Pratt 2013), future research should concentrate on elucidating their contributions to the generation of site fidelity.
In this paper, we have outlined a combined framework for identifying the sites to which individuals are attracted, and for identifying groups of individuals that share a common set of sites to which they are attracted. We hope that the clear advan-tages of the site-centric framework over traditional reductive approaches, will encourage others to delve further into the mechanisms that govern animal movement.
Authors’ contributions
T.O.R., A.B.S.-F. and N.R.F. conceived the experiments. T.O.R., L.G., A.B.S.-F. and N.R.F. conceived the analyses. T.O.R. performed the experi-ments and the analysis. T.O.R. wrote the paper with input from all authors. N.R.F. and A.B.S.-F. provided experimental facilities. All authors commented and provided feedback on the manuscript.
Acknowledgements
T.O.R. acknowledges an EU Marie Curie Actions Fellowship, no. 30114. A.B. S.-F. and T.O.R. acknowledge EPSRC grant EP/E061796/1. L.G. acknowledges EPSRC grant EP/I013717/1. We thank Natalie Stroeymeyt for helpful comments on the manuscript. The authors declare no conflict of interest.
Data accessibility
Ant trajectories and brood location data are freely available from the Dryad Digital Repository at https://doi.org/10.5061/dryad.fj043 (Richardsonet al.2017).
References
Bar-David, S., Bar-David, I., Cross, P.C., Ryan, S.J., Knechtel, C.U. & Getz, W.M. (2009) Methods for assessing movement path recursion with application to African buffalo in South Africa.Ecology,90, 2467–2479.
Baracchi, D. & Cini, A. (2014) A socio-spatial combined approach con-firms a highly compartmentalised structure in honeybees. Ethology,120, 1167–1176.
Baracchi, D., Zaccaroni, M., Cervo, R. & Turillazzi, S. (2010) Home range analy-sis in the study of spatial organization on the comb in the paper waspPolistes dominulus.Ethology,116, 579–587.
Benhamou, S. & Riotte-Lambert, L. (2012) Beyond the utilization distribution: identifying home range areas that are intensively exploited or repeatedly vis-ited.Ecological Modelling,227, 112–116.
Benjamini, Y. & Hochberg, Y. (1995) Controlling the false discovery rate: a prac-tical and powerful approach to multiple testing.Journal of the Royal Statistical Society. Series B (Methodological),57, 289–300.
Berger-Tal, O. & Bar-David, S. (2015) Recursive movement patterns: review and synthesis across species.Ecosphere,6, 1–12.
Beverly, B.D., McLendon, H., Nacu, S., Holmes, S. & Gordon, D.M. (2009) How site fidelity leads to individual differences in the foraging activity of har-vester ants.Behavioral Ecology,20, 633–638.
Blonder, B. & Dornhaus, A. (2011) Time-ordered networks reveal limitations to information flow in ant colonies.PLoS One,6, e20298.
B€orger, L., Dalziel, B.D. & Fryxell, J.M. (2008) Are there general mechanisms of animal home range behaviour? A review and prospects for future research.
Ecology Letters,11, 637–650.
Bowens, S.R., Glatt, D.P. & Pratt, S.C. (2013) Visual navigation during colony emigration by the antTemnothorax rugatulus.PLoS One,8, e64367. Boyer, D., Crofoot, M.C. & Walsh, P.D. (2011) Non-random walks in monkeys
and humans.Journal of The Royal Society Interface,9, 842–847.
Boyer, D. & Solis-Salas, C. (2014) Random walks with preferential relocations to places visited in the past and their application to biology.Physical Review Letters,112, 240601.
Cooper, W.E. (1978) Home range criteria based on temporal stability of areal occupation.Journal of Theoretical Biology,73, 687–695.
Cox, D.R. (1972) Regression models and life-tables.Journal of the Royal Statisti-cal Society. Series B (MethodologiStatisti-cal),34, 187–220.
Crandall, D.J., Backstrom, L., Cosley, D., Suri, S., Huttenlocher, D. & Klein-berg, J. (2010) Inferring social ties from geographic coincidences.Proceedings of the National Academy of Sciences,107, 22436–22441.
Csardi, G. & Nepusz, T. (2006) The igraph software package for complex net-work research.InterJournal, Complex Systems,1695(5), 1–9.
Danielson, B.J. & Swihart, R.K. (1987) Home range dynamics and activity pat-terns of Microtus ochrogaster and Synaptomys cooperi in syntopy.Journal of Mammalogy,68, 160–165.
Dejean, A. & Turillazzi, S. (1992) Territoriality during trophobiosis between wasps and homopterans.Tropical Zoology,5, 237–247.
Drewe, J.A. (2010) Who infects whom? Social networks and tuberculosis trans-mission in wild meerkats.Proceedings of the Royal Society of London B: Bio-logical Sciences,277, 633–642.
Fagan, W.F., Lewis, M.A., Auger-Methe, M., et al. (2013) Spatial memory and animal movement.Ecology Letters,16, 1316–1329.
Fieberg, J. & Kochanny, C.O. (2005) Quantifying home-range overlap: the importance of the utilization distribution.Journal of Wildlife Management,69, 1346–1359.
Foster, J.G., Grassberger, P. & Paczuski, M. (2009) Reinforced walks in two and three dimensions.New Journal of Physics,11, 023009.
Fourcassie, V. & Traniello, J.F. (1994) Food searching behaviour in the ant For-mica schaufussi(Hymenoptera, Formicidae): response of naive foragers to pro-tein and carbohydrate food.Animal Behaviour,48, 69–79.
Franks, N.R. & Sendova-Franks, A.B. (1992) Brood sorting by ants: distributing the workload over the worksurface.Behavioral Ecology and Sociobiology,30, 109–123.
Frohschammer, S. & Heinze, J. (2009) Male fighting and “territoriality” within colonies of the antCardiocondyla venustula.Naturwissenschaften,96, 159–163. Giuggioli, L. & Bartumeus, F. (2012) Linking animal movement to site fidelity.
Journal of Mathematical Biology,64, 647–656.
Gonzalez, M.C., Hidalgo, C.A. & Barabasi, A.L. (2008) Understanding individ-ual human mobility patterns.Nature,453, 779–782.
Hahn, M. & Maschwitz, U. (1985) Foraging strategies and recruitment behaviour in the European harvester antMessor rufitarsis(F.).Oecologia,68, 45–51. Irwin, J. (1949) The standard error of an estimate of expectation of life, with
special reference to expectation of tumourless life in experiments with mice.
Jandt, J.M. & Dornhaus, A. (2009) Spatial organization and division of labour in the bumblebeeBombus impatiens.Animal Behaviour,77, 641–651.
Jeanson, R. (2012) Long-term dynamics in proximity networks in ants.Animal Behaviour,83, 915–923.
Kernohan, B. & Gitzen, R. (2001) Analysis of animal space use and movements.
Radio Tracking and Animal Populations, (eds J.J. Millspaugh & J.M Marzluff), pp. 125–166. Academic Press, San Diego, CA, USA.
Lamb, A. & Ollason, J. (1994) Site fidelity in foraging wood-antsFormica aquilo-niaYarrow and its influence on the distribution of foragers in a regenerating environment.Behavioural Processes,31, 309–321.
Lyons, A.J., Turner, W.C. & Getz, W.M. (2013) Home range plus: a space-time characterizationof movement overreal landscapes.Movement Ecology,1, 1–14. Madras, N. & Slade, G. (1993)The Self-Avoiding Walk. Springer Science &
Busi-ness Media, New York, NY, USA.
Mallon, E.B. & Franks, N.R. (2000) Ants estimate area using Buffon’s needle. Pro-ceedings of the Royal Society of London B: Biological Sciences,267, 765–770. McLeman, M., Pratt, S. & Franks, N. (2002) Navigation using visual landmarks
by the antLeptothorax albipennis.Insectes Sociaux,49, 203–208.
Merkle, J., Fortin, D. & Morales, J. (2014) A memory-based foraging tactic reveals an adaptive mechanism for restricted space use.Ecology Letters,17, 924–931.
Merkle, J.A., Potts, J.R. & Fortin, D. (2017) Energy benefits and emergent space use patterns of an empirically parameterized model of memory-based patch selection.Oikos, DOI: 10.1111/oik.03356.
Mersch, D.P., Crespi, A. & Keller, L. (2013) Tracking individuals shows spatial fidelity is a key regulator of ant social organization.Science,340, 1090–1093. Munger, J.C. (1984) Home ranges of horned lizards (Phrynosoma): circumscribed
and exclusive?Oecologia,62, 351–360.
Naug, D. & Smith, B. (2007) Experimentally induced change in infectious period affects transmission dynamics in a social group.Proceedings of the Royal Soci-ety of London B: Biological Sciences,274, 61–65.
Oster, G.F. & Wilson, E.O. (1978)Caste and Ecology in the Social Insects. Prince-ton University Press, PrincePrince-ton, NJ, USA.
Otterstatter, M.C. & Thomson, J.D. (2007) Contact networks and transmission of an intestinal pathogen in bumble bee (Bombus impatiens) colonies. Oecolo-gia,154, 411–421.
Peron, G., Fleming, C.H., de Paula, R.C. & Calabrese, J.M. (2016) Uncovering periodic patterns of space use in animal tracking data with periodograms, including a new algorithm for the Lomb-Scargle periodogram and improved randomization tests.Movement Ecology,4, 19.
Reichardt, J. & Bornholdt, S. (2006) Statistical mechanics of community detec-tion.Physical Review E,74, 016110.
Richardson, T.O., Giuggioli, L., Franks, N.R. & Sendova-Franks, A.B. (2017) Data from: Measuring site fidelity and spatial segregation within animal socie-ties.Dryad Digital Repository, http://dx.doi.org/10.5061/dryad.fj043. Richardson, T.O. & Gorochowski, T.E. (2015) Beyond contact-based
transmis-sion networks: the role of spatial coincidence.Journal of The Royal Society Interface,12, 20150705.
Richardson, T.O., Christensen, K., Franks, N.R., Jensen, H.J. & Sendova-Franks, A.B. (2011) Ants in a labyrinth: a statistical mechanics approach to the division of labour.PLoS One,6, e18416.
Riotte-Lambert, L., Benhamou, S. & Chamaille-Jammes, S. (2013) Periodicity analysis of movement recursions.Journal of Theoretical Biology,317, 238–243. Riotte-Lambert, L., Benhamou, S. & Chamaille-Jammes, S. (2017) From ran-domness to traplining: a framework for the study of routine movement behav-ior.Behavioral Ecology,28, 280–287.
Rosengren, R. & Fortelius, W. (1986) Ortstreue in foraging ants of theFormica rufagroup–hierarchy of orienting cues and long-term memory.Insectes Soci-aux,33, 306–337.
Rosengren, R. (1971) Route fidelity, visual memory and recruitment behaviour in foraging wood ants of the genusFormica(Hymenoptera, Formicidae).Acta Zoologica Fennica,133, 1–105.
Rosengren, R. (1977) Foraging strategy of wood ants (Formica rufagroup). I. Age polyethism and topographic traditions.Acta Zoologica Fennica,149, 1– 30.
Salo, O. & Rosengren, R. (2001) Memory of location and site recognition in the antFormica uralensis(Hymenoptera: Formicidae).Ethology,107, 737–752.
Schatz, B., Lachaud, J. & Beugnon, G. (1995) Spatial fidelity and individual for-aging specializations in the neotropical ponerine ant,Ectatomma ruidumRoger (Hymenoptera, Formicidae).Sociobiology,26, 269–282.
Schmid-Hempel, P. & Schmid-Hempel, R. (1993) Transmission of a pathogen in
Bombus terrestris, with a note on division of labour in social insects.Behavioral Ecology and Sociobiology,33, 319–327.
Schreier, A.L. & Grove, M. (2014) Recurrent patterning in the daily foraging routes of hamadryas baboons (Papio hamadryas): spatial memory in large-scale versus small-large-scale space.American Journal of Primatology,76, 421–435. Schwarzkopf, L. & Alford, R.A. (2002) Nomadic movement in tropical toads.
Oikos,96, 492–506.
Seeley, T.D. (1982) Adaptive significance of the age polyethism schedule in honeybee colonies.Behavioral Ecology and Sociobiology,11, 287–293. Sendova-Franks, A. & Franks, N. (1995) Spatial relationships within nests of the
antLeptothorax unifasciatus(Latr.) and their implications for the division of labour.Animal Behaviour,50, 121–136.
Sendova-Franks, A. & Franks, N.R. (1993) Task allocation in ant colonies within variable environments (a study of temporal polyethism: experimental).Bulletin of Mathematical Biology,55, 75–96.
Sendova-Franks, A.B., Hayward, R.K., Wulf, B., Klimek, T., James, R., Planque, R., Britton, N.F. & Franks, N.R. (2010) Emergency networking: famine relief in ant colonies.Animal Behaviour,79, 473–485.
Song, C., Koren, T., Wang, P. & Barabasi, A.L. (2010) Modelling the scaling properties of human mobility.Nature Physics,6, 818–823.
Spencer, S.R., Cameron, G.N. & Swihart, R.K. (1990) Operationally defining home range: temporal dependence exhibited by hispid cotton rats.Ecology,71, 1817–1822.
Spencer, W.D. (2012) Home ranges and the value of spatial information.Journal of Mammalogy,93, 929–947.
Stroeymeyt, N., Casillas-Perez, B. & Cremer, S. (2014) Organisational immunity in social insects.Current Opinion in Insect Science,5, 1–15.
Stroeymeyt, N., Franks, N.R. & Giurfa, M. (2011) Knowledgeable individuals lead collective decisions in ants.Journal of Experimental Biology,214, 3046–3054. Sun, L., Axhausen, K.W., Lee, D.H. & Huang, X. (2013) Understanding
metropolitan patterns of daily encounters.Proceedings of the National Acad-emy of Sciences,110, 13774–13779.
Tan, Z.J., Zou, X.W., Zhang, W. & Jin, Z.Z. (2001) “True” self-attracting walk.
Physics Letters A,289, 251–254.
Therneau, T.M. (2000)Modeling Survival Data: Extending the Cox Model. Springer, New York, NY, USA.
Traniello, J., Fourcassie, V. & Graham, T. (1991) Search behavior and foraging ecology of the antFormica schaufussi: colony-level and individual patterns.
Ethology Ecology & Evolution,3, 35–47.
Van Beest, F., Vander Wal, E., Stronen, A., Paquet, P. & Brook, R. (2013) Temporal variation in site fidelity: scale-dependent effects of forage abundance and predation risk in a non-migratory large herbivore. Oecologia, 173, 409–420.
Van Moorter, B., Visscher, D., Benhamou, S., B€orger, L., Boyce, M.S. & Gaillard, J.M. (2009) Memory keeps you at home: a mechanistic model for home range emergence.Oikos,118, 641–652.
Williams, R. & Lusseau, D. (2006) A killer whale social network is vulnerable to targeted removals.Biology Letters,2, 497–500.
Received 16 November 2016; accepted 23 January 2017 Handling Editor: Olivier Gimenez
Supporting Information
Details of electronic Supporting Information are provided below.
Appendix S1.This document (i) contains information about the colony