GLOBAL PLANT CHARACTERISATION
AND DISTRIBUTION WITH EVOLUTION
AND CLIMATE
JAMES NICHOLAS FURZE
Ph.D.
GLOBAL PLANT CHARACTERISATION
AND DISTRIBUTION WITH EVOLUTION
AND CLIMATE
JAMES NICHOLAS FURZE
A thesis submitted in partial fulfilment of the requirements of
the University of the West of England, Bristol, UK
for the degree of Doctor of Philosophy
Engineering, Design and Mathematics / Geography and
Environmental Management
Faculty of Environment and Technology
University of the West of England, Bristol, UK
This copy has been supplied on the understanding that it is copyright
material and that no quotation from the thesis may be published
ABSTRACT
ABSTRACT
Since Arrhenius published seminal work in 1921, research interest in the description of plant traits
and grouped characteristics of plant species has grown, underpinning diversity in trophic levels.
Geographic exploration and diversity studies prior to and after 1921 culminated in biological,
chemical and computer-simulated approaches describing rudiments of growth patterns within
dynamic conditions of Earth. This thesis has two parts:- classical theory and multidisciplinary
fusion to give mathematical strength to characterising plant species in space and time.
Individual plant species occurrences are used to obtain a Species-Area Relationship. The use of
both Boolean and logic-based mathematics is then integrated to describe classical methods and
propose fuzzy logic control to predict species ordination. Having demonstrated a lack of
significance between species and area for data modelled in this thesis a logic based approach is
taken. Mamdani and T-S-K fuzzy system stability is verified by application to individual plant
occurrences, validated by a multiple interfaced data portal.
Quantitative mathematical models are differentiated with a genetic programming approach,
enabling visualisation of multi-objective dispersal of plant strategies, plant metabolism and
life-forms within the water-energy dynamic of a fixed time-scale scenario. The distributions of plant
characteristics are functionally enriched through the use of Gaussian process models. A generic
framework of a Geographic Information System is used to visualise distributions and it is noted
that such systems can be used to assist in design and implementation of policies.
The study has made use of field based data and the application of mathematic methods is shown to
be appropriate and generative in the description of characteristics of plant species, with the aim of
application of plant strategies, life-forms and photosynthetic types to a global framework. Novel
application of fuzzy logic and related mathematic method to plant distribution and characteristics
has been shown on a global scale. Quantification of the uncertainty gives novel insight through
consequent trophic levels of biological systems, with great relevance to mathematic and geographic
subject development. Informative value of Z matrices of plant distribution is increased substantiating sustainability and conservation policy value to ecosystems and human populations
dependent upon them for their needs.
Key words: sustainability, conservation policy, Boolean and logic-based, fuzzy logic, genetic
ACKNOWLEDGEMENTS
IV
ACKNOWLEDGEMENTS
I would like to take this opportunity to express my sincere gratitude to my supervisors, Professor Quanmin Zhu, Associate Professor Jennifer Hill (both from UWE, UK) and Professor Feng Qiao (Faculty of Information and Control Engineering, Shenyang Jianzhu University, China) for their encouragement and guidance during the past three years of my studies. I also give my thanks to colleagues from the Engineering Design and Mathematics and Geography and Environmental Management departments and the staff from the Faculty of Environment and Technology of UWE with whom I share the excellent and comfortable research environment. I am also grateful for the encouragement of staff of the Faculty of Applied Sciences at UWE.
I would like to extend my gratitude to colleagues within the Intergovernmental Panel on Climate Change in Switzerland and the Global Biodiversity Information Facility who provided excellent communication regarding server updates enabling the supply of high quality data to be obtained. I also wish to thank colleagues from the many Institutes and Universities who took part in conference and research events, which I attended throughout my time at UWE.
I am grateful to the financial contributions from the Faculty of Environment and Technology at UWE UK and excellent award schemes at UWE, which I benefitted from.
Most importantly, I must underline that this thesis would not have been possible without the loving support of my family and my wife, I will be indebted to them forever. Thank-you to my parents-in-law and sister-in-law, too.
Finally, I would say “THANK YOU” to Feng Qiao who has acted both as a supervisor during the project and a close friend for many years. This research is the culmination of a life-long personal interest. All friends over my life have contributed in some way, and needless to say I am grateful to you all.
TABLE OF CONTENTS
TABLE OF CONTENTS
ABSTRACT III
ACKNOWLEDGEMENTS IV
TABLE OF CONTENTS V
APPENDICES LIST IX
ABBREVIATIONS X
SYMBOLS XII
1. INTRODUCTION 1
1.1.Motivations 1
1.2.Outline of the thesis 3
1.3.Contributions 5
1.4.Research questions 6
1.5.Published work 7
2. LITERATURE SURVEY 9
TABLE OF CONTENTS
VI
2.2. Plant richness distribution and bio-geography 11
2.3. Qualitative plant life-form description 14
2.3.1. Plant life-history strategies and continuums 15
2.4. Computer generated plant strategy modelling 19
2.5.Quantitative pattern identification 23
2.5.1. Fuzzy logic 24
2.5.2. Genetic algorithms 26
2.5.3. Generative fusion of genetic-fuzzy systems 28
2.6. Knowledge guidance hybrid systems 30
2.7.Summary 33
3. PRELIMINARY METHODOLOGIES 34
3.1.Introduction 34
3.2.Data sources 35
3.2.1. Validation and reasoning for chosen biodiversity sources 35
3.2.2. Climatic and topographic data sources 36
3.2.3. High-resolution data for enhanced accuracy of modelling 38
3.3.Image processing 38
3.4.The Species-Area relationship 39
3.5.Variable partitioning 40
3.6.Groups to distinguish in plant characterisation 44
3.7.Fuzzy logic 49
3.7.1.Mamdani systems 50
3.7.2. Takagi-Sugeno systems 53
3.7.3. Expert intuition 55
TABLE OF CONTENTS
3.8.1. Hybrid systems to explore utopian relations of plant characters 58
3.9. Summary 59
4. THE SPECIES-AREA RELATIONSHIP IN CONTEXT 61
4.1. Introduction 61
4.2. Species-Area relationship implementation 62
4.3. Information-rich modelling 66
4.4. Validation of algorithms and global mapping of plant strategies 73
4.5. Summary 82
5. USING FUZZY LOGIC CONTROL TO ORDINATE PLANT STRATEGIES 84 5.1. Introduction 84
5.2. Takagi-Sugeno-Kang modelling of plant strategies 85
5.3. Fine-scale resolution data enhances model formation 87
5.4. Implementation of fuzzy logic control to predict species occurrence 92
5.5. Summary 98
6. STOCHASTIC PROCESSES TO MODEL UNCERTAINTY 100
6.1. Introduction 100
6.2. Fuzzy-genetic programming of plant life-history strategies 103
6.2.1. Nodal structure and algorithmic detail 107
6.3. Fuzzy-genetic programming hybrid methodology 109
TABLE OF CONTENTS
VIII
6.4. Multi-objective dispersal of plant strategies and metabolism 112
6.4.1. Linear and quadratic rules of multi objective dispersed elements 115
6.5. Summary 118
7. PLANT LIFE-FORM DISTRIBUTION AND INSTRUCTIVE GEOGRAPHIC INFORMATION SYSTEMS 120
7.1. Introduction 120
7.2. Using DEM and climatic data to substantiate T-S-K systems 122
7.2.1. ANFIS and efficiency of reduced model components 127
7.3. Multi-objective optimisation selection and dispersal of plant life-forms 132
7.3.1. Functional approximation within utopia of plant life-forms 136
7.4.ANFIS based algorithms control strategy of plant strategies, plant metabolism and plant life-forms 139
7.4.1. Functional approximation algorithm for plant communities 143
7.5.Geographic information systems - applying plant characterisation 144
7.5.1. Recommendations for policy formation using mathematical method 147
7.6. Summary 149
8. FUTURE RESEARCH WORK AND CONCLUSIONS 151
8.1. Thesis Summary 151
8.2. Answering the research questions 152
8.3. Future research directions 156
TABLE OF CONTENTS
REFERENCES 161
APPENDICES LIST
APPENDIX 1. Data and citations of collections for each example location used
APPENDIX 2. Algorithmic statements for Guyana, Cuba, Democratic republic of the
Congo (Africa), Georgia (Southern Europe), Guinea (Africa) and Macedonia (Southern Europe)
APPENDIX 2.1. Example Matlab (Version 2010a ©) code using downloaded IPCC file
APPENDIX 2.1.1. Example Matlab (Version 2010a ©) code using USGS DEM data,
GTOPO30
APPENDIX 2.1.2. Additional Matlab (Version 2010a ©) programming code to modify
axis of DEM images
APPENDIX 2.2. Mamdani FL system surface area
APPENDIX 2.3. Matlab (Version 2010a ©) code for T-S-K (E2)
APPENDIX 2.4. 16 Rules for Macedonia, E7, Life-forms
APPENDIX 3. Climatic and DEM data for E1, E2, E3, E4, E5, E6, E7
APPENDIX 4. 2-Dimensional and 3-Dimensional surface of E2, T-S-K
APPENDIX 5. Matlab (Version 2010a ©) code for MOGA
APPENDIX 5.1. 19 Rules for Azerbaijan, E6 plant strategies ANFIS
APPENDIX 5.2. Cuba, E3 ANFIS (3 input variables) diagram
APPENDIX 5.3. Residual variance plot of Cuba MOGA
APPENDIX 6. MOGA Pareto plot for strategies
APPENDIX 6.1. MOGA Pareto plot for life-forms
APPENDIX 7. Matlab (Version 2010a ©) code for life-form MOGA process
APPENDIX 7.1. Utopia Line and Curve rules for life-forms
APPENDIX 7.2. Matlab (Version 2010a ©) code for Rastrigin’s function
APPENDIX 7.3. Lesser number of characters Rastrigin’s function
APPENDIX 7.4. Expanded probability of 18 life-forms
ABBREVIATIONS
X
ABBREVIATIONS
Abbreviation Description
ANFIS Adaptive Neural Fuzzy Inference System
C3 3 Carbon photosynthetic pathway
C4 4 Carbon photosynthetic pathway
C Competitive strategy
CA Cellular Automation
CAM Crassulacean Acid Metabolism
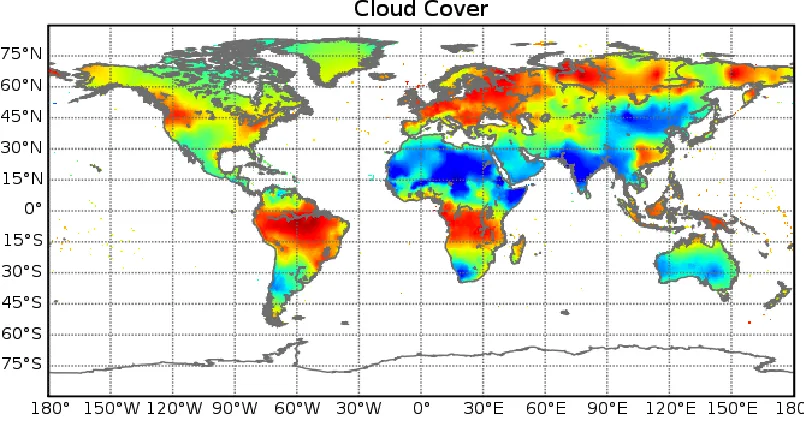
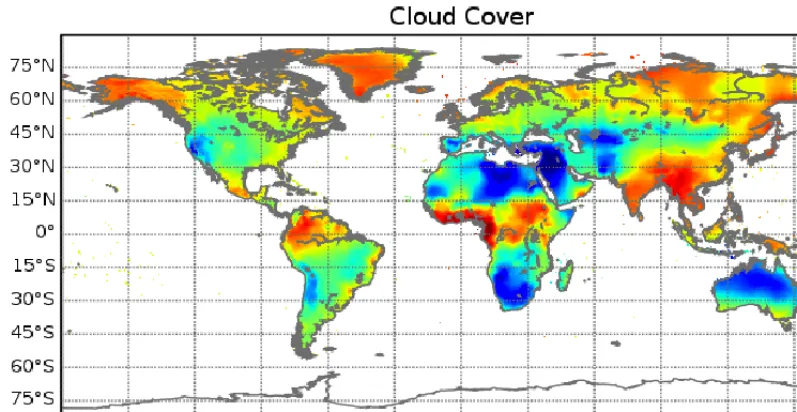
CC Cloud Cover
CIA Central Intelligence Agency
DEM Digital Elevation Model
DZ Diversity Zone
E Environment
EC Evolutionary Computation
EDA Estimation of Distribution Algorithm
eR Rule Based
F Function
FAA Functional Approximation Algorithm
FCM Fuzzy C Means
FL Fuzzy Logic
FLB Fuzzy Logic Based
FLC Fuzzy Logic Control
FRBS Fuzzy Rule Base System
FSPM Functional Structural Plant Model
GA Genetic Algorithm
GARP Genetic Algorithm for Rate set Prediction
GBIF Global Biodiversity Information Facility
GFF Ground Frost Frequency
GFRBS Genetic Fuzzy Rule Base System
GIS Geographic Information System
I Moran’s I
IFNIS Intuitionistic Fuzzy Negative Ideal Solution
IFPIS Intuitionistic Fuzzy Positive Ideal Solution
IFS Intuitionistic Fuzzy Set
IPCC Intergovernmental Panel on Climate Change
ABBREVIATIONS
K K strategist
KB Knowledge Base
Km Kilometre
Kp K proximity
L Lindenmayer
Log Logarithm
M Metre
MaxTemp Maximum Temperature
MCDM Multiple Criteria Decision Making
MeanTemp Mean Temperature
MinTemp Minimum Temperature
MOGA Multi-Objective Genetic Algorithm
MOO Multiple-Objective Optimisation
MSPM Mutable Single Plant Model
NIS Negative Ideal Solution
P Precipitation
PEP Phospho Enol Pyruvate
PIS Positive Ideal Solution
R r strategist
R Ruderal strategy
rK Relative to K strategy
Rp r proximity
RUBISCO Ribulose-bis Carboxylase Oxygenase
S Second
S Stress-tolerant strategy
SAR Species Area Relationship
TOPSIS Technique for Order Preference by Similarity to Ideal Solution
T-S-K Takagi-Sugeno-Kang
UNEP United Nations Environment Programme
USGS United States Geological Survey
VP Vapour Pressure
WDF Wet Day Frequency
SYMBOLS
XII
SYMBOLS
1
Geographic
Symbol Definition
o
Degrees
A Area in the SAR equation
C Environmental constant specific to geographic area
m Number of species
Xi,k The abundance of the kth species in quadrat/sample i
Xj,k The abundance of the kth species in quadrat/sample j
S Number of species in SAR equation
Z Taxon specific constant
2 Distribution
Symbol Definition
≥ Greater than or equal to
≤ Less than or equal to
∂ Differential
∞ Infinity
T Lambda, specifying occurrences in a specified time interval
m Mean of the distribution
1
Inverse function of one dimensional Gaussian function
G Generator of the distribution
r Multivariate Gaussian distribution with correlation rπ Pi, 3.14’
Standard deviation
2 Variance
a, b, c Intervals a, b, c
C Copula
f(x) Function of x
H Multivariate distribution function
SYMBOLS
XIII
k! Factorial of constant k
Max Maximum
Min Minimum
Pr Probability
T Students t statistic
u(u1,u2,...,un) Universe equal to universal set values
3 Logic
Symbol Definition
Subset
And
Error
For all
∫U Union of fuzzy singletons
Multiplier Undefined data / operation usually repeat iterations
* Multiplication operator
µ Grade of membership
Precedes
∑ Summation
A(x,y) Antecedent variables (x, y)
B Consequent variable
D Decision variable
Dom Dominant
n i1,2,...,
Crisp value
j1,2,...,m
Crisp value
Lim Limit
R Relational Index
x Mean of x
Xi Data set, universe of discourse of xi
xiXi Fuzzy system input element of Xi
y Mean of y
Yj Data set, universe of discourse of yj
SYMBOLS
XIV
Introduction CHAPTER 1
CHAPTER 1
Introduction
1.1
Motivations
Plant characterisation is a multi-disciplinary subject, there being classical/historical and modern approaches to the main subject area. Areas of relevance are plant exploration, bio-geographic and species distribution patterns, qualitative vegetation description, metabolic pathways, and plant life-history based strategies. Globally there are ambiguities in distribution of species and their functional groups, as many traits of the species and the conditions in which they exist exhibit uncertainties in structural and conditional relations in time and space.
Introduction CHAPTER 1
2
of any systems elements. Modelling plant species elements and distribution using engineering based techniques may reduce uncertainties and enable inferences clarifying the importance of plant species in trophic systems and provide structure more prone to analysis and prediction than previous methods. Although modelling species on a global level seems impossible as there are too many uncertainties and parameters, this study presents a simplified model of the global earth system with mathematical, biological and geographical foundation (Furze et al., 2013d). In considering the applications of this study the author would primarily like to underline that plants are one of the main kingdoms of life. They are primary producers and their importance therefore filters through every level of research and life existing on the planet by the same principle of trophic levels within ecosystems (Kreft et al., 2008; Wright, 1983). Measuring the impact of the global characterisation of plants, therefore, may be seen to be an asymptotic exercise. However, the following provide some of the benefits in research terms: expanding the knowledge base of plant science and furthering demographic studies of areas previously only studied from pure numeric estimation with a more systematic foundation. Modelling forwards (with experimental use of different scenarios of climatic data) enables an accurate prediction of plant distribution with climate change to further add to environmental models. Using fuzzy logic in this way reduces error, which may be present in methods previously used (Kreft and Jetz, 2007), and further specifies novel categories of plant distribution patterns.
In the design of control systems with structural uncertainties, variable parameters and dynamic relations the designer usually tries to minimise the perturbations with the use of a detailed mathematical model combined with solid statements of a historical and scientific nature in order to form certainties. One approach for this kind of non-linear control design is the use of differential methods in order to form closed loop systems. Control algorithms and generative mathematic method are key in the description of evolving and dynamic conditions in which species and their external influences are based. Such methods constantly monitor the relevant data patterns and change the numerical distributions by integrating an intuitive nature with a residual knowledge base.
Introduction CHAPTER 1
present summaries of data within geographic information systems. However the use of sophisticated control theory has not been employed.
The motivation for the research work for this thesis is to characterise primary producing elements (plants) of trophic systems thereby revealing keys to sustainability and stability of ecological networks within a dynamic system; to define characters of plants under the principal descriptors of plant life history strategy (Grime et al., 1995), life-form (Raunkier, 1934) and metabolic pathway. The author was further motivated to produce a modelling framework to determine the numerical distribution of the above within time and space, in order to understand and better respond to increasing human, biotic and abiotic pressures imposed on plant species.
It is the author’s belief that uniting engineering based mathematic technique with bio-geographic methods reduces uncertainty and provides a predictive ability, which may facilitate policy formation at a national and international level. Additionally, the author recognises that interdisciplinary unification of mathematic, scientific and qualitative methods provides a synergistic function, which generates evolution of knowledge bases related to the component disciplines.
1.2
Outline of the thesis
This thesis contains eight chapters. Chapter 1 introduces the thesis. The main body of the thesis can be classified into two parts. The first part includes Chapters 2-4, which concentrate on theoretical studies and classical approaches. The second part includes Chapters 5-7, which each have particular focus dealing with the application of fuzzy logic control to describe species patterns, stochastic methods defining life history based strategies / life form / metabolism and geographic information system structural capability in order to answer research questions and to thereby inform policy formation. Chapter 8 concludes the thesis. The thesis outline is itemized as follows:
Introduction CHAPTER 1
4
Chapter 2. The literature survey covers classical methods of plant characterisation,
scientific categorisation and background of control theory to deal with the diverse nature of plant elements offering examples of different approaches.
Chapter 3. The essential knowledge and principal methodology related to the research
work of this thesis is set out, and some clarification and conceptual definition is given.
Chapter 4. The classical species area relationship is applied in context and description of
plant distributions in global locations are given. The deficiency of this approach is shown in statistical terms, substantiating the use of subsequent mathematic technique.
Chapter 5. Fuzzy logic control algorithms are constructed to provide information rich
modelling of plant species variation, relevant variables are minimised and the stability of the algorithms is verified and validated using large scale experimental data.
Chapter 6. The adaptive fuzzy logic control brought about by Chapter 4 and implemented
in Chapter 5 is further developed through stochastic processes, which may be used to model uncertainty within the utopia plane of primary producers.
Chapter 7. The application of fuzzy logic and hybrid genetic programming to construct
geographic information systems is detailed and research questions of life history strategies, life-forms and metabolism are answered. Further, the process of geographic information system design is used to inform ecological sustainability and policy formation.
Chapter 8. Research questions are revisited, future research work is proposed and
Introduction CHAPTER 1
1.3
Contributions
The main contributions of this thesis are summarised as follows:
Subject to a comprehensive literature survey in the research area, concepts and definitions of the related subjects are revisited and resolved with critical justifications and revisions to improve the descriptions and examples from a novel perspective.
Classical, qualitative methodology is elucidated in multiple locations and is subjected to statistical testing to underline the necessity for quantitative analysis, original use of Mamdani and Takagi-Sugeno-Kang rule bases are explained and optimisation methods detailed in order to cater for multiple categories of plant elements on a global scale.
Novel adaptive neural fuzzy logic control systems are designed for named locations and the rule bases are minimised to increase efficiency. Following numerical simulation and categorisation using validated global climatic data, the fuzzy logic schemes are tested in alternative locations in order to illustrate the robustness.
Control systems are simulated to combine detailed description of high-resolution bio-geographic data with genetic methods enabling original predictive function within the hyper-plane of primary producers. ANFIS and hybrid GA are suggested to inform geographic information systems.
The structural basis of Geographic Information Systems (GIS) is used to query dynamic global modelling of plant characteristics, including life-forms and metabolism. Original inferential relations to ecological network stability and recommendations to national policy formation securing sustainability are made.
Introduction CHAPTER 1
6
1.4
Research Questions
Research questions addressed in this thesis were:
RQ. 1. Is it possible to predict the global occurrence of plant species and if so, what
is the most efficient form of prediction? (Addressed in Chapters 4 and 5).
RQ. 2. How can the trade off between accuracy and interpretability of predictive
models be balanced? (Addressed in Chapter 5).
RQ. 3. What sub-groups of plant characters should we differentiate to give
adequate informative value to different subject areas in terms of plant characterisation? (Addressed in Chapter 6).
RQ. 4. How are functional groups of plants distributed a) mathematically, b)
geographically? (Addressed in Chapter 6 and 7).
RQ. 5. Can we make predictions of climatic conditions using the occurrence of
plant species and if so, how? (Addressed in Chapter 7).
RQ. 6. Given that we can develop geographic information systems of plant
characters with a refined mathematical basis, what further conclusions for conservation and sustainability policy formation may be made? (Addressed in Chapter 7).
RQ. 7. Is there a required structure of groups of plant species in ecosystems to
enable stability within a dynamic climatic system, if so, can we use a mathematical function to show this? (Addressed in Chapter 7).
Introduction CHAPTER 1
1.5
Published work
The papers published during the period of my studies at UWE are listed below:
1) J. Furze, Q. Zhu and F. Qiao, ‘Collaborative proposal development towards
sustainable communities’, Global Education Magazine, Human Rights Day, Issue No.
6, pp. 28-32, 10 Dec. 2013.
2) J. N. Furze, Q. Zhu, F. Qiao and J. Hill, ‘Functional enrichment of utopian distribution of plant life-forms’, American Journal of Plant Science, Vol. 4, No. 12A, pp. 37-48, 2013.
3) J. N. Furze, Q. Zhu, F. Qiao and J. Hill, ‘Utopian exploration of global patterns of plant metabolism’, Proceedings of the Fifth International Conference on Modelling,
Identification & Control (ICMIC 2013), Cairo, Egypt, pp. 47-52, Aug 31st-Sept. 3rd,
2013.
4) J. Furze, Q. Zhu and J. Hill, ‘The use of plant characterisation modelling studies to substantiate national conservation and sustainability policies’, Global Education
Magazine, International Day of Democracy, Issue No. 5, pp. 68-75, 15 Sept. 2013.
5) J. N. Furze, Q. Zhu, F. Qiao and J. Hill ‘Linking and implementation of fuzzy logic control to ordinate plant strategies’, International Journal of Modelling, Identification
and Control, Vol. 19, No. 4, pp. 333-342, 2013.
6) J. N. Furze, Q. Zhu, F. Qiao and J. Hill, ‘Mathematic methods to quantify and characterise the primary elements of trophic systems’, International Journal of
Computer Applications in Technology, Vol. 47, No. 4, pp. 314-325, 2013.
7) J. N. Furze, Q. Zhu, F. Qiao and J. Hill, ‘Implementing stochastic distribution within the utopia plane of primary producers using a hybrid genetic algorithm’, International
Introduction CHAPTER 1
8
8) J. N. Furze, Q. M. Zhu, F. Qiao and J. Hill, ‘Facilitating description of fuzzy control algorithms to ordinate plant species by linking online models’, Proceedings of the Fourth International Conference on Modelling, Identification & Control (ICMIC
2012), Wuhan, China,pp. 933-938, June 24-26, 2012.
9) J. Furze, J. Hill, Q. M. Zhu and F. Qiao, ‘Algorithms for the characterisation of plant strategy patterns on a global scale’, American Journal of Geographic Information
Systems, Vol. 1, No. 3, pp. 72-99, 2012.
10) J. Furze, Q. M. Zhu, F. Qiao and J. Hill, ‘Species area relations and information rich modelling of plant species variation’, Proceedings of the 17th International Conference
Literature Survey CHAPTER 2
CHAPTER 2
Literature survey
2.1
Introduction
The nature of plant characterisation is multidisciplinary, consisting of different subject areas that are generative in producing new areas of study. Although it would be difficult to provide complete reference of all areas that have contributed to progress within the subject, the author attempts to provide a balanced view of the areas that are of relevance to ongoing research and progress within the subject. This chapter is important because it presents a clear picture of the frontier for research work and justifies the necessity for potential concept/technique development in the thesis.
Literature Survey CHAPTER 2
Chocó region and Andean forests of Columbia, South America as one of the mega centres of plant diversity:
‘Die dem Äquator nahe Gebirgsgegend ... von Neugranada [today: Columbia] ... ist der
Teil der Oberfläche unseres Planeten, wo im engsten Raum die Mannigfaltigkeit der
Natureindrücke [today: biodiversity] ihr Maximum erreicht’ [Humboldt (1845), p. 12].
(English translation by Otté (1860, p. 10): ’The countries bordering on the equator [meant
is the present-day country of Colombia] possess another advantage ... This portion of the
surface of the globe affords in the smallest space the greatest possible variety of
impressions from the contemplation of nature [today: biodiversity]’ (Barthlott et al, 2005).
Humboldt (1808) hypothesized explanations for this diversity including complex
topography and the variety of suitable climatic conditions in the Chocó region. He made the statement that plant richness declines at higher latitudes due to the fact that many
species are frost intolerant and may not survive in the comparatively cooler temperatures
of temperate zone winters, substantiating the water-energy dynamic (Wright, 1983).
Wright continued that plant productivity is limited primarily by energy from the sun and
water availability. He added, however, that the solar energy that transfers through each
trophic level is what constrains richness as opposed to the total energy within a geographic
area (Hawkins, 2003; Jetz et al., 2009; Wright, 1983).
Addressing these issues, this chapter is organised as follows: species richness distributions and bio-geographical approaches are outlined in section 2.2. Life-form categorisation and plant life-history strategies are detailed in section 2.3. The use of computer generated modelling of plant strategies is covered in section 2.4. Quantitative methods of pattern identification are explored in section 2.5, with an elaboration of fuzzy logic, genetic algorithms and the fusion of these two methods included in subsections. Knowledge guidance underpinning intuition in evolving systems of plant strategy estimation is laid out
Literature Survey CHAPTER 2
2.2
Plant richness distribution and bio-geography
Barthlott (1996) used the term geo-diversity to describe the reasoning behind plant distribution patterns, geo-diversity being the variety of earth materials and processes that make up and shape a specific area of the Earth itself. Estimations of species numbers and their fundamental descriptions were greatly enhanced by the work of Russian geneticist Nikolay Vavilov (1926), his major work being on the ‘Centres of Cultivated Plant Origins’. Vavilov covered India, China, Indo-Malaya, Central Asia, the Mediterranean, the Near East, Ethiopia, South Mexico/Central America, and South America. The work of
Vavilov provided the basis for a great Russian tradition, with the quantitative nature of his
genetic approach facilitating later thinking on diversity mapping (Barthlott et al. 1996;
Barthlott et al. 2005; Malyshev, 1975; Wulff, 1935).
There are two main approaches to producing maps of species richness; these are taxon and
inventory based. The more accurate of the two approaches is taxon based, being maps of a
species or higher taxon compiled from detailed sources of distributional information. The
information may be gained from gridded maps, locality data from natural history
collections or from expert drawn ‘polygon’ maps (Barthlott et al., 2007). The most detailed
taxon based maps may extend to include field data of a particular species or group of
species and in some cases this may include every single individual within the studied area.
In inventory based mapping summary data of the floras of different countries or areas
(geographic units) have been used in analyses (Mutke and Barthlott, 2005).
The methods of Barthlott and his group have become key in the estimation of numbers of species and their mapping in different areas. Recently, Barthlott has seminally published on numbers of plant species on a global scale (Barthlott et al. 2005). This work showed great progression from the times of Arrhenius and his expression of the power model of the species-area relationship (Arrhenius, 1921).
Literature Survey CHAPTER 2
number estimation, is 10000km2. Surveys are typically carried out in measured areas (usually square) called quadrats. Quadrat size varies with the type of vegetation. The size of the measured area doubles until no further new species are found. The most effective size following this method in Barthlott et al. papers above was 10000km2 when measuring vegetation on a global scale. Numbers of species at this resolution were measured in thousands. The beauty of Barthlott’s approach was that it enabled description of areas on a global scale in terms of diversity. In a series of papers, progressing to the present day, members of the group of the Institute for Biodiversity of Plants, at the University of Bonn in Nees, Germany, where Barthlott is located, described ‘diversity zones’ (DZ). Indeed, Barthlott et al. (2005) proposed a leading description of over twenty different locations, covering description of the zones in which over 3000 species/10000km2 were found. The most prominent climatic, geologic and floristic features of the 20 diversity zones (DZ) were given. Areas within DZ 8-10 were detailed, providing an invaluable reference, which is made use of in this study. Increasingly advanced methods are used to monitor plant diversity and its interaction with various patterns that are present at a global scale. The top 5 centres of diversity were described as those that have greater than 5000 species per 10000km2 (DZ 10). Examples were Costa Rica-Chocó, Tropical Eastern Andes, Atlantic Brazil, Northern Borneo, and New Guinea (Barthlott et al., 2005; Mutke et al., 2010).
The work of Barthlott, and many others, can be said to be foremost in the development of geographic information systems (GIS). A GIS is any system that captures and summarises information about any geographic area (Trauth, 2006). Work on species distribution mapping therefore describes the remit of GIS. Today GIS systems are increasingly complex and may store and utilise vast amounts of information of many qualitative and quantitative types for species. One of the foremost ecological systems stored and updated electronically by multiple interfaces (users) is the Global Biodiversity Information Facility (GBIF).
Literature Survey CHAPTER 2
suited only to the conditions of the island (Kier et al., 2009). Whatever the nature of the relationship between endemism and species richness, it was seen as a truism that studies of endemism have great value in assessing relationships between and within species groups (Kreft et al., 2006) and, further, the effect of land use changes on species distribution (Barthlott et al. 2005). In an analysis of plant distribution and floristic knowledge it has been found that land-use change (‘the human footprint’) is very rarely positively associated with species richness (Kier et al. 2005). The analysis of species richness on islands was particularly useful in identifying environmental determinants, equilibrium theory and the high level of significance of the water-energy dynamic on biodiversity patterns per se (Kreft et al. 2008; Mutke and Barthlott, 2005). This is a currently developing field.
Areas with extremely high levels of diversity in the equatorial regions (particularly in South America) were also of great use in assessing the nature of the factors that drive diversity due to the unique combinations of water and energy related factors. Such locations contained species within complex ecological (e.g. neophytic) relationships and extraordinary high levels of growth (Bass et al., 2010; Gentry and Dodson, 1987; Kreft et al., 2004; Kreft and Jetz, 2007; Silvera et al., 2009). It is difficult to measure the great contribution that studies in these areas have had, both on the people of the areas and the protection status of species within the areas. Such areas have become increasingly vulnerable to human development due to the high levels of species richness and variation in all the major kingdom groups there and also due to the mineral (e.g. fossil fuels, oil) reserves found there (Bass et al., 2010).
Literature Survey CHAPTER 2
2.3
Qualitative plant life-form description
It was a remarkable coincidence that at roughly the same time as Wulff (1935) was making great progress in the mapping of species on global scale, a Danish Botanist called Raunkier (1934) was advancing the theory of describing plant form over different geographic patterns.
It is incredible that such an early theory, which appears to remain for the most part in its original state, is still of great relevance today in descriptions of plant communities. Gradients are often analysed and shown to have significantly different proportions of Raunkier life-forms. The latitudinal gradient has recently been restated in terms of plant life-form differing across Burkina Faso (Schmidt et al. 2005), a study in which a combination of field and herbarium data were used for increased accuracy. In the drier areas of northern Burkina Faso the number of therophytes was seen to be highest; towards the more humid southerly areas the number of hemicryptohytes and phanerophytes increased. The categorisation shows its flexibility and robust quality for inferring climatic data when it was again used across the Himalayas in Eastern Nepal (Bhatterai and Vetaas, 2003). Variation was shown along a subtropical gradient, highlighting the importance of water and energy in the distribution and plant species richness of such areas. This thesis makes great use of displaying results in 3 dimensions in order that the above effect can be clearly visualised, quantified and differentiated. Dimensions of x, y and z planes are proposed to stress the water-energy dynamic effect.
Literature Survey CHAPTER 2
cases, as it was difficult to transfer due to climatic patterns in effect across large bodies of land such as Europe and not across smaller islands such as the United Kingdom (Hill et al., 2000). The method of Hill et al. (2000) was, in summary, a two way weighted averaging followed by a local regression of values.
Using the method of Hill et al. (2000) it was possible to repredict values from a British sample. However, discrepancies arise between the values obtained from the study of Hill as compared to Ellenberg. These were due to different ecological requirements of the species measured, differences in microhabitats of the species, sampling error (due to human bias for homogenous sample areas), including species that were not closely associated and too large a sample area being used resultantly misleading values were obtained. Indeed, there were great problems with linking indicator values to direct measurements, particularly where a range of habitats or a large number of species were being measured (Hill et al., 2000). Difficulties were due to a shift in species behaviour across environmental gradients. A different scale may be used or refined definition to the same scale. Competition may be seen to vary in different environments. Additionally, species may be selected differently across different habitat types (Godefroid and Dana, 2007). Massant et al. (2009) combined GIS with an extrapolation of plant strategy values on a scale larger than 50m2, made use of graph analysis to determine the spatial aggregation of strategies, logistic regression and elegantly used Ellenberg values in discussion of the differences between vegetation structure and strengthened the argument for plant strategies (Massant et al., 2009). The latter study also made use of conventional Boolean statistics in order to differentiate between the biotypes of plant strategies. Plant strategies are further discussed in the next section.
2.3.1
Plant life-history strategies and continuums
Literature Survey CHAPTER 2
The environment may infer the strategy and vice versa. Furthermore, in a description of the usefulness of plant strategy it was stated “Understanding the distribution of plant species
across environmental gradients requires bringing theories together regarding the
construction of plants, as well as their interactions with the environment, and the assembly
of communities” [Craine (2005), p. 1041]. The possible flaws and merits of the plant
strategy theories of Grime and Tilman, were given full discussion by Craine (2005; 2007).
Craine recognised that both authors have developed exemplary theories regarding natural
selection, the strategies of plants and the functioning of ecosystems. The question of
nutrient availability and resource allocation (light) was key in Craine’s critique of Grime’s
strategies. Craine accepted that high nutrient availability enables the dominance of C
strategy, and low nutrient availability enabled the dominance of S strategists. Craine
considered that Grime’s theory does not cater for low nutrient supply at constant rates,
rather he recognised that a spectrum of the strategies exists. The traits of species of each
strategy allowed more than one strategy to be adopted at highly variable nutrient resource
rates. Considering S strategy adaptability to low levels of light, Craine stated that amongst
certain groups of species S strategies alternatively be stated as C strategists due to the fact
that species more tolerant to low levels of light were, in fact, better competitors in relative
terms. Craine (2007) limited his arguments of Grime’s strategies and did not consider the
mixture of strategies that clearly occur, especially given varying levels of water and energy
factors. This thesis concentrates on the above matter in Chapter 5 answering RQ 1 and 2.
Craine (2007) criticised Tilman’s strategy theory as having placing too much importance
on modelled strategies and did not recognise that Tilman provides sufficient evidence in
support of his models. Craine (2007) did recognise that future paradigms of strategies must
combine elements of both Grime and Tilman, which is what we saw in the development of
Massant et al. (2009) and this thesis progresses this development yet further in order to
predict the numbers of species in strategy based environments.
Literature Survey CHAPTER 2
of chromosomes, numbers of sets of chromosomes). Some or all of these factors may vary in different environments, requiring that the criteria for plant strategy characterisation are clearly stated in the specific studies where it is applied (Grime et al., 1995; Hodgson et al., 1999; Kraft et al., 2008; Massant et al., 2009; Mustard et al., 2003).
In accordance with the original definition of Grime et al. (1995) it was logical to attempt or to predict specific definition within the patterns of plant species as genetic characteristics are distributed in this way (Hunt and Colasanti, 2007). This was made use of by Massant et al. (2009), where spatial patterns are considered on a meso scale (larger than 50 m x 50 m). Clustering of the strategies was found which was then explained using available environmental factors. In an aggregated pattern, the strategies showed non-random and unequal distribution. Using multi-variate statistical methods, ‘clouds’ of data were shown, which indicated the formation of definite ‘biotopes’ (areas in which certain strategies predominate). Biotopes were seen to form both in accordance with habitat and disturbance (e.g. high competitive values indicated competitive (C) biotopes found under pine; stress tolerant plants (S biotopes) were found under mixed oak-beech and pure beech stands of 100 to 150 years old; and ruderal plants (R biotopes) were found nearest roads). Detrended component analysis should be employed with caution when used with environmental data (Grime et al., 1995) due to the ‘arching effect’ of data trends on the resulting analysis. Massant et al. (2009) also relied on several methods of analysis (variance values of C, R and S, with defined measurement positions of samples, logistic regression giving probability of C, R and S, calculation of weighted averages, rank order of Ellenberg values) before making their conclusions. The work provided a useful linear interpolation of
plant strategy, converting into 3 dimensions: C = (10,0,0); S = (0,10,0); R =
(0,0,10); in intermediates S-R, C-S-R, C/C-S-R, etc. the C-S-R values sum to 10.
On consideration of Grime’s strategies in Quercus cerris L. var. cerris woodland in Samsun, northern Turkey, Kilinç et al. (2010) stated that the categorisation was considered appropriate as habitat diversity and environmental factors were present in different combinations, equating to various functional modifications in plants. The study found that plant species conformed to definite strategies and it further confirmed that plant traits are subject to key factors of competition and disturbance in their selection. However, using the classical predictor values described by Hodgson et al. (1999) was not appropriate for
Ruscus aculeatus due to the stem being the photosynthetic organ as opposed to the leaf
Literature Survey CHAPTER 2 water in their leaves may also be mis-classified due to the classification requiring
calculation of specific leaf area and leaf dry matter. The problem also exists for species
adapted to live in very shaded and high salt environments. This is also in accordance with
the conclusions of Hodgson et al. (1999) and it was recommended that future application
of strategies should be by different calculation using more robust methods (Kilinç et al., 2010).
Allowing for progression of the theory as identified by Craine (2005; 2007), and adjusting methods or combining analysis as in Massant (2009), Kilinç et al. (2010) showed that further application of plant strategies is a powerful approach in describing vegetation at a range of scales. The idea of plant strategies is a very elegant approach that may be seen as logical, compared with another approach which categorised strategies of plants and other species, the rK strategy theory of MacArthur and Wilson (1967).
Literature Survey CHAPTER 2
use of Grime’s theory in simulation modelling, although the application of similar models in the context of rK is one that was useful in current (and future) distribution prediction (Barreto, 2008), and is developed in this thesis. Simulations of strategies are discussed in the following section.
2.4 Computer generated plant strategy modelling
Mustard et al. (2003) recognised that 3 main strategies exist for plants, as proposed and supported by Grime et al. (1995), and they acknowledged that environmental factors correlate strongly with the main axes of strategy variation (resources and disturbance). However Mustard et al. (2003) continued in their analysis and concluded that the nature of predictability for evolutionary outcome was as yet undefined. Increased definition may help to assert the primary drivers of plant strategy variation. Mustard et al. (2003) studied the evolution of model plant populations in environments, the object of their study was to determine whether the previously described plant strategies would evolve, and to ascertain whether the pattern was consistent with previously described theoretical and field evidence. After simulating nitrogen availability and disturbance frequency alone, they observed the emergence of 3 distinct strategies.
Literature Survey CHAPTER 2
mutation such that 1/29 of the traits mutated for every new seed produced. Structurally, the model plants consisted of a stem, leaves and nine roots all determined by specified mathematical relationships. The model simulated natural selection for plant strategy and resulted in improved reproductive performance in the simulated environment. The model developed was therefore biased towards r or ruderal selection due to the exclusion of the other limiting factors listed above. However, Mustard et al. (2003) were able to suggest that plant strategies emerge in changing conditions of resources and disturbance. They provided a highly valid modelling tool that could be made use of in the future to indicate different features of populations over time.
The use of computer modelling as a tool to monitor plant growth was further developed by Hunt and Colasanti (2007). They set the aim of identifying the ‘centre of organization’ of plants in response to environmental stimuli. To ascertain whether plants can be self-assembling, Hunt and Colasanti proposed the use of a cellular automation (CA) model of plant growth, comprised of identical ‘modules’ making up branching structures of the whole plant. The modular activity was driven by morphological, physiological and reproductive rule-sets, which were derived from comparative plant ecology. Experimentation with the virtual plants showed a wide range of whole plant, population and community level responses. Impressively, it is concluded that a C-S-R version of the CA model simulated the most essential properties of natural vegetation and its inter-relationship with environment. Hunt and Colasanti (2007) recognised and defined the 7 combinations of plant strategies in terms of three groups of factors: morphological, physiological and reproductional. CA is currently being used to investigate trophic levels beyond the plant environment interface.
Literature Survey CHAPTER 2
K strategist. Thus, for the r (ruderal) archetype Kp=0, and for the K (competitive) archetype Kp=1 (Barreto, 2008).
Bornhofen and Lattaud (2008) made use of strict definition of Grime (1995) in prescribing the evolution of C-S-R strategies in virtual plant communities using artificial life concepts. They developed the work carried out by Mustard et al. (2003), using a mutable model of single plant growth. Bornhofen and Lattaud (2008) recognized that the model is restricted in its parameters and therefore gave only a highly simplified morphology, unable to evolve.
To progress, Bornhofen and Lattaud (2008) made use of an alternative approach, moving towards the use of ‘L-systems’ (programmed visual systems with defined morphology) in evolutionary plant modelling. L-systems (Lindenmayer systems, Lindenmayer (1968)) were developed greatly by Damer et al. (1998) in the form of ‘The Nerve Garden’, a computer application that allowed users to grow and interact with virtual plant communities created in online worlds. Ebner (2006) showed the development of competitive aspects of virtual plants in response to light and noted that the use of interacting algorithms enabled co-evolution in virtual plant communities. In virtual communities, functional structural plant models (FSPM) were a developing form of mutable single plant model (MSPM). FSPM combined morphology with physiological processes based on artificial life concepts, and produced 3-D architecture combined with resource assimilation, flow and allocation. An artificial genome was described as the mutable code which has morphological aspects and physiological processes. Similar to a real life scenario, the code was acted on by evolution and favoured individuals adapted to the selection process (Bornhofen and Lattaud, 2008). Using an ‘L-system alphabet of the used plant model’ and a defined environment in which rules are set out for development of plant phenotype, genotype and life cycles, experiments were carried out simulating evolutionary adaptations in environments with heterogeneous levels of disturbance and mineral stress. Propagation dynamics of the resulting population of virtual plants was measured, as were physiological and morphological adaptations. Plant strategies were visualized using multi-variate analysis of the data.
Literature Survey CHAPTER 2
ruderals were evolved with high growth rates, their selection favoured high resource use, which accelerated their life cycle. The collection of traits of ruderals also matched the life history strategies of r-selected plants (Barreto, 2008; Pianka, 1970). Stress tolerators evolved the longest life span, with slow growth and reproduction due to few soil resources.
As well as distinguishing the emergence of the same relationships of plants as in the Grime (1995) C-S-R triangle, Bornhofen and Lattaud (2008) were also able to describe the morphological forms of the L-system plants and recognized the formation of three distinct types. The evolved morphology of competitors included a high stem without branches in order to reach light rapidly in crowded environments, and root systems poorly developed due to the presence of abundant mineral nutrients. Ruderals showed the most simple, condensed morphologies, with poorly developed roots, producing seed as a priority. Stress tolerators displayed well developed root systems and variable shoot systems. The descriptions of FSPM by Bornhofen and Lattaud (2008) were both quantitative and qualitative, and showed their great potential in evolutionary studies at both the population and larger scales by integration into adaptive algorithms (Prusinkiewicz and Lindenmayer, 1990).
Literature Survey CHAPTER 2
2.5 Quantitative pattern identification
When considering large numbers of species in virtual or real-life situations there are various methods that can be used to show clustering or grouping patterns. The recent work discussed on L-systems by Bornhofen et al. (2011), for example, made use of multi-variate principle component analysis. However, it is possible to use alternative, sometimes simpler, methods. In reality, use of principle component analysis and detrended correspondance analysis may be difficult due to the nature of data being analysed and or due to the ‘arching effect’ of continuous variables. In such situations, as in Barreto (2008), it was more pertinent to make use of basic clustering methods. One such method, nearest neighbour, takes advantage of the pattern of data in their own (geometric) space. Using this method the coefficient of squared euclidean distance may be obtained. The coefficient is based on the properties of a right-angled triangle, the square on the hypotenuse being equal to the sum of the squares on the opposite two sides. Thus, if two or more species occur in two or more samples or areas 1 and 2, n, the similarity or ‘distance’ (D) between the species in geometric space is defined as:
Di,j (Xi,kXj,k)2
k1
m
(2.5.1)
Di,j squared Euclidean distance between quadrats/samples i, j.
m number of species
Xi.k the abundance of the kth species in quadrat/sample i
Xj,k the abundance of the kth species in quadrat/sample j
Euclidean distance is often made use of in more complex ordination calculations such as polar ordination. Geometric calculations were part of the calculation for relative proximity (Barreto, 2008).
Literature Survey CHAPTER 2
In the novel approaches of the current study, euclidian proximity may be inferred with measures of the amount of entropy (organization). Barreto (2008) made use of the calculation of entropy between various plant growth related parameters as part of his algorithm COMPTO in the calculation of relative proximity values as detailed in sections 2.3.1 (p. 18) and 2.4 (p. 20). Entropy was first established for use in thermodynamics, but in information theory entropy is used as a measure of uncertainty associated with random variables. Shannon entropy is a measure of the ‘surprise’ or probability of an event occurring. Thus, entropy has found a place in modelling distribution of biological factors in ecology (Elith et al., 2011; Phillips et al., 2006). Elith et al. (2011) clearly explained how to calculate entropy using mathematical software. Entropy was calculated using the species presence data and a combined covariate value obtained from environmental data of the region being modelled. This is very useful as previous description such as that of Shannon (1948), have great application in machine learning, although are only accessible to ecologists through complex statistical software code. Full description was made of the process of the calculation in an informed paper and accompanying appendix (Elith et al., 2011). Key components were defined (e.g. covariates, features and the landscape) and the process of model fitting (feature selection, constraints and regularization) was elucidated. Case studies were described for a range of both plant and animal species, the models were shown and interpretation given. The major use of Elith et al. (2011) is that the process of mechanistic species niches is eloquently described using quantitative means. It is speculated that such description may make the calculations accessible using alternative software platforms (for example, R statistical software or Matlab). This is discussed in Chapter 3 of the current study. The possible use of the calculation of entropy, as in Barreto et al. (2008) for the approximation of relative proximity matrices on which rK continuums may be based, is considered.
2.5.1 Fuzzy logic
Literature Survey CHAPTER 2
programmed to accept ‘noisy’, or inaccurate input, which would render them a great deal more effective and easier to implement than more complex systems. In formal definition of fuzzy sets, Professor Zadeh (1965) stated: “Let X be a space of points (objects), with a generic element of X denoted by x. Thus X = {x}. Then, a fuzzy set (class) A in X is characterized by a membership (characteristic) function ƒA(x) which associates with each
point in X a real number in the interval [0, 1], with the value of ƒA(x) at x representing the
‘grade of membership’ of x in A.”
Fuzzy logic can be seen both as a method to control systems or to classify them. The beauty of fuzzy logic is that it concentrates on what a system should do rather than trying to model how it works. The approach therefore may be seen to be completely devoid of semantic definition. The concept of the membership as applied to fuzzy and classical (crisp) sets of data is a curve defining how each point in the input space relates (is mapped) to a membership value of the set. This may also be termed the degree of membership between 0 and 1. The values 0 to 1 are used to describe the degree of certainty that the point belongs to the set. Membership function is denoted as µ. The values within fuzzy sets may be any value between 0 and 1, whereas the membership function of classical sets is more discretely defined as 0 or 1.
Fuzzy sets are often defined using existing mathematical models. Such a mathematical model is Gaussian or ‘normal’ distribution. The use of this and other weighted distributions was discussed in terms of environmental indices (Silvert et al., 2000; Sivanandam et al., 2007). Gaussian distribution was used to great effect when using fuzzy logic in biological data (Taheriyoun et al., 2010). The paper by Taheriyoun et al. (2010) is very useful to the current author. Although Taheriyoun et al. considered reservoir water quality evaluation, they do so in such a way that 3 different classes of water body are implicated, using 4 different indicators. A parallel with vegetation distribution is drawn in the context of the current study. Competitive, stress tolerant and ruderal types of plant strategy could be considered as classes, with the seven possible combinations of these and their environments being the membership functions.
Literature Survey CHAPTER 2
/(1
){[
1/(11)]A[2/(12)]B[3/13]C...}1/(ABC...) (2.5.1.1)
The inception of (2.5.1.1) is rooted in normal distribution, hence, recent developments in fuzzy logic included examples that facilitated characterisation of plant species distribution patterns (Broekhoven et al., 2007; Herrera, 2005; Nasibov and Peker, 2011; Taheriyoun, 2010; Wang and Yang, 2010; Wendt et al., 2010). Broekhoven et al. (2007) made use of linguistic terms in fuzzy classification in ecology. Herrera provided a useful review of genetic-fuzzy systems. Nasibov and Peker (2011) detailed the process by which increasing the frequency of observation resulted in an expansive differentiation of membership function. Wang and Yang (2010) provided an example of the fusion of objective clustering and genetic algorithms to elaborate and investigate data patterns. Wendt et al. (2010) detailed how knowledge guidance may be used to estimate and optimise parameters in environmental modelling. The methods of these authors demonstrate the power of mathematic methods to expand environmental and species information within dynamic condition. As such, they are seminal to the author of this thesis and enable formation of the novel application fuzzy logic to more than 300 000 plant species. The use of fuzzy logic and related methods enable variables used in modelling to be concisely expressed in terms of x and y and further expand the informative value of combined objective planes. This point is further discussed in the context of genetic algorithms in the following section.
2.5.2 Genetic algorithms
Literature Survey CHAPTER 2
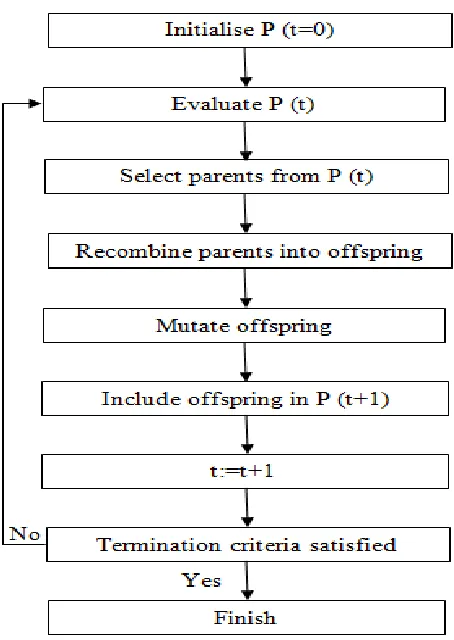
also made use of in the teaching of various computer languages. GA are adaptive algorithms for finding the best (global) solution to optimization problems. The stages of GA are as follows: start with a population of randomly generated ‘chromosomes’ (not actual chromosomes but sequences of defined length)- initialisation. The collection of ‘chromosomes’ (sequences) then evolve through a form of natural selection. Each iteration of selection is known as a generation. The chromosomes are rated for their ‘adaption for solutions’ or potential to solve the problem. On the basis of the evaluation a new population of sequences is formed using a process of selection. At this point genetic processes analogous to crossover and mutation take place. After further selection, given the solution is found, an output is given. An evaluation or fitness function must be devised for each problem to be solved. Specific solutions are devised, being a sequence or chromosome; the evaluation function returns a single numeric value proportional to the adaptation of the solution represented by the chromosome or sequence (Cordón et al., 2004). Populations may go through continual cycles of the GA depending on complexity of the population itself and the changing conditions in which it exists.
Literature Survey CHAPTER 2
2.5.3 Generative fusion of genetic fuzzy systems
Herrera (2005) clearly described linguistic rules that govern fuzzy sets; the ‘IF-THEN’ rules are related by the concepts of fuzzy implication and the compositional rule of inference. A fuzzy rule based system (FRBS) is made up of a knowledge base (KB) including expert information making the linguistic rules, a fuzzification interface to transfer crisp data into fuzzy sets and an inference system to use the fuzzy rules with the KB in reasoning. Importantly there is also a de-fuzzification interface that translates the fuzzy rule action into a real action. Genetic learning systems and an algorithmic approach is key in genetic fuzzy systems. Further, there are ‘Michigan’, iterative rule learning (IRL) and cooperative-competitive approaches that may facilitate the system.
Two main problems occur when generating a knowledge base in genetic fuzzy rule base systems (GFRBSs). Firstly, in taking specification of the ranges (universes of discourse) of the data and resolving the number of labels for each linguistic variable, which fuzzy memberships are associated to each label. Secondly, it is important to define the number of rules and their composition (i.e. which specific label is associated with each linguistic variable). Methods of resolving the problems incorporate genetic learning of the rule base, genetic tuning and genetic learning of the knowledge base and the database. For complex systems there are alternative methods as documented by Cordón et al. (2004). Complex methods documented included fuzzy sliding mode control, neural network, neuro-genetic fuzzy systems, parallel genetic algorithms, co-operative co-evolutionary algorithms and Lamarckian co-adaptation.
Literature Survey CHAPTER 2
coded genetic algorithm may be applied. The representation of the membership function parameters by a binary vector using Gray encoding (Goldberg, 1989) restricts the values the parameters can take to a limited set of values which are defined by the upper and lower bound of the optimization interval and the length of the binary string. Accuracy of allocation of the data points within the ‘input space’ can be further increased by use of weighted averages. The functionality of this approach is shown to great effect, in concise statements of ecological network organisation which enabled greater accuracy in analysis of ecological relations (Broekhoven et al., 2007; Taheriyoun, 2010). The latter unveils the process by which we may extrapolate functions of species and variables within the current limits of our knowledge of the processes and also gives us motivation for novel investigations of further processes. The novelty of this approach is made use of in this study in terms of plant characterisation, further discussed in Chapters 3, 4, 5, 6 and 7.
Figure


Outline
Related documents