THE INFLUENCE OF A FATIGUE-INDUCING ACUTE BOUT OF EXERCISE ON LANDING BIOMECHANICS AND MARKERS OF MUSCLE STRESS
Victoria Sloane Hawley
A thesis submitted to the faculty of the University of North Carolina at Chapel Hill in partial fulfillment of the requirement for the degree of Master of Arts in the Department of Exercise and
Sports Science (Exercise Physiology).
Chapel Hill 2018
Approved by:
Claudio Battaglini
Darin Padua Barnett Frank
2018
Victoria Sloane Hawley ALL RIGHTS RESERVED
ABSTRACT
Victoria Sloane Hawley: The Influence of a Fatigue-Inducing Acute Bout of Exercise on Landing Biomechanics and Markers of Muscle Stress
(Under the direction of Claudio Battaglini)
PURPOSE: To determine the effect of an acute bout of high-intensity exercise on 3D landing biomechanics (sagittal plane knee angle, frontal plane knee angle, sagittal plane hip angle, frontal plane hip angle, vGRF) and creatine kinase release 30 minutes and 24 hours after an acute bout of high-intensity exercise. A secondary purpose was to determine the relationship between landing biomechanics and creatine kinase release at baseline, 30 minutes and 24 hours after an acute bout of high-intensity exercise.
METHODS: Twenty subjects completed a speed-only VO2submax test to determine the
ventilatory threshold (VT). Subjects then completed 5 bouts of running at VT for 5 minutes, 10 jump landings, and 10 split squats, followed by 2 rounds of 10 jump landings and 20 split squats.
A blood draw and 3D biomechanical analysis were completed pre-fatigue, 30 minutes post- fatigue, and 24 hours post-fatigue. One-way within-subjects ANOVAs were used to determine the effect of an acute bout of fatiguing exercise on landing biomechanics and creatine kinase release pre-fatigue, 30 minutes post-fatigue, and 24 hours post-fatigue. A multiple regression was employed to determine the relationship between creatine kinase release and landing biomechanics pre-fatigue, 30 minutes post-fatigue, and 24 hours post-fatigue.
RESULTS: Knee sagittal Euler angle and knee frontal world angle at initial contact significantly decreased from Pre- to Post-30 (p=0.000 and p=0.008, respectively). Knee frontal world angle at
initial contact significantly decreased from pre- to post-24 (p=0.015). CK significantly increased from Pre- to Post-30 (p=0.000), Pre- to Post-24 (p=0.000), and Post-30 to Post-24 (p=0.033).
There were significant relationships between baseline vGRF and %change in CK from Pre- to Post-24 (r= -0.518, p= 0.028), baseline vGRF and baseline maximal knee sagittal angle (r= - 0.518, p=0.019), and baseline vGRF and baseline minimal hip sagittal angle (r= 0.555, p=0.011).
CONCLUSION: An acute bout of fatigue-inducing exercise increases knee valgus and decreases knee flexion at initial contact and increases CK immediately after and 24 hours after exercise, with peak values occurring at 24 hours after exercise. Increased vGRF is associated with less hip and knee flexion, and subsequently less CK release.
ACKNOWLEDGEMENTS
Above all, I would like to thank my advisor, Dr. Claudio Battaglini, and my thesis committee, Dr. Darin Padua and Dr. Barnett Frank. Without their continuous guidance, I would not have been able to complete this project. In addition, I would like to thank all of the members of my research team for their dedication to the project: Johanna White, Stephanie Sullivan, Gregory Nuckols, Samantha Houston, Megan Mathes, and Ruhi Dholakia. Lastly, I would like to thank Jordan Lee and Chad Wagoner for always answering any questions I had and supporting me along the way.
TABLE OF CONTENTS
LIST OF TABLES ... …..viii
LIST OF FIGURES ... …....ix
LIST OF ABBREVIATIONS ...…….x
Chapter I. INTRODUCTION ...……. 1
Statement of purpose...……..3
Research questions ...……..3
Hypotheses ...……..4
Operational Definitions ...……..4
Delimitations ...……..5
Assumptions ...……..6
Limitations ...……..6
Significance of study...……..6
II. REVIEW OF LITERATURE ...……..8
Sports-Related Musculoskeletal Injuries ...……..8
Mechanism of ACL Injury ...……..9
Risk Factors for ACL Injury ...……10
Modifiable Risk Factors ...……13
Previous Strategies to Prevent ACL Injury ...……15
III. METHODOLOGY ...……17
Subjects ...……17
Instrumentation ...……18
Procedures ...……20
Data Analysis ...……29
IV. RESULTS……… ...……31
Subjects……….……31
Effect of Fatigue on Landing Biomechanics.………32
Effect of Fatigue on Creatine Kinase Release………...36
Relationship between Landing Biomechanics and Creatine Kinase Release……37
V. DISCUSSION ...……40
Overview………40
Biomechanical Response to Exercise……...……….41
Creatine Kinase Response to Exercise….………..43
Relationship between Biomechanics and Creatine Kinase………45
Conclusions………46
Applications………...46
Limitations……….47
Future Research……….48
APPENDICES………...50
REFERENCES ...…...64
LIST OF TABLES
Table 1 (Speed-Only Graded Aerobic Power Assessment Protocol)………26
Table 2 (Subject Characteristics)………...32
Table 3 (Descriptive Statistics for Variables at Initial Contact)………32
Table 4 (Descriptive Statistics for Variables about the Knee Joint)………..33
Table 5 (Descriptive Statistics for Variables about the Hip Joint)………33
LIST OF FIGURES
Figure 1 (Outline of Visits)………21
Figure 2 (Fatiguing Protocol Overview)………....28
Figure 3 (Knee Sagittal Euler Angle at Initial Contact over Time)………...34
Figure 4 (World Knee Valgus Angle over Time)………..35
Figure 5 (Knee Frontal World Angle at Initial Contact over Time)………..36
Figure 6 (Creaatine Kinase Concentration over 24 Hours)………...37
Figure 7 (Baseline vGRF vs. %Change in Creatine Kinase)……….38
Figure 8 (Baseline vGRF vs. Maximum Knee Sagittal Angle)……….38
Figure 9 (Baseline vGRF vs. Minimum Hip Sagittal Angle)………39
LIST OF ABBREVIATIONS ACL Anterior Cruciate Ligament
BM Body Mass
BP Blood Pressure
bpm Beats per minute (Heart Rate)
CK Creatine Kinase
cm Centimeter
HR Heart Rate
IC Initial Contact
kg Kilogram
MKD Medial Knee Displacement MSK Musculoskeletal
RER Respiratory Exchange Ratio RPE Rate of Preceived Exertion
SOVO2 Speed-Only submaximal assessment of volume of oxygen uptaken VGRF Vertical Ground Reaction Force
VT Ventilatory Threshold
CHAPTER 1 INTRODUCTION ACL Injuries
Over 200,000 anterior cruciate ligament (ACL) injuries occur in the U.S. every year resulting in more than 1,000,000 physician visits (Gornitzky et al., 2015) and approximately $1 billion in healthcare costs (Mather et al., 2013). One of the main risk factors for ACL injury, as well as all musculoskeletal (MSK) injuries, is high training load. High training load affects and is affected by many factors, including individual characteristics such as biomechanics (Gabbett, 2004). High training load also elicits an effect on the release of creatine kinase (CK) (Tiidus &
Ianuzzo, 1983). CK is marker of muscle stress and/or damage (Baird et al., 2012; Brown, Day, &
Donnelly, 2010) and has been linked to biomechanics (Frank et al., in review). The relationship between training load, biomechanics, and CK release is important to study in order to reduce the risk of MSK and ACL injuries.
Biomechanical Response to Exercise
Biomechanical efficiency can be classified ranging from poor to excellent. The classification depends on how an individual moves (Cameron, Peck, & Owens, 2014; Vanezis &
Lees, 2005). Previous studies have shown that individuals with a poor movement profile are more prone to injuries (B. Frank et al., 2013; Timothy E Hewett et al., 2005). This may be due to movement patterns worsening faster in those with poor movement profiles compared to those with excellent movement profiles during exercise (Frank et al., in review; Padua et al., 2012). However,
it is unclear if an acute corrective exercise intervention can improve biomechanics and decrease the risk of musculoskeletal injury.
Poor movers have an overall greater propensity for high load biomechanics, leading to an overall higher self-imposed mechanical load exposure (T J Gabbett, 2004). Therefore, poor movers may fatigue faster during a bout of exercise, potentially causing their biomechanics to worsen faster than that of excellent movers (Padua et al., 2012). This cycle causes poor movers to be at a higher risk for developing musculoskeletal injuries. Since excellent movers are less likely to adopt poor biomechanics during exercise, they are at a lesser risk of experiencing a musculoskeletal injury (Frank et al., in review; Hewett et al., 2005; Padua et al., 2012).
CK Response to Exercise and Biomechanics
High training load elicits a greater CK response than a low training load. Specifically, high intensity exercise is more important in elevating post-exercise serum enzyme activity that long duration exercise (Tiidus & Ianuzzo, 1983). This is documented in soccer and Australian football players, as their CK levels correlate positively with short bouts of high intensity activity such as sprinting, accelerating, and decelerating (Thorpe & Sunderland, 2012; Young, Hepner, & Robbins, 2012).
Biomechanics may also influence CK response. A poor movement profile has been associated with lower levels of CK both pre- and post- exercise when compared to an excellent movement profile (Franket al., in review). It is theorized that high velocity, restricted knee flexion range of motion during eccentric contractions elicit greater metabolic demand, with lower CK release. Therefore, elevations in CK response in excellent movers may be an indicator of greater eccentric lengthening (Vaczi et al., 2013).
To date, studies examining potential risk factors associated with ACL injury have neglected to a certain extent, the concomitant evaluation of physiological, biological, and biomechanical factors that are believed to increase the risk of such injury. Therefore, studying risk factors in a comprehensive fashion, exploring its relationships may prove to be paramount to better inform the development of more comprehensive injury prevention programs aimed to minimize the occurrence of different musculoskeletal injuries including ACL injury.
Purpose Statement
The primary purpose of this study was to determine the effects of a fatigue-inducing acute bout of exercise on landing biomechanics and creatine kinase responses. The secondary purpose of this study examined the relationship between landing biomechanics and creatine kinase response at baseline, immediately after, and 24 hours after a fatigue-inducing acute bout of exercise.
Research Questions
RQ1. Do landing biomechanics (sagittal plane hip angle, frontal plane hip angle, sagittal plane knee angle, frontal plane knee angle, vertical ground reaction force) change immediately after and 24 hours after a fatigue-inducing acute bout of exercise?
RQ2. Do creatine kinase levels change immediately after and 24 hours after a fatigue-inducing acute bout of exercise?
RQ3. What markers of landing biomechanics (sagittal plane hip angle, frontal plane hip angle, sagittal plane knee angle, frontal plane knee angle, vertical ground reaction force) are associated with creatine kinase at baseline, immediately after, and 24 hours after a fatigue-inducing acute bout of exercise?
Hypotheses
H1: Sagittal plane hip angle and sagittal plane knee angle will significantly decrease, whereas frontal plane hip angle, frontal plane knee angle, and vertical ground reaction force will significantly increase following an acute bout of exercise inducing fatigue, as compared to baseline values.
H2: Creatine kinase plasma concentration will be significantly increased immediately after and 24 hours after an acute bout of exercise inducing fatigue, as compared to baseline values.
H3: There will be a significant relationship between markers of landing mechanics (sagittal plane hip angle, frontal plane hip angle, sagittal plane knee angle, frontal plane knee angle, vertical ground reaction force) and creatine kinase at baseline, immediately after, and 24 hours after a fatigue-inducing acute bout of exercise.
Operational Definitions
• Blood Lactate- Lactate that appears in circulation as a result of anaerobic metabolism when oxygen delivery to working tissues is insufficient to support metabolic demand.
• Creatine Kinase (CK)- Enzyme that catalyzes the reversible reaction of creatine and adenosine triphosphate (ATP) to phosphocreatine (PCr) and adenosine diphosphate (ADP).
• Fatiguing protocol- An exercise protocol lasting approximately 45 minutes comprised of 5 sets of a 5-minute treadmill run at VT, 10 jump-landings, and 10 split squat jumps, followed by 2 sets of 10 jump-landings and 40 split squat jumps.
• Jump-Landing Task- Subjects jump down from a 30 cm high box to a target line placed 50% of the subject’s height anterior to the box and immediately jump upward for maximal height.
• Medial Knee Displacement (MKD) - Visually observed frontal plane medial displacement of the center of the patella during the loading phase of a jump-landing task.
• Ventilatory Threshold (VT)- The point at which pulmonary minute ventilation increases disproportionately to oxygen consumption during the SOVO2 exercise test.
• Sagittal Plane Knee Angle- Angle of the shank segment rigid body relative to the thigh segment rigid body around the knee joint’s mediolateral axis (Knee flexion/extension).
• Frontal Plane Knee Angle- Angle of the shank segment rigid body and the thigh segment rigid body around the knee joint’s anteroposterior axis (Knee varus/valgus).
• Sagittal Plane Hip Angle- Angle of the thigh segment rigid body relative to the pelvis segment rigid body around the hip joint’s mediolateral axis (Hip flexion/extension).
• Frontal Plane Hip Angle- Angle of the thigh segment rigid body relative to the pelvis segment rigid body around the hip joint’s anteroposterior axis (Hip adduction/abduction)
• Vertical Ground Reaction Force- The vertical component of the ground reaction force of the force plate equal in magnitude and opposite in direction to the force of subjects when they are in contact with the force plate.
Delimitations
• All subjects had a history of or are currently participating in soccer, basketball, rugby, lacrosse, field-hockey or team handball.
• All subjects were premenopausal females between 18-24 years of age.
• All subjects had a history of field and/or court sport participation.
• All subjects regularly participated in exercise (i.e. at least 30 minutes, 3 days per week)
• All subjects were recruited from the Chapel Hill area via flyer, email, face to face, and phone call.
• All subjects had no history of lower extremity injury.
Assumptions
• All subjects followed the pre-assessment guidelines prior to testing sessions.
• Subjects did not participate in any other forms of exercise or diet while participating in the study.
• Subjects honestly answered all questionnaires.
• Subjects reported any discomfort that occured throughout the study.
Limitations
• The results of this study may only apply to those whom are women, participate in court and/or field sports, apparently healthy and between the ages of 18-24 years old. Results may not be applied to females of all ages and males.
• It is possible that subjects did not adhere to pre-assessment guidelines prior to testing.
• Phase of the menstrual cycle was not controlled for.
Significance of the Study
It is known that improving biomechanics results in decreased risk of MSK injury (B. Frank et al., 2013; Timothy E Hewett et al., 2005) and that fatigue increases the risk of MSK injury by
altering biomechanics (Frank et al., in review). It has also been shown that CK changes in response to biomechanics (Frank et al., in review), but what biomechanical factors contribute most to CK release is unknown. The results of this study will add to the currently literature by providing coaches and trainers with information regarding more specific responses and relationships between biomechanical and biological factors affected by exercise fatigue, so training programs aimed to prevent injury can be empirically designed and optimized to protect/minimize MSK injury in their athletes.
CHAPTER II
REVIEW OF LITERATURE
Introduction
Sports-Related Musculoskeletal Injuries
Forty eight percent of adult men and 43% of adult women are active at recommended levels, meaning participarting in at least 30 minutes, 5 to 7 days per week, at a moderate intensity or at least 20 minutes, 3-7 days per week, at a vigorous intensity (Macera et al., 2005). There are numerous benefits associated with adequate physical activity including reduced risk of
developing hypertension, obesity, diabetes, coronary artery disease, etc. (Pate et al., 2014).
However, physical activity increases the risk of sports-related injuries. An average 7 million sports-related injuries occur annually in the United States, with musculoskeletal (MSK) injuries comprising 53.5% of sports-related injuries. Specifically, lower extremity (LE) injuries comprise 38.9% of sports-related injuries (Conn, 2003).
The LE injury rate in NCAA athletes is as high as 53.8%, with knee and ankle injuries accounting for most of these (Hootman, Dick, & Agel, 2007). In addition, slightly over half (53.6%) of LE injuries are strains or sprains(Conn, 2003). Of these, anterior cruciate ligament (ACL) injury is a common LE injury, and is a growing cause for concern (Ytterstad, 1996).
ACL Injuries
Over 200,000 ACL injuries occur in the United States every year resulting in more than 1,000,000 physician visits(Gornitzky et al., 2015) and approximately $1 billion in healthcare costs(Mather et al., 2013). Following ACL injury, physical activity acutely decreases for 6 months to 1 year (Lohmander et al., 2007). Long term, 74% of ACL injury patients will experience sports disability, and 44% will experience disruption in activities of daily living (Noyes et al., 1983). Along with time costs, monetary costs, and reduction in physical activity, 50% of people suffering from an ACL injury will develop osteoarthritis in 10-20 years, and reconstruction/repair does not protect against developing osteoarthritis(Lohmander et al., 2007).
Mechanism of ACL Injuries Non-Contact Injury
Of all ACL injuries, almost 75% occur due to a non-contact mechanism (Boden et al., 2000). In addition, after reviewing three case studies of female indoor handball/basketball players, Ebstrup & Bojsen-Møller (2000) concluded that “injuries happened in uncontrolled situations at high speeds and when attempting to avoid collisions, or in defense situations with braking and changes in direction”, supporting findings by Boden et al. (2000).
Cutting (Sharp Deceleration)
The plant and cut mechanism is the most common mechanism of ACL injury. In a video analysis of female team handball competitions, ACL injury typically occurred when the foot was planted, the foot was outside the knee, the knee was nearly fully extended and in valgus, and there was either internal or external rotation of the tibia (Olsen, Myklebust, Engebretsen, & Bahr,
2004). This finding is both supported and conflicted by Ebstrup & Bojsen-Møller (2000), who concluded that ACL ruptures occur either when the knee is in a valgus position and there is internal rotation of the femur, or in a varus position and there is external rotation of the femur.
Landing
Landing is the second most common mechanism of ACL rupture, specifically landing on one leg from jump shots (Olsen et al., 2004). Specifically, 22% of ACL injuries occur from landing from a jump (Noyes et al., 1983). After analyzing twenty videos of ACL injuries that occurred in women’s Norweigian handball games, it was concluded that ACL injuries occurred when the foot was planted and externally rotated, the knee was in slight flexion and a valgus position, and there was external rotation of the tibia. This agrees with the mechanism of ACL injury due to a cutting motion from the same study (Olsen et al., 2004). Also agreeing with Olsen et al. (2004) are findings by Boden et al. (2000), stating that most non-contact ACL injuries occur when the knee is close to full extension during a sharp deceleration or landing.
Risk Factors for ACL Injury Biomechanics
Biomechanics explain how an injury mechanism either increased the mechanical load on the ACL to a level that cannot be tolerated, or decreased the amount of mechanical load that the ACL can tolerate resulting in the ACL being unable to tolerate a normal mechanical load (Bahr
& Krosshaug, 2005; McIntosh, 2005).
At the knee joint, one study loaded cadaver knees and measured the load on the ACL.
This study found that an anterior shear force on the tibia significantly loads the ACL. ACL
loading increases as knee flexion angle decreases due to anterior shear force, knee valgus, knee varus, and internal rotation moments. However, knee valgus, knee varus, and internal rotation moments significantly load the ACL only when the ACL is already being loaded by anterior shear force, and the combination of knee valgus, knee varus, and internal rotation moments are greater than the anterior shear force alone (Markolf et al., 1995; Yu & Garrett, 2007). Further, a systematic review revealed that excessive knee valgus during weight-bearing deceleration
exercises increases the load on the ACL (Shimokochi & Schultz, 2008). In addition, an increased lateral trunk angle in females moves their center of mass to the lateral side of the knee,
contributing to an increased knee valgus angle (T E Hewett, Torg, & Boden, 2009).
At the hip joint, a video analysis of athletes who injured their ACL during a landing maneuver versus athletes who did not injure their ACL during a landing maneuver showed that the athletes with ACL ruptures had increased hip flexion angles at initial ground contact. The researchers of this study theorized that since the torso is farther behind the knee joint at an increased knee flexion angle, more hip flexion and knee extension torque is needed to stabilize the torso during the landing. This leads to greater quadriceps activation for knee extension torque and increases the load on the ACL (Boden et al., 2009). Another study required their subjects to perform two different drop landing tasks. The first task allowed subjects to perform the drop landing using their neutral or preferred landing stance. The second task required the subjects to perform the drop landing with trunk flexion. The researchers found that decreased hip flexion, or a more erect posture, when landing increased vGRF, therefore increasing quadriceps activation, and therefore increasing the load on the ACL (Blackburn & Padua, 2009). These results conflict the results of Boden et al. (2009).
Fatigue
A study that compared pre-season training over three seasons in sub-elite rugby players concluded that an increased training load, synonymous with fatigue in this context, is associated with an increased injury rate (Gabbett, 2004). In agreement, another study by Gabbett & Jenkins (2010) compared training load during the competitive season over four years in elite rugby players and concluded that increased training load is associated with an increased injury rate.
Another important factor in training load, or fatigue, is the acute to chronic workload (A:C workload). Athletes, specifically rugby players in one study, with a high chronic workload are more resistant to ACL injuries compared to athletes with low chronic workloads during periods of low-to-moderate or moderate-to-high A:C workloads. However, athletes with a high chronic workload are less resistant to ACL injuries when exposed to an acute spike in workload, or increased A:C workload. In other words, a high chronic workload resulted in ACL injury resistance when the acute workload was similar to the chronic workload. The researchers of this study theorized that because the athletes with a high chronic workload were highly conditioned, the may experience a lesser increase in neuromuscular fatigue following a match, resulting in less ACL injuries (Hulin et al., 2016).
Sex
Females suffer more ACL injuries than do males. One study showed that female soccer and basketball players suffered ACL injuries at a rate of 0.31 (based on injuries per 1000 athlete- exposures), versus the male soccer and basketball players who suffered ACL injuries at a rate of only 0.13, suggesting that females are a little of twice as likely to suffer an ACL injury (Arendt
& Dick, 1995). Another study concludes that female college basketball athletes are a greater rick
for ACL injury by fourfold (Myklebust et al., 1997). Lastly, female handball athletes are at an almost two-times greater risk for ACL injury compared to males. In a study of Norwegian team handball cruciate ligament injuries, 62% of injuries were female ACL injuries, while only 37%
were male ACL injuries (Myklebust et al., 1997).
There are several suggested risk factors that may explain female athletes’ increased risk of ACL injury, including the effect of estrogen on tensile strength, greater average Q-angle, increased knee and muscle laxity, physical ACL size, etc. However, the exact etiology of why ACL injuries are more common in females than males is not exactly known (B. P. Boden, Griffin, & Garrett, 2000).
Modifiable Risk Factors Biomechanics
Many studies have shown that biomechanical factors contributing to ACL injuries can be improved. An intervention focused on lengthening tight muscles, inhibiting overactive muscles, strengthening weak muscles, and integrative exercises for form and technique reduced medial knee displacement (MKD) and knee valgus angle during a double leg squat task. This
intervention was administered two to three times a week for three weeks (Bell et al., 2013).
Another intervention focused on improving neuromuscular control of the hip, knee, and ankle muscles improved medial hamstring activation during a side-cutting task, but did change quadriceps activity. The activation of the medial hamstring without a concurrent increase in quadriceps activation may protect the ACL by decreasing the load placed on it. This intervention lasted eighteen weeks and consisted of six levels, each level lasting 3 weeks and the next level
was designed to be more difficult than the last. The subjects received the intervention twice a week (Zebis et al., 2008).
Training Load/fatigue
Training load, or fatigue, can alter biomechanics. Immediately following a ninety-minute intermittent exercise protocol, hip flexion and initial contact, knee loading, and hip loading significantly decreased. These changes were still present sixty minutes after the exercise protocol (Schmitz et al., 2014). Agreeing with the results of this study, another showed that a fatiguing protocol resulted in decreased knee and hip flexion during a running-stop-jump task (Quammen et al., 2012). However, a systematic review by Santamaria & Webster (2010) looking at single- leg landings reported that peak hip flexion was greater after fatigue in all of the studies included in the review, but knee flexion post-fatigue was unclear as all of the study results were
conflicting.
A study observing the effect of fatigue on a drop landing task employed the Wingate Anaerobic Test (WAT) as their means of fatigue. The subjects completed four rounds of one WAT and three drop landing tasks. Interestingly, the researchers found that muscle fatigue led to an initial decrease in ground reaction force (GRF), followed by subsequent increases in GRF as muscular fatigue continued to increase (Dominguese, Seegmiller, & Krause, 2012).
Muscle Stress (CK-MM)
Creatine Kinase, subtype MM (CK-MM), is found primarily in skeletal muscle and is considered a marker of muscle stress. When a muscle is exposed to exercise, CK-MM “leaks”
out into circulation (Baird et al., 2012). Exercise intensity has greater effect on response to
exercise-induced muscle damage than duration (Baird et al., 2012; Tiidus & Ianuzzo, 1983).
Following a semiprofessional soccer match, CK-MM significantly increased and directly correlated with the number of sprints, a high-intensity exercise, performed (Thorpe &
Sunderland, 2012), supporting the idea that exercise intensity has a greater effect than duration on exercise-induced muscle damage. Also supporting this idea is that in Australian Rules Football, greater CK-MM release correlated with longer distances covered at four-seven m/s, a slow-fast sprinting speed (Young et al., 2012).
CK-MM concentration is also correlated with performance variables. In professional rugby league players, there is a significant correlation between increased CK-MM concentration and decreased rate of force production thirty minutes after and twenty-four hours after a match.
CK-MM peaked at twenty-four hours after the match, and stayed elevated for five days (McLellan, Lovell, & Gass, 2011).
Previous Strategies to Prevent ACL Injury
Many studies, systematic reviews, and meta-analyses show that a preventative training program is successful in reducing ACL injury risk, but cannot identify exactly which component of the programs are responsible for the decrease (Sadoghi, von Keudell, & Vavken, 2012; Taylor et al., 2015). A greater duration of static stretching reduces the risk of non-contact ACL injuries, while greater duration of balance training was associated with a higher risk for ACL injury. This study was unable to identify which component of training programs should be emphasized, but concluded that, overall, injury prevention programs are effective in reducing ACL injury risk (Taylor et al., 2015). Additionally, a systematic review revealed that ACL injury prevention programs reduced risk of ACL injury by 52% in females and 85% in males, but again was not
able to identify which component of the prevention programs was most effective (Sadoghi et al., 2012).
One study by Padua et al. (2012) was able to identify the prevention/training program duration as key to maintaining lower extremity movement control, and therefore reducing ACL injury risk. Two groups completed training, one group for three months and one group for nine months. Immediately following training, both groups had improved lower extremity movement control, but only the nine-month training group retained their improved lower extremity
movement control three months after the end of training.
CHAPTER III METHODOLOGY
Subjects
Thirty recreationally active females currently participating in a court or field sport, or with a history of participation in a court or field sport, were recruited to participate in this study.
Inclusion Criteria 1. Female
2. History of or currently participating in soccer, basketball, rugby, lacrosse, field-hockey or team handball.
3. History of or actively participating in respective sport’s weekly training sessions and competitions
4. Perform at least 30 minutes of moderate to high-intensity physical activity a minimum of 3 days per week.
5. 18 – 24 years of age
Exclusion Criteria
1. No history of lower extremity surgery within the past year 2. No history of lower extremity joint surgery
3. No history of prior ACL or meniscal injury
4. No history of lower extremity injury in the past 6 months that prevented participation in club sport training or competition activities for more than 3 consecutive days
5. No history of neuroendocrine, neurological, or metabolic disease or condition 6. No history of dysmenorrhea or amenorrhea within the past 6 months
7. No history of systemic or cardiorespiratory conditions that would prevent participation in high-intensity fatiguing exercise
Instrumentation Resting Vitals
Resting heart rate (Under Armour A39, Under Armour Inc., Baltimore, Maryland, USA) and blood pressure (ADC 700 Diagnostix® Series Pocket Aneroid Sphygmomanometer,
American Diagnostics Corporation, Hauppage, New York, USA; 3MTMLittmann® Stethoscope, 3M, St. Paul, Minnesota, USA) were assessed prior to exercise.
Cardiopulmonary
For determination of VT, participants completed a speed-only graded aerobic capacity assessment (SOVO2) on a motorized treadmill (GE T2100 Exercise Stress System, General Electric – Healthcare, Little Chalfont, UK) with measurement of respiratory gas exchange using a metabolic cart (TrueOne 2400 Metabolic Measurement System, Parvo Medics, Sandy, Utah, USA) and instantaneous monitoring of heart rate (A39 Exercise Monitor, Under Armour Inc., Baltimore, Maryland, USA). Prior to the VT assessment, standard calibration procedures of the flow, carbon dioxide, and oxygen sensors of the metabolic cart using a 3.0 L syringe of known gases were performed.
3D Biomechanics
The main component of the motion analysis system is a standard-range direct-current transmitter with 3 orthogonal coils that generate an electromagnetic field. The standard range transmitter produces changes in the electromagnetic field, which are recorded by electromagnetic sensors sampling at 140 Hz. Tracking sensors were placed over the anteromedial aspect of the shank, lateral thigh, and sacrum. Markers were placed on the skin with double sided tape and secured with pre-wrap and athletic tape. Global and segment axis systems were established with the X-axis designated as positive anteriorly, the Y-axis positive to the left of each subject, and the Z-axis positive superiorly.
Blood Draw
Baseline and post-exercise whole blood samples were collected via a standard antecubital vein venipuncture (BD Vacutainer® Eclipse™ Blood Collection Needle 21g x 1- ¼” Becton Dickinson and Co., Franklin Lakes, New Jersey, USA) into 10 ml serum separator tubes (SST) with clot activator gel (BD Vacutainer® SST™, Becton Dickinson and Co., Franklin Lakes, New Jersey, USA). Baseline and post-exercise blood samples were stored at 4° C overnight (~8 hrs) to allow for clot formation. After clot formation, samples were centrifuged (IECCentra-8R
Refrigerated Centrifuge, International Equipment Company, Needham Heights, Massachusetts, USA) at 1000 g for 20 minutes at 4° C. Sera samples were evenly divided into four aliquots for redundancy and potential unforeseen future analyses. Sera samples were pipetted into sterile 1.5 ml polypropylene long-term storage cryogenic vials (Nalgene 1.5 ml Long-term Storage
Cryogenic Vial, Thermo Fisher Scientific, Waltham, Massachusetts, USA). Vials were labeled,
sealed, and stored at -80° C in two separate freezer locations (Isotemp-5150, Thermo Fisher Scientific, Waltham, Massachusetts, USA & Revco Ultima Plus; ULT2186-10-D41, Thermo Electron Company, Asheville, NC, USA) to minimize the risk of sample mortality due to equipment failure. Samples were stored at -80° C until thawing for serum biomarker analysis using enzyme linked immunosorbent assay (ELISA) procedures. All ELISA procedures were carried out per manufacturer recommendations and were analyzed using a 96 well 8-channel microplate reader (ChroMate® 4300, Awareness Technology Inc., Hauppauge, New York, USA).
Samples will be stored for a maximum of 3 years, after which they will be disposed of.
Blood Lactate
Blood lactate levels (Lactate Plus, Nova Biomedical, Waltham, Massachusetts. USA) were measured and recorded at baseline (resting) and post-exercise. Resting blood lactate was reviewed to ensure there were no abnormalities in resting blood lactate concentrations.
Procedures
Subjects reported to the laboratory for a total of two visits over a 24-hour period. Visit 1 consisted of screening, baseline measurements, a submaximal VT assessment, fatigue-inducing acute bout of exercise, and post-0 hour (POST-0 HR) measurements. Visit 2 consisted solely of post-24 hour (POST-24 HR) measurements. An overview of visits is presented in Figure 1 below. A detailed description of each visit is presented in the following sections.
Figure 1. Outline of visits.
Visit 1 Screening
Upon the subject’s arrival to The Sports Medicine Research Laboratory, a member of the research team verbally confirmed the subject eligibility for participation in the study and
provided pre-testing guidelines (Appendix A). Subjects were then asked to read and sign an Institutional Review Board approved consent form. Following the informed consent process subjects completed a medical history (Appendix B), physical activity participation level
questionnaires (Appendix C-D), and menstrual cycle questionnaire (Appendix E). A member of the research team answered any questions the subjects may have had regarding the
questionnaires. Additionally, the questionnaires included inclusion / exclusion criteria
redundancy questions, thus a member of the research team reviewed the documentation prior to the initiation of the baseline assessment to provide double confirmation that the participant met study inclusion / exclusion criteria. Following completion of inclusion/exclusion criteria screening, informed consent, questionnaires, and verification, subjects begun the assessment of resting measurements.
Resting Measurements
Subjects first completed the anthropometric measures of weight (kg) and height (cm).
The subject’s resting heart rate and blood pressure was measured and recorded after lying supine for at least 5 minutes. The subject’s resting vital signs were reviewed to ensure there was no evidence of contraindications to participation in in any aspect of the study.
Baseline Assessment
Baseline assessment included a blood draw (antecubital venipuncture), blood lactate measurement, and 3D biomechanical assessment, in that order.
For antecubital venipuncture, subjects were seated in a phlebotomy chair in the Exercise Oncology Research Laboratory (EORL) and a research team member trained in phlebotomy performed the procedure following standard phlebotomy guidelines.
Following antecubital venipuncture, subjects remained in a seated position in the phlebotomy chair for a blood lactate measurement following standardized finger prick
guidelines. Lactate Plus, Nova Biomedical, Waltham, Massachusetts USA was used for the analyses.
3D biomechanical assessment consisted of a jump-landing task, countermovement vertical jump, overhead squat, and single leg squat. For the jump-landing task, a 30-cm box was placed at a distance of 50% of the subject’s height from the leading edge of the force platform.
Subjects were instructed to step up onto the 30-cm box, face forward, and jump down to the center of the force plate, and rebound upward for a maximal vertical jump. During the jump- landing task instruction, emphasis on starting the jump in a neutral positioning with toes pointing forward, feet shoulder-width apart, and both feet leaving the box at the same time was
communicated to the subjects to promote a successful trial execution. Subjects completed a total of 5 jump-landing trials. Any trial where the subject did not leave the box with both feet
simultaneously, failed to execute the jump-landing, did not land with their feet completely on a single force platform, exhibited an excessive vertical trajectory off the box prior to landing, or jumped forward off the ground were discarded and repeated.
For the countermovement vertical jump, subjects were instructed to stand with their hands on their hips and their right and left feet on the force plate. Subjects were instructed to keep their hands on their hips throughout the countermovement vertical jump task. Subjects initiated the countermovement vertical jump with a downward countermovement to then extend upward until airborne, jumping vertically for maximal height. A trial was completed with the subject landing atop the force plate. A successful trial was executed when the subject completed the countermovement vertical jump without lifting their hands off their hips and lands with their feet on the force plate. If the subject lifted their hands off of their hips or demonstrated a visually monitored excessive side, forward, or backward translation, or appeared excessively unbalanced
during any phase of the countermovement vertical jump the trial was discounted and repeated.
The subject completed 5 successful trials of the countermovement vertical jump.
To perform the overhead squat, subjects stand with their feet shoulder width apart, their arms extended vertically overhead, and descended into a squat of their preferred depth. Then, subjects extended upward until returned to standing position. Subjects completed 3 sets of 5 consecutive trials.
For the single leg squat, subjects were instructed to stand on their dominant leg on the force plate. The subject’s non-dominant leg was flexed at the hip at 90°, and flexed at the knee at 90°. Subjects were instructed to stand with their hands on their hips throughout the single leg squat and to not to touch the non-dominant foot to the force late or floor for balance. Subjects descended into a squat to their preferred depth, and then extended upwards until in a standing position again. A successful trial was executed when subjects completed a single leg squat without lifting their hands off their hips, completed a squat and full extension back to standing, and did not touch their non-dominant foot to the force plate or floor for balance. If subjects lifted their hands from their hips or touched the non-dominant foot to the force plate or floor, the trial was discarded and repeated. Subjects completed 3 sets of 5 consecutive trials of the single leg squat.
VT Assessment
For determination of VT, subjects completed a speed-only submaximal VO2 assessment (SOVO2) on a motorized treadmill (GE T2100 Exercise Stress System, General Electric – Healthcare, Little Chalfont, UK) with measurement of respiratory gas exchange using a metabolic cart (TrueOne 2400 Metabolic Measurement System, Parvo Medics, Sandy, Utah,
USA) and monitoring of heart rate (A39 Exercise Monitor, Under Armour Inc., Baltimore, Maryland, USA) that was calibrated following the manufacturer guidelines and
recommendations.
Before beginning the VT assessment, subjects were fitted for a mouthpiece attached to the metabolic cart for measurement of ventilatory gas exchange during the SOVO2 protocol. The mouthpiece was secured comfortably around the subject’s head, covering the mouth and nose. A research team member described the SOVO2 testing protocol to subjects before beginning the test. After the principal investigator delivered testing instructions, explained the assessment procedures, and subjects were comfortable breathing through the ventilation monitoring apparatus, subjects completed a five-minute warm-up on the treadmill at 4.0 miles per hour (mph).
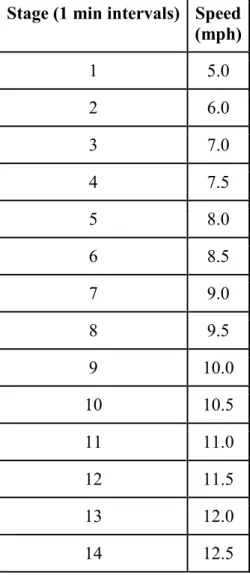
The SOVO2 protocol consists of one-minute stages that begin at a speed of 5.0 mph (Table 1). Each stage increases by 1.0 mph until a speed of 7.0 mph (Stage 3). After the treadmill speed is increased to 7.0 mph, each 1-minute stage increases speed by 0.5 mph until the
candidate either: (1) reaches a respiratory exchange ratio (RER) of ≥1.10; (2) reports an RPE of
≥18; (3) has a heart rate above 85% of heart rate reserve (HRR); or (4) voluntarily terminates the protocol. Subject’s oxygen uptake, heart rate, RPE, and RER were recorded at the end of each stage. Subjects were not to reach volitional exhaustion during the SOVO2 protocol since VT generally occurs below VO2max (73-75% VO2max); thus, the use of HRR at 85% as a testing termination point.
Upon meeting SOVO2 protocol stop criteria, the treadmill was stopped. A member of the research team then removed the ventilation mouthpiece. The metabolic data was then analyzed for the determination VT. The V-slope method was used for determination of VT. Carbon
dioxide output was plotted against oxygen consumption as measured per minute during exercise.
A line with a slope of 1 was then drawn through the points on the graph during the early phase of exercise. The point on the line where carbon dioxide output departs drastically from oxygen consumption was marked as the VT. The VO2 value at this point was recorded and reported as a percentage of VO2max (Casaburi et al., 1977).
Stage (1 min intervals) Speed (mph)
1 5.0
2 6.0
3 7.0
4 7.5
5 8.0
6 8.5
7 9.0
8 9.5
9 10.0
10 10.5
11 11.0
12 11.5
13 12.0
14 12.5
Table 1. Speed-Only Graded Aerobic Power Assessment Protocol
Fatiguing Protocol
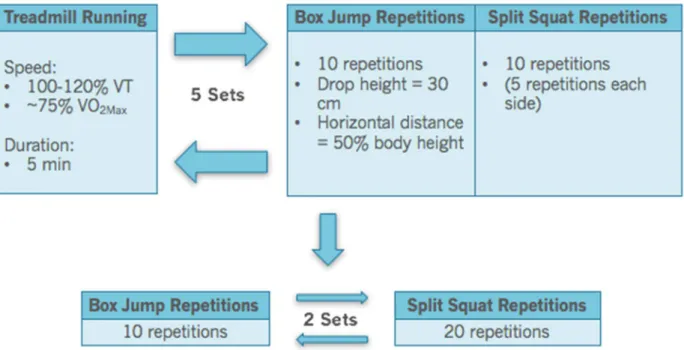
A figure outlining the fatiguing protocol is depicted in Figure 2. Following the
termination of the SOVO2 protocol and the determination of VT, subjects begun the fatiguing protocol. A mouthpiece was fitted to the subject for monitoring of ventilatory gases during treadmill running during the fatiguing protocol so precise exercise intensities during the fatiguing protocol could be monitored. Subjects begun the fatiguing protocol running on a treadmill at a running speed (intensity) coincident with ~115 - 120% of VT for 5 minutes. After subjects ran for 5 minutes, they stepped off and straddled on the treadmill. A research team member removed the ventilation mouthpiece. Once off the treadmill, subjects initiated the jump-landing interval of the fatiguing protocol, stepping on a 30 cm box placed at a distance 50% of the subject’s body height behind a target line on the floor. Similar to the jump-landing task during the 3D
biomechanical assessment, subjects were instructed to jump down at least to the target line on the floor, and then immediately jump upward for maximum height. Subjects completed 10
repetitions of the jump-landing task. Subject then initiated the split squat jump interval of the fatiguing protocol, beginning in a lunge, jumping and exploding vertically, and landing in a lunge with the opposite leg forward. Subjects completed 10 split squat jumps (5 on each side) prior to stepping back onto the treadmill for initiation of the next 5-minute running interval. The combination of the 5-minute running, 10 jump-landings, and 10 split squat jumps represented a single set the fatiguing protocol. Subjects completed five sets of the fatiguing protocol for a total volume of 25 minutes of running at 115 – 120% VT, 50 jump-landings, and 50 split squat jumps.
A member of the research team recorded RPE and HR data at the end of each fatiguing protocol set. Following the 5 sets of treadmill running, jump-landings, and split squat jumps, subjects completed 20 additional jump-landings and 40 additional split squat jumps. Members of the
research team verbally encouraged subjects throughout the fatiguing protocol with consistent motivational cuing between each testing trial. If at any point during the fatiguing protocol subjects noted that they were not able to physically continue or experienced pain, the fatiguing protocol was terminated.
Figure 2. Fatiguing Protocol Overview.
POST-0 HR Assessment
POST-0 HR measurements included a 3D biomechanical assessment, blood lactate measurement, and standard antecubital venipuncture. The methods of these assessments are described in previous sections. The 3D biomechanical assessment occurred immediately following the completion of the fatiguing protocol in the Sports Medicine Research Lab
(SMRL). Subjects were escorted from the SMRL to the EORL for blood lactate and antecubital
biomechanical assessment. The antecubital venipuncture occurred 30 minutes following completion of the 3D biomechanical assessment.
Visit 2
POST-24 HR Assessment
Visit 2 was scheduled for 24 hours after the beginning of Visit 1, and consisted of a POST-24 HR assessment. POST-24 HR measurements included an antecubital venipuncture and 3D biomechanical assessment. Upon arrival, subjects were instructed to lay supine on a table in the EORL for 30 minutes, after which the antecubital venipuncture occurred. Subjects were then escorted to the SMRL for a 3D biomechanical assessment.
Data Analysis
Sample Size Calculation
Based on previous literature with a similar population (Quammen et al., 2012), a sample of 28 subjects was determined. Means for knee flexion/extension at peak VGRF pre- and post- fatigue were -35.9 +/- 6.5 and -38.8 +/- 5.03, respectively. This calculated an effect size of 0.621.
The sample size was based off of a power of at least 80% for a dependent t-test with significance of α = 0.025. Power calculations were made with G*Power version 3.1. Due to time constraints and feasibility, only twenty subjects were enrolled in the study.
Statistical Analysis
To test H1 and H2, a 1-way within-subjects Analysis of Variances (ANOVA) with 3 levels (baseline, immediately-post, and 24 hours-post) was used for CK. A 1-way within-subjects
ANOVA with 3 levels (baseline, immediately-post, and 24 hours-post) was used for each biomechanical variable (sagittal plane hip angle, frontal plane hip angle, sagittal plane knee angle, frontal plane knee angle, vertical ground reaction force). If a 1-way ANOVA for CK or a biomechanical variable was significant, a post-hoc analysis was employed using dependent samples t-tests to compare immediately-post and 24 hours-post to baseline values for the respective variable.
To test H3, a multiple regression was used to explore the relationship between the criterion variable (CK) and the 5 predictor variables (sagittal plane hip angle, frontal plane hip angle, sagittal plane knee angle, frontal plane knee angle, vertical ground reaction force). These relationships between criterion and predictor variables were examined at each of the following points in time: baseline, immediately-post, and 24 hours-post the fatigue-inducing acute bout of exercise. If the model was deemed significant, the model was refined maintaining only the contributor variables using a stepwise procedure.
CHAPTER IV RESULTS
The primary purpose of this study was to determine the effects of a fatigue-inducing acute bout of exercise on landing biomechanics and creatine kinase responses. The secondary purpose of this study was to examine the relationship between landing biomechanics and creatine kinase response at baseline, immediately after, and 24 hours after a fatigue-inducing acute bout of exercise.
Subjects
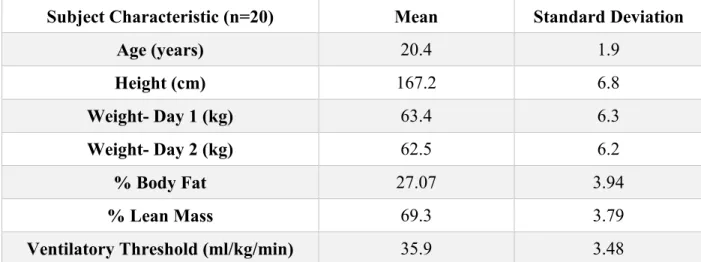
Twenty-five subjects were enrolled in the study. Two subjects were excluded from the study due to a history of lower extremity surgery, 1 subject was excluded because she did not meet the age criteria, 1 subject was excluded due to multiple breaks during the fatiguing protocol because of shin splints, and 1 subject was excluded due to discomfort during the protocol.
Therefore, the final sample for all the analyses was 20 subjects (n=20). Subject characteristics are presented in Table 2 below.
Subject Characteristic (n=20) Mean Standard Deviation
Age (years) 20.4 1.9
Height (cm) 167.2 6.8
Weight- Day 1 (kg) 63.4 6.3
Weight- Day 2 (kg) 62.5 6.2
% Body Fat 27.07 3.94
% Lean Mass 69.3 3.79
Ventilatory Threshold (ml/kg/min) 35.9 3.48
Table 2. Subject characteristics.
Effect of Fatigue on Landing Biomechanics
Pre, Post-30, and Post-24 mean, standard deviation, p-value, and partial eta squared are presented for variables at initial contact (IC), about the knee joint, about the hip joint in Tables 3- 5 below.
Variable Pre (mean ± SD)
Post-30 (mean ± SD)
Post-24
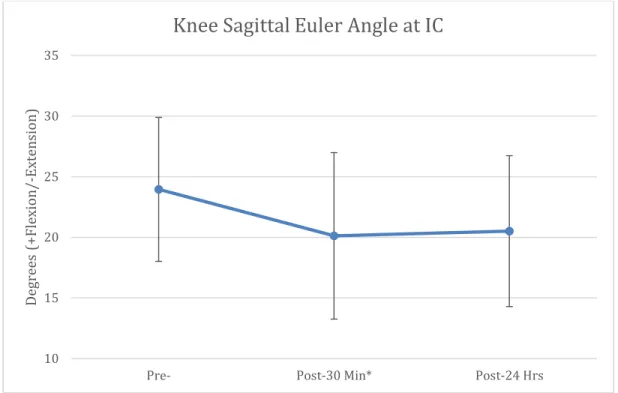
(mean ± SD) P-value Partial eta squared Knee Sagittal
Angle (Euler) 23.9 ± 5.9 20.1 ± 6.9* 20.5 ± 6.2 0.028 0.207 Knee Frontal
Angle (Euler) 2.4 ± 3.8 0.4 ± 3.2 2.3 ± 7.8 0.283 0.063 Hip Sagittal
Angle (Euler) -35.4 ± 8.9 -35.2 ± 9.6 -31.0 ± 8.9 0.052 0.144 Hip Frontal
Angle (Euler) -9.2 ± 5.9 -10.0 ± 5.4 -10.9 ± 9.6 0.539 0.024 Knee Frontal
Angle (World) -5.7 ± 2.04 -7.2 ± 2.2* -6.9 ± 1.9* 0.001 0.309 Table 3. Descriptive Statistics, p-values, and partial eta squared for variables at initial contact (*Significantly different from Pre)
Variable Pre (mean ± SD)
Post-30 (mean ± SD)
Post-24
(mean ± SD) P-value Partial eta squared Knee Valgus
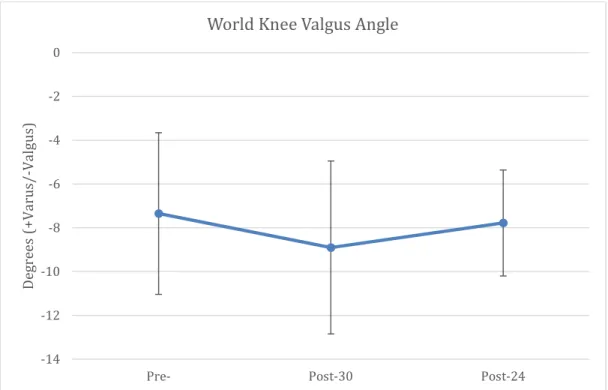
Angle (Euler) -6.5 ± 5.3 -9.7 ± 6.4 -5.5 ± 11.1 0.141 0.105 Knee Valgus
Angle(World) -7.4 ± 3.6 -8.9 ± 3.9 -7.8 ± 2.4 0.028 0.172 Knee Varus
Angle (Euler) 5.2 ± 4.1 4.0 ± 4.9 7.9 ± 15.7 0.362 0.047 Knee Varus
Angle (World) -2.2 ± 4.1 -3.7 ± 3.5 -2.4 ± 3.9 0.051 0.145 Knee Flexion
Angle (Euler) 97.6 ± 12.5 94.9 ± 12.9 95.1 ± 15.8 0.434 0.043 Table 4. Descriptive Statistics, p-values, and partial eta squared for primary variables at knee joint
Variable Pre (mean ± SD)
Post-30 (mean ± SD)
Post-24
(mean ± SD) P-value Partial eta squared Hip Flexion
Angle (Euler) -84.2 ± 18.5 -80.4 ± 17.7 -81.7 ± 18.7 0.443 0.042 Hip Abduction
Angle (Euler) -12.9 ± 8.1 -13.0 ± 7.1 -16.3 ± 15.9 0.340 0.049 Hip Adduction
Angle (Euler) -6.3 ± 7.1 -6.1 ± 6.2 -8.5 ± 10.7 0.319 0.054 Table 5. Descriptive Statistics, p-values, and partial eta squared for primary variables at hip joint.
The 1-way within-subjects ANOVA for vGRF was not significant (p= 0.953, partial eta squared= 0.003). The mean and standard deviation for pre-, post-30, and post-24 were 2.74±
0.799, 2.78± 0.635, and 2.76± 0.956, respectively.
Hypothesis 1, sagittal plane hip angle and sagittal plane knee angle will significantly decrease, whereas frontal plane hip angle, frontal plane knee angle, and vertical ground reaction force will significantly increase following an acute bout of exercise inducing fatigue, as
compared to baseline values, was evaluated using a 1-way within-subjects ANOVA.
Knee sagittal Euler angle and knee frontal world angle at IC significantly decreased from Pre- to Post-30 (p=0.000 and p=0.008, respectively), but did not change significantly from Post- 30 to Post-24 (p>0.05). Knee frontal world angle at IC was also significantly decreased from pre- to post-24 (p=0.015). World knee valgus angle was trending toward a significant decrease from Pre- to Post-30 (p=0.053), but not trending towards a significant decrease from Pre- to Post-24 or Post-30 to Post-24 (p>0.05). All aforementioned changes are demonstrated in Figures 3-5.
Figure 3. Knee sagittal Euler Angle at initial contact at Pre-, Post-30 min, and Post-24 hrs.
(*Significantly different from Pre-, p=0.000)
10 15 20 25 30 35
Pre- Post-30 Min* Post-24 Hrs
Degrees (+Flexion/-Extension)
Knee Sagittal Euler Angle at IC
Figure 4. Knee frontal world angle at Initial Contact at Pre-, Post-30 min, and Post-24 hrs.
(*Significantly different from Pre-, p=0.008; **Significantly different from Pre-, p=0.015)
-10 -9 -8 -7 -6 -5 -4 -3 -2 -1 0
Pre- Post-30 Min* Post-24 Hrs**
Degrees (+Varus/-Valgus)
Knee Frontal World Angle at IC
Figure 5. World knee valgus angles at Pre-, Post-30 min, and Post-24 hrs.
Effect of Fatigue on Creatine Kinase Release
Hypothesis 2, creatine kinase plasma concentration will be significantly increased immediately after and 24 hours after an acute bout of exercise inducing fatigue, as compared to baseline values, was evaluated using a 1-way within-subjects ANOVA. The mean and standard deviation for pre-, post-30, and post-24 were 47.022± 22.8403, 78.761±35.9462, and
124.339±75.3639, respectively. These results are demonstrated in Figure 6. The overall ANOVA was significant (p=0.000) and yielded a partial eta squared of 0.497. There was a significant difference between CK concentrations from pre- to post-30 (p=0.000), pre- to post-24 (p=0.000), and post-30 to post-24 (p=0.033).
-14 -12 -10 -8 -6 -4 -2 0
Pre- Post-30 Post-24
Degrees (+Varus/-Valgus)
World Knee Valgus Angle
Figure 6. Creatine Kinase concentration at Pre-, Post-30 min, and Post-24 hrs.
(*Significantly different from Pre-, p= 0.000; **Significantly different from Pre- and Post-30, p=0.000 and p=0.033, respectively)
Relationship Between Landing Mechanics and Creatine Kinase Release
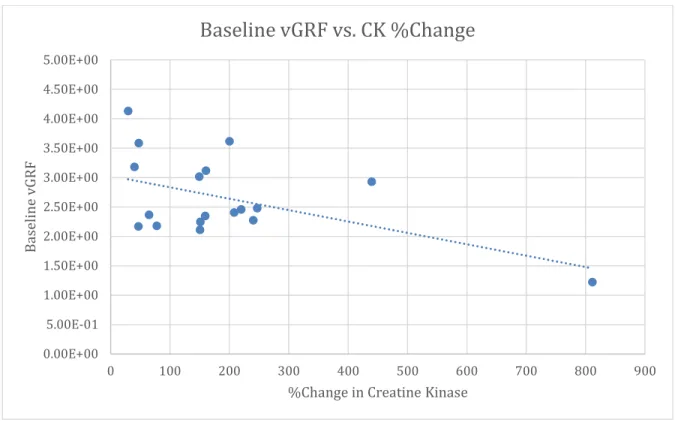
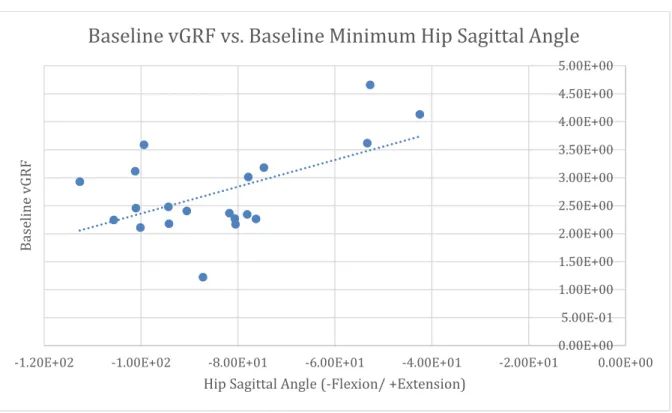
Hypothesis 3, there will be a significant relationship between markers of landing mechanics (sagittal plane hip angle, frontal plane hip angle, sagittal plane knee angle, frontal plane knee angle, vertical ground reaction force) and creatine kinase at baseline, immediately after, and 24 hours after a fatigue-inducing acute bout of exercise, was evaluated using a multiple regression. There was a significant relationship between baseline vGRF and the percent change in CK release from pre- to post-24 (r= -0.518, p=0.028). There was also a significant relationship between baseline vGRF and baseline maximum knee sagittal angle (r=-0.518, p=0.019), and baseline vGRF and baseline minimum hip sagittal angle (r=0.555, p=0.011). These results are represented in Figures 7-9.
0 50 100 150 200 250
Pre- Post-30 Min* Post-24 Hrs**
CK Concentration (U/L)
CK-MM Over 24 Hours
Figure 7. Baseline vGRF vs. %Change in Creatine Kinase.
0.00E+00 5.00E-01 1.00E+00 1.50E+00 2.00E+00 2.50E+00 3.00E+00 3.50E+00 4.00E+00 4.50E+00 5.00E+00
0 100 200 300 400 500 600 700 800 900
Baseline vGRF
%Change in Creatine Kinase
Baseline vGRF vs. CK %Change
0.00E+00 5.00E-01 1.00E+00 1.50E+00 2.00E+00 2.50E+00 3.00E+00 3.50E+00 4.00E+00 4.50E+00 5.00E+00
6.00E+01 7.00E+01 8.00E+01 9.00E+01 1.00E+02 1.10E+02 1.20E+02
Baseline vGRF
Knee Sagittal Angle (+ Flexion/ -Extension)
Baseline vGRF vs. Baseline Maximum Knee Sagittal Angle
Figure 9. Baseline vGRF vs. Baseline Minimum Hip Sagittal Angle.
0.00E+00 5.00E-01 1.00E+00 1.50E+00 2.00E+00 2.50E+00 3.00E+00 3.50E+00 4.00E+00 4.50E+00 5.00E+00
-1.20E+02 -1.00E+02 -8.00E+01 -6.00E+01 -4.00E+01 -2.00E+01 0.00E+00
Baseline vGRF
Hip Sagittal Angle (-Flexion/ +Extension)
Baseline vGRF vs. Baseline Minimum Hip Sagittal Angle
CHAPTER V DISCUSSION
Overview
The purpose of this study was to investigate the effects of an acute bout a fatigue- inducing exercise on landing mechanics and creatine kinase release, as well as to determine the relationship between landing mechanics and creatine kinase release. It was hypothesized that the fatiguing exercise would significantly alter landing mechanics, increase creatine kinase release, and that there would be a significant relationship between different landing mechanics variables and creatine kinase release.
Changes in biomechanics following fatiguing exercise have been well-reported in the current body of literature (Cortes, et al., 2013; Dominguese, Seegmiller, & Krause, 2012;
Quammen et al., 2012; Santamaria & Webster, 2010; Schmitz et al., 2014). However, some discrepancies do exist. For example, Quammen et al (2012) reported that hip flexion during a landing task decreased following a fatiguing protocol whereas Santamaria & Webster (2010) concluded that all studies included in a systematic review reported increased peak hip flexion following fatigue. The current study adds to the current body of evidence by reporting that biomechanics are in fact altered following fatigue, which helps clarify some of the conflicting results currently available in the literature.
Inconsistencies also exist within the current body of literature focusing on the release of creatine kinase following fatiguing exercise. Many studies report different times of peak CK
concentration as well as durations of elevated CK concentrations. One study reported peak CK concentration at 24 hours post-fatigue, but CK remained elevated for 120 hours (McLellan et al., 2011), whereas another reported peak CK concentration at 48 hours post-exercise and only stayed elevated for 48 hours (Twist & Eston, 2005). Finally, another study reported CK peaking 4 days following exercise focusing on eccentric contractions (Clarkson, Nosaka, & Braun, 1992).
Therefore, the current study also adds insight as to when CK levels peak following fatiguing exercise utilizing running, jump landings, and split squats.
Finally, there is only one study examining the relationship between biomechanics and CK release. Frank et al. (in review) found that a “good” movement profile is associated with a
greater increase in CK following fatiguing exercise than a “bad” movement profile. However, this study was not able to conclude if there is a specific biomechanical variable that is most associated with CK release, or predicts it best.
Biomechanical Response to Exercise
Significant changes in frontal plane knee angle and sagittal plane knee angle at IC were observed from pre- to post-30. Frontal plane knee angle also significantly changed from pre- to post-24. Specifically, subjects landed with less knee flexion and in a more valgus position at IC 30 minutes following fatigue and continued to land in a more valgus position at IC 24 hours following fatigue. These results parallel results from similar studies (Cortes et al., 2013; Frank et al., in review; Quammen et al., 2012). The lack of significant change in all other biomechanical variables (frontal plane hip angle, sagittal plane hip angle, vGRF) is possibly explained by a learning effect or the fatiguing protocol may not have induced enough fatigue to demonstrates signs of changes in these variables.
In a study utilizing similar subjects, it was found that knee flexion and hip flexion decreased at IC following a fatiguing protocol. The researchers of this study went on to
breakdown fatigue into 50% fatigue and 100% fatigue. Knee flexion decreased at both 50% and 100% fatigue, whereas hip flexion actually increased at 50% fatigue and then decreased below baseline at 100% fatigue (Cortes et al., 2013). There could be a few reasons why the study by Cortes et al. (2013) found a decrease in hip flexion after fatigue but the current study did not, such as an insufficient fatiguing protocol or different tasks used for evaluation of biomechanics.
As mentioned before, the fatiguing protocol used in the current study may not have been a strong enough stimulus to evoke a response for all of the biomechanical variables of interest. The fatigue protocol was designed so that the bouts of running were at approximately 75% of VO2max, which reflects a very high intensity protocol certainly high enough to fatigue subjects over time.
However, the jump landings and split squats may have not been a strong enough fatiguing stimulus to elicit a more pronounced change in sagittal plane hip angle at IC. In addition, Cortes et al. (2013) evaluated biomechanics using a sidestep-cutting task whereas we used a landing task. These two tasks require different movement patterns and therefore may influence which biomechanical variables change following a fatiguing protocol.
Another study by Quammen et al. (2012) also reported decreased hip flexion and knee flexion at IC during a running stop jump task following two different fatiguing protocols: a functional agility short-term fatigue protocol based on an agility circuit and slow linear oxidative fatigue protocol based on running. Both protocols produced similar results (Quammen et al., 2012). The current study used a similar task to evaluate biomechanics, as well as somewhat similar fatiguing protocols, leading to a hypothesis that the current study would produce similar results. However, the current study’s fatiguing protocol involved 70 jump landings. Therefore,
the subjects may have learned how to control their movements throughout the fatiguing protocol or experienced an acute increase in neuromuscular control. This is another possible explanation of why frontal plane hip angle, sagittal plane hip angle, and vGRF did not significantly change in the current study.
The current study found a significant decrease in knee frontal world angle at IC, or an increase in knee valgus at IC 30 minutes after fatiguing exercise and 24 hours after fatiguing exercise. This result agrees with results reported in Chappell et al. (2005). Chappell et al. (2005) reported that knee valgus moment mean increased 96% following a fatiguing protocol in
females. The fatiguing protocol in this Chappell et al. (2015) utilized running and jumping tasks, as did the current study. However, the running and jumping tasks in Chappell et al. (2015) were 30 meter sprints and vertical jumps, whereas the protocol in the current study consisted of running at ventilatory threshold, jump landings, and split squats. Both studies also evaluated biomechanics using similar tasks, Chappell et al. (2015) using a stop-jump task and the current study using a jump landing task.
Landing with the knee in a more extended position increases the anterior shear force on the tibia, increasing the load on the ACL and risk of ACL injury (Markolf et al., 1995). However, landing with less knee flexion prevents the knee from going into a more valgus position.
Therefore, subjects may have landed with less knee flexion in an attempt to prevent injury.
Although, subjects still landed with increased knee valgus angle at initial contact, increasing load on the ACL and risk of ACL injury.