Furazolidone [N-(5-nitro-2-furfurylidene-3-ami- no)-2-oxazolidinone] has been used in the treatment of various livestock such as cattle, pig and poultry, as an effective antibiotic both prophylactically and therapeutically for gastrointestinal infections caused by Escherichiacoli and Salmonella spp., and as a growth promoter. Furazolidone, as well as the other members of the nitrofuran family have been prohibited within the EU (Commission Regulation, 1995) because of their potentially harmful effects on human health (McCalla, 1983; Vroomen et al., 1990; Van Koten-Vermeulen, 1993; Gottschall and Wang, 1995). Nitrofurans, despite being carcinogenic, are still used in non-EU countries and have been identified in foodstuffs of animal origin and also
food commodities imported into the EU (European Commission, 2005). Monitoring the compliance of the EU ban with respect to the import of food products into Europe is therefore of great importance. Furazolidone detection itself has not been effective as the drug is rapidly metabolized after ingestion (Nouws and Laurensen, 1990; McCracken et al., 1995). However, the nitrofuran drugs furazolidone, furaltadone, nitrofurantoin and nitrofurazone, form protein bound metabolites which persist in edible tissue for a considerable amount of time after treatment (Hoogenboom et al., 1991; Horne et al., 1996; McCracken and Kennedy, 1997b).
AOZ (3-amino-2-oxazolidinone) is the metabolite moiety derived from furazolidone. Apart from its long
Supported by the Ministry of Agriculture of the Czech Republic (Project No. MZE 0002716201).
Validation of a monoclonal antibody-based ELISA for
the quantification of the furazolidone metabolite (AOZ)
in eggs using various sample preparation
M. FRANEK
1, I. DIBLIKOVA
1, M. VASS
1, L. KOTKOVA
1, K. STASTNY
2, K. FRGALOVA
2,
K. HRUSKA
11Veterinary Research Institute, Brno, Czech Republic
2Institute of State Control of Veterinary Biologicals and Medicaments, Brno, Czech Republic
ABSTRACT: A monoclonal-based ELISA, coupled with an assay buffer, solvent and solid phase extraction proce-dures, was validated for use in the monitoring of egg samples for 3-amino-2-oxazolidinone (AOZ). The procedures allow the detection of protein bound AOZ in the form of 2-nitrophenyl derivative (NPAOZ) in sample supernatant or extract after acid hydrolysis and derivatisation with o-nitrobenzaldehyde. The assays were validated according to criteria set down by Commission Decision (2003) for the performance and validation of analytical methods for chemical residues. The detection capability of ELISA’s for AOZ in eggs (set on the basis of acceptance of no false negatives) was 0.6, 0.3 and 0.3 µg/kg for buffer, solvent and solid phase extraction, respectively. These values are well below the maximum required performance limit (MRLP) of 1 µg/kg for tissue bound residues of nitrofuran antibiotics. An excellent correlation of results (r = 0.99, n = 14) obtained by the ELISA and LC-MS/MS techniques within the concentration range of 0–5 µg/kg was found in the incurred egg samples. The eggs collected from layer chickens fed 30 and 400 mg/kg of furazolidone for 10 days were monitored by ELISA until AOZ concentrations approached the LoD.
term stability in tissue (Nouws and Laurensen, 1990; McCracken et al., 1995, 1997), AOZ is not degraded by common cooking techniques (Hoogenboom et al., 1991) making it practical for monitoring and detection in edible tissues. The AOZ metabolite is known to bind covalently to cellular proteins
in vivo and is released from tissue under mildly acidic conditions. O-nitrobenzaldehyde (o-NBA) has been shown to derivatise AOZ in vitro, to form the nitro phenyl derivative NPAOZ ([[2-ni- trophenyl)methylene]-amino]-2-oxazolidone) (Hoogenboom et al., 1992). The derivatisation step is required to increase the molecular weight of the target compound in order to improve the sensitivity of mass detection (Conneely et al., 2002) and the ability to generate antibodies for immunoassays (Cooper et. al., 2004a).
Although many laboratories have developed methods for the determination of AOZ in edible tissues, only a few studies have focused on the determination of furazolidone or AOZ in eggs (Botsoglou, 1988; Kumar et al., 1994; Draisci et al., 1997). The detection of furazolidone and AOZ in poultry eggs, was carried out by McCracken et al. (2001) using LC-MS, involved the incurred samples being subjected to hydrolysis and the derivatisation process, followed by an extraction step using ethyl acetate. The limit of detection (LoD) for this method was approximately 1.0 µg/kg for both furazolidone and AOZ. Other findings from these authors showed that concentrations of the furazolidone parent drug and AOZ residue in eggs reached a plateau of 360 to 380 µg/kg by the 4th day of treatment with 400 mg/kg
furazolidone, coinciding with the results published by Botsoglou (1988). The AOZ residue concentration in egg homogenates was stable when stored at –20°C for 55 days, whereas, the concentration of furazolidone decreased by 44% in identical conditions, emphasising the stability of AOZ and the benefits of its use as a marker in the monitoring of furazolidone use in poultry production.
Liquid-liquid extractionextraction has been uti-lised by various groups for the isolation of fura-zolidone or derivatised AOZ released from liver or muscle tissue, combining solvent extraction with liquid chromatography (LC) using ultra-vio-let (UV) (Kumar et al., 1994; Yoshida and Kondo, 1995; Angelini et al., 1997), or mass spectrometry (MS) detection (McCracken et al., 1995, 2001; McCracken and Kennedy, 1997a). High-perform-ance liquid chromatography (HPLC) combined with MS/MS (O’Keeffe et al., 2004; Mottier et al.,
2005) or UV detection (Horne et al., 1996) has also been employed for the analysis of the above ana-lytes. Solvent extraction procedures are effective but the use of a large amount of high grade solvents can be costly, not to mention the health hazards.
Solid-phase extraction (SPE) coupled to LC-MS was used for the determination of the AOZ or furazolidone in liver and muscle (Carignan et al., 1990; Parks and Kubena, 1990; Leitner et al., 2001; Conneely et al., 2002). SPE enables the analyte to be concentrated before its analysis and can reduce the amounts of organic solvents required during sample preparation, as well as being as a clean up step. Moreover, SPE in combination with LC-MS/MS has a high sensitivity and selectivity and allows AOZ to be identified in accordance with EU guidelines (Carignan et al., 1990; Leitner et al., 2001; Conneely et al., 2002). LC-MS/MS can quantify tissue bound nitrofuran metabolites at concentrations of parts per billion (ppb) and satisfies the EU Minimum Required Performance Limit (MRPL) of 1.0 µg/kg (Commission Decision, 2003). On the other hand, SPE is time-consuming and therefore not suitable for testing large series of samples.
Enzyme-linked immunosorbent assay (ELISA) is an effective alternative to analytical detection and monitoring methods offering fast, reliable and rela-tively cheap determination of low concentrations of target analytes. The first ELISA system capable of determining AOZ was reported by Cooper et al. (2004b) and involved AOZ being released from prawns, derivatised with o-NBA, extracted using ethyl acetate and washed in hexane prior to detec-tion. This polyclonal based immunoassay reached a 0.1 µg/kg LoD. A simplified but still sensitive ELISA which used buffer extraction, and was based on monoclonal antibody immunoassay, was developed by Diblikova et al. (2005). This method relied on the use of matrix matched calibration standards to reduce sample interference, and allowed the sensitive deter-mination of AOZ in shrimp, poultry, pork, and beef tissue homogenates without solvent extraction.
MATERIAL AND METHODS
ELISA
Chemicals and biochemicals. 3-amino-2-oxa-
zolidone (AOZ), o-nitrobenzaldehyde (o-NBA), bovine serum albumin (BSA), 3[[(2-nitrophenyl)- methylene]-amino]-2-oxazolidinone (NPAOZ) was obtained from WITEGA Laboratorien (Berlin, Germany). Peroxidase Type II from horseradish (HRP), dimethyl sulphoxide (DMSO), Tween 20, N-hydroxysuccinimide (NHS), dicyclohexylcarbo-diimide (DCC), N,N-dimethylformamide (DMF), and (hydroxymethyl)-aminomethane were ob-tained from Sigma (St. Louis, USA). 3,3’,5,5’-te-tramethylbenzidine (TMB) was purchased from Serva (Heidelberg, Germany), and n-hexane and methanol (spectroscopy grade) were provided by Merck (Darmstadt, Germany). Strata SDB-L-Sty- rene-Divinylbenzene cartridges were obtained from Phenomenex (Aschaffenbburg, Germany). Sephadex-25 and ethyl acetate and furazolidone were purchased from Sigma Aldrich (Heidelberg, Germany). 3([(3-carboxyphenyl)methylene]-ami-no)-2-oxazolidinone (CPAOZ) and CPAOZ-ethyl- ene diamine-human serum albumin (CPAOZ-ed-HSA) were provided by the Veterinary Science Division, Department of Agriculture and Rural Development (Belfast, Northern Ireland) and previ-ously described (Cooper et al., 2004a). Monoclonal antibody against CP-AOZ-ed-HSA (clone 3B8/2B9) was produced by this laboratory (Vass et al., 2005). All other chemicals were of analytical grade and purchased from Dorapis (Brno, Czech Republic).
Instrumentation. A homogeniser (Ultra-Turax IKA T18, Germany), minishaker (IKA MS2, Germany), centrifuges (Juan CR 3-22, Juan CR 3-I, France), horizontal shaker (Unimax 1010, Germany), mani-fold (Supelco, Germany) and sample concentrator (Techne DB – 3D, East Port, United Kingdom) were used for sample preparation. Microtitre plates were supplied by NUNC (Roskilde, Denmark). A micro-titre plate shaker (IKA MTS4, Germany) and auto-matic plate washer (ELX50-BIO-TEK Instruments, Vermont, USA) were used for washing microplates. Absorbance was measured using an EL 808 Ultra mi-croplate reader and processed by KC4TM v. 3.1
soft-ware (BIO-TEK Instrumentations, Vermont, USA). Conic pipette tip 1:5 ml (cod. EG502) for gel filtration was a product of the BicappaLAB (Rome, Italy).
Buffers and solutions. The following
buff-ers were used in the experiments: (1) 50 mmol/l
o-NBA in DMSO for the derivatisation of AOZ. (2) 0.1 mol/l phosphate buffer saline (PBS) con-taining 2 mol/l NaOH for sample neutralisation. (3) 10 mmol/lPBS, containing 145 mmol/lNaCl (pH 7.2), for dilution of the extracts. (4) 0.3 mol/l Na3PO4.12 H2O for pH adjustment of samples. (5) 50 mmol/l carbonate buffer (pH 9.6) as a coat-ing buffer. (6) 10 mmol/lPBS, containing 145 mmol/l NaCl and 0.5% BSA (pH 7.2), for tracer dilution. (7) 10 mmol/lphosphate buffer saline (PBS) with 0.1% Tween-20 as a washing buffer. (8) Substrate buffer contained 0.1 mol/lsodium acetate (pH 5.5, adjusted by addition of 1 mol/l citric acid). (9) Sub-strate solution for HRP was prepared by the addi-tion of 1 ml of substrate buffer, 200 µl of 1% (w/v) solution of TMB in DMSO and 20 µl of 6% (w/v) H2O2 to 20 ml MilliQ-water. (10) Stopping reagent was 2 mol/l H2SO4.
Calibration standards. 50 µl of stock NPAOZ
solution (1 g/l methanol) was added to 21.56 ml of PBS to obtain the concentration of 2 314 µg/l. Ten µl of this solution was added to 990 µl of PBS or matrix supernatant (refer to paragraph “buff-er extraction”) to obtain 1 ml of buff“buff-er or matrix matched standard of concentration 23.14 µg/l. This standard solution was diluted with PBS or matrix supernatant to obtain standards in buffer or matrix matched standards containing 0.12; 0.23; 0.46; 1.16; 2.31; 4.63 and 9.25 µg of NPAOZ/l. Data were cal-culated on the basis of underivatised AOZ, a more conventional expression than the derivatised form (NPAOZ). After correcting for the increase in mass, arising from derivatisation with o-NBA (using the coefficient 2.314), the respective concentrations (as AOZ equivalents) are as follows: 0.05; 0.10; 0.20; 0.50; 1.0; 2.0; 4.0 µg AOZ /l.
Synthesis of enzyme tracer. CPAOZ (5 µmol,
Preparation of incurred egg samples. Six clini-cally healthy chickens were housed in individual wire cages and randomly divided into two equal groups. Drinking water and feed was given ad li-bitum throughout the experiment. Chickens were fed a non-granular conventional layers diet for 3 days and eggs were collected daily. After 3 days, feed was changed to a medicated ration. The first group (3 chickens) was fed a conventional layers ration containing 30 mg/kg of furazolidone over 10 consecutive days. The second group was given a conventional layers ration containing a therapeutic dose of furazolidone (400 mg/kg) for the same dura-tion. After 10 days medicated feed was replaced by non-medicated feed for the remainder of the 90 day experiment. Eggs were collected daily,stored at 4°C in a refrigerator and egg content was homogenised within a week of sample collection. Egg homoge-nates were stored at –20°C until use.
Buffer extraction (BE). The matrix supernatants from AOZ free (blank) samples were prepared as follows; eggs werehomogenised and the homoge-nate was distributed (1 g each) into 15 ml disposable plastic tubes. At this stage, samples were fortified, when required, by the addition of AOZ standard solution (10 µg/l and 100 µg/l) in H2O. Three millilitres of H2O was added into the tubes and the samples vortexed for 10 s. Samples were then placed in boiling water bath for 10 min and then allowed to cool at room temperature. 5 mol/l HCl (150 µl) and 50 mmol/l o-NBA in DMSO (25 µl) were added to the samples and incubated at 37°C overnight. After incubation, 0.3 ml of 2 mol/lNaOH in concentrated PBS was added to each tube and the samples vortexed thoroughly for 20 s. Samples were centrifuged at 1 600 × g at 4°C for 15 min and the clear portion of the supernatant was transferred to glass vials using Pasteur pipettes. The final pH of the samples was adjusted to 7.1–7.2 by addition of 1 mol/l NaOH in combination with a pH-monitor. Samples were then ready for ELISA analysis.
Solvent extraction (SE). 1 g of egg homogenates were weighted into 15 ml disposable plastic tubes (with screw caps) and the homogenates were forti-fied by the addition of AOZ (10 µg/l and 100 µg/l) in H2O as described above. Three ml of H2O was added into tubes and vortexed for 10 s. Then, 0.5 ml 1 mol/l HCl and 25 µl 50 mmol/l o-NBA in DMSO was added, and the samples were incubated at 37°C overnight. Samples were neutralised by addition of 0.3 ml of 2 mol/l NaOH in 0.1 mol/l PBS and vortexed for 20 s. Five ml of ethyl acetate was
pipet-ted into each sample. Test tubes were then closed and shaken (in the horizontal position) for 15 min followed by centrifugation at 1 600 × g at 4°C for 15 min. Four ml aliquots of the upper ethyl-ac-etate layer were then transferred into clean glass vials and evaporated to dryness on a heating block at 60°C, under nitrogen. The evaporates were re-dissolved in 0.8 ml of PBS, washed with 2 ml of
n-hexane and vortexed thoroughly for 30 s. Glass vials were centrifuged (1 100 × g at 4°C), freezed for 15 min at –80°C and then the hexane discarded. The solid portion of sample was thawed and 1 ml
n-hexane added and the washing step repeated once as described above. The cleaned up sample extract was used for ELISA analysis.
Solid phase extraction (SPE). 1 g of egg homoge-nate was weighted into 15 ml disposable plastic tubes (with screw caps) and samples were forti-fied by the addition of AOZ standard solution as described above. Three ml of H2O, 0.5 ml 1 mol/l HCl and 25 µl 50 mmol/l o-NBA in DMSO were added to each sample. Test tubes were vortexed for 10 s and incubated at 37°C overnight. 0.5 ml of 0.3 mol/l Na3PO4.12 H2O, 0.25 ml 2 mol/l NaOH and 4.5 ml H2O were added to each sample and vor-texed for 30 s. Samples were adjusted to pH 7.0–7.2 with 1 mol/l NaOH, centrifuged at 1 100 × g at 4°C for 15 min, and supernatant collected. SDB-L-Sty- rene-Divinylbenzene cartridges were placed on a vacuum manifold and conditioned using 3 ml ethyl-acetate, followed by 3 ml methanol and 5 × 3 ml H2O. Eight ml of supernatant was passed through the cartridge, then washed with 6 ml H2O, and eluted with 2 × 3 ml ethyl acetate. The eluent was collected and centrifuged at 1 100 × g for 10 min. Samples (4.5 ml aliquots) were transferred to clean glass vials and evaporated to dryness on a heat-ing block at 60°C, under nitrogen. The evaporates were re-dissolved in 0.72 ml PBS, vortexed for 30 s and analysed with ELISA. For LC-MS/MS analy-sis, evaporates were redissolved in 0.5 ml of ac-etonitrile/water/acetic acid (100:900:1, v/v).
Direct ELISA
each well. The plates were incubated for 1 h at 4°C. Unbound compounds were removed by washing 3 times with the washing solution as above. 200 µl of substrate solution was then added to each well and the enzymatic reaction was stopped after a 15 min incubation period at room temperature by the addi-tion of 100 µl/well of stopping soluaddi-tion. Absorbance values were measured at 450 nm.
The concentrations of analyte in samples obtained by SE-ELISA or SPE-ELISA were read directly from the calibration curve generated in buffer. The concentrations of analyte in matrix supernatant, determined by BE-ELISA, were read from the ma-trix-matched calibration curve. To obtain a result in µg/kg, the concentration (read from matrix-matched calibration curve for AOZ), was multiplied by a final sample volume V (= dilution factor). For V = 4.8 ml, the sample concentration is calculated as follows: Result (µg AOZ/kg) = Result of ELISA (µg AOZ/l) × 4.8 (Diblikova et. al., 2005).
LC-MS/MS analysis
LC-MS/MS was performed with the mobile phase consisting of 0.1% acetic acid in water (A) and ac-etonitrile (B). The flow rate and temperature of the gradient run was set at 0.2 ml/min and 25°C, respectively. Chromatographic separation was per-formed on a XTerra MS instrument, C18 (5 µm, 3.0 × 100 mm) column, combined with a guard col-umn (2.1 × 10 mm), purchased from Waters. 10 µl of sample was injected. The column was connected to a LC-MS/MS system comprised of a LC pump Surveyor and a TSQ Quantum Discovery Triple quadrupole mass spectrometer equipped with an ESI ion source, (FINNIGAN Termo Electron Corporation, USA). The samples were analysed in a positive polarity mode (ESI+). The mass spec-trometer was operated in the selected reaction monitoring mode (SRM) and the settings chosen for optimum sensitivity were spray voltage 4.5 kV, collision energy 13 eV, scan time 0.30 s, scan width 1 000 m/z, sheath gas flow 65 units, auxilary gas flow 5 units and capillary temperature 220°C. Under the given MS/MS fragmentation conditions, the precursor/product (m/z) ion combination for NPAOZ was 236 and, 134 and 104, respectively. Similar fragmentations are found for the internal standard: the precursor/product (m/z) ion com-bination for NPAOZ-d4 was 240 and 134, respec-tively. The used collision energy (eV) was 13.
Validation
Twenty egg samples were obtained for the vali-dation study using the standard ELISA protocols to assess the range of matrix interferences in the assay and provide data for the determination of false positive rates. Of the 20 samples, eight were obtained from farms and 12 were purchased from retail outlets within the local area. No measurable AOZ residues were observed in the blank samples from previous ELISA determination and were therefore considered to be free of AOZ.
ELISA analysis was repeated following the fortifi-cation with standard AOZ in order to calculate the detection capability (CCβ) at different false posi-tive rates, coefficients of variation, and the percent recovery of the method. The recovery of the added AOZ was calculated as follows: Recovery (%) = AOZ conc. measured/AOZ conc. fortified × 100. Intra-assay and inter-assay variation coefficients for ELISA procedures were determined using dupli-cate blank samples fortified at the levels 0.5, 1 and 3 (or 5) µg/kg.
RESULTS AND DISCUSSION
Analytical characterisation of ELISA
subsequent separation of the residual o-NBA from the derivatised sample supernatant. The method relies on the use of matrix matched calibration standards to reduce sample interferences. To achieve maximum sensitivity, the procedure was optimised in respect to the reagent and washing volumes, and the minimum volume of derivatisation solution that could be added to the sample supernatant.
Representative standard curves for NPAOZ based on matrix calibration are shown in Figure 1. The standard dose responses are expressed here in the concentration of AOZ equivalent and B/Bo ratio, where B = absorbance at a given concentration of the analyte, Bo = absorbance at zero concentration of the analyte. The ELISA method (with antibody coating for each assay) was performed 9 times over 3 months to establish calibration stability and re-peatability. As shown in Figure 1, the sensitivity of AOZ detection in assay buffer is greater than in the egg matrix throughout the calibration range of 0.05–5 µg/l. The mean IC50 values for the 9 repeat-ed assays, i.e. the detection levels with the highest sensitivity, were 0.12 µg/l in PBS and 0.324 µg/l in the egg matrix. The variation coefficient for each point on the standard AOZ curve ranged from 8.4 to 33.5% (buffer) and 7.3 to 19.2% (matrix) which indicate good reproducibility. The standard curve
generated in buffer was used for calibration of the assays using solvent and SP extraction.
Determination of LoD, detection capability (CCβ) and assay recovery
Twenty chicken eggs, collected from the Southern Moravia region, were analysed by three different ELISA procedures. Figure 2 depicts the assessment of LoD and the CCß for the SE-ELISA performance. The LoD defined here is the concentration of the absorbance value corresponding to the average ab-sorbance at zero AOZ concentration plus 3 times the standard deviation of the absorbance at zero concentration. Dashed line in Figure 2 indicates the average concentration of 20 blanks plus three standard deviations. The CCβ was assessed by using each extraction procedure combined with ELISA to examine 20 blank egg samples fortified at and below the minimum required performance level in equi-distant steps. Samples fortified at 0.3 µg/kgAOZ in all cases gave a greater value than the calculated LoD of 0.09 µg/kg. The detection capability of the ELISA using solvent extraction was determined to be 0.3 µg/kg. Similar results were obtained for the BE-ELISA and SPE-ELISA procedures.
Table 1 presents calculated LoDs and measured values of blank samples fortified with AOZ at the level of the detection capability for three ELISA methods. The SPE-ELISA system allowed detection capability and LoD to reach 0.3 µg/kg and 0.0089 µg/kg, respectively, whereas the BE-ELISA showed to be less sensitive but still very effective (0.6 µg/kg and 0.162 µg/kg). Table 2 compares AOZ recovery
0 0.01 0.1 1 10
0.0 0.2 0.4 0.6 0.8 1.0
SE- and SPE-ELISA BE-ELISA
B
/B0
AOZ (�g/l)
0 5 10 15 20
0.0 0.1 0.2 0.3 0.4 0.5 0.6
A
O
Z
(
�
g/
kg
)
Sample No.
AOZ free eggs
AOZ fortified eggs (0.3 �g/kg)
[image:6.595.65.288.83.247.2]LoD Figure 1. Standard curves of NPAOZ in buffer (used for
SE-ELISA and SPE-ELISA) and in the BE supernatant (used for BE-ELISA). Concentrations are expressed as equivalent underivatised AOZ. The bars show the stand-ard deviation for 9 replicate assays performed over 3 months. Reagent dilutions: antibody coating, 1:10 000, tracer CPAOZ-HRP, 1:20 000 (matrix matched curve); antibody coating, 1:10 000; tracer CPAOZ-HRP, 1:80 000 (buffer curve)
[image:6.595.307.526.569.742.2]Table 1. Limit of detection and determination of AOZ in fortified samples
SE-ELISA SPE-ELISA BE-ELISA Representative blank samples (n = 20)
Mean ± SD (µg/kg) 0.044 ± 0.015 0.035 ± 0.023 0.069 ± 0.031 LoD (mean + 3 SD; µg/kg) 0.089 0.104 0162 Fortified samples (n = 20)
AOZ added (µg/kg)* 0.300 0.300 0.600 Mean ± SD (µg/kg) 0.271 ± 0.046 0.249 ± 0.038 0.377 ± 0.074
Recovery (%) 90.2 82.9 62.8
*The concentrations of added AOZ are identical to the detection capability values determined
Table 2. Precision, recovery and repeatibility of ELISA methods
Method concentration (µg/kg)Fortified n Mean ± SD (µg/kg) CV(%) Recovery (%)
Intra-assay coefficient of variation
SE-ELISA
sample 1 0.3 6 0.29 ± 0.03 9.3 97.2 sample 2 1 6 0.80 ± 0.11 13.9 79.5 sample 3 3 6 1.98 ± 0.38 19.6 65.8
SPE-ELISA
sample 1 0.3 6 0.40 ± 0.03 8.2 132.2 sample 2 1 6 0.97 ± 0.13 13.3 97.2 sample 3 3 6 3.04 ± 0.72 23.7 101.2
BE-ELISA
sample 1 0.5 8 0.34 ± 0.07 21.3 67.0 sample 2 1 8 0.75 ± 0.07 9.5 74.6 sample 3 5 8 4.13 ± 0.32 7.7 82.5
Inter-assay coefficient of variation
SE-ELISA
sample 1 0.3 6 0.27 ± 0.03 10.3 90.0 sample 2 1 6 0.76 ± 0.11 14.0 75.8 sample 3 3 6 2.15 ± 0.15 7.1 71.7
SPE-ELISA
sample 1 0.3 3 0.32 ± 0.04 11.9 105.5 sample 2 1 3 0.92 ± 0.07 7.7 92.4 sample 3 3 3 2.52 ± 0.63 25.3 84.1
BE-ELISA
sample 1 0.5 4 0.43 ± 0.12 27.1 86.3 sample 2 1 4 0.82 ± 0.12 14.3 82.1 sample 3 5 4 4.20 ± 0.53 12.8 82.9
n = numer of measurements; R = numer of repeated assays
values obtained in blank samples fortified with AOZ, at levels of 0.3, 1, and 3 µg/kg for SE and SPE procedures, and 0.5, 1, and 5 µg/kg for the BE-ELISA. The average recovery for the SPE meth-od was higher than for the SE-ELISA and BE-ELISA. The procedures provided comparable intra-assay
[image:7.595.66.536.295.640.2]re-spective ELISA methods. As shown in Table 2, the inter-assay variability had similar characteristics as for the intra-assay measurement.
Comparison of ELISA with LC-MS/MS
The accuracy of the validated ELISA procedures were determined by the comparison of results with LC-MS/MS data. The procedures were tested using the same incurred egg samples as prepared with-in this study. The results obtawith-ined by the ELISA methods and LC-MS/MS are compared in Figure 3.
A good correlation between the respective ELISA procedures and LC-MS/MS results was found in the identical concentration range (0–5 µg/kg) (r = 0.99, n = 14). In all cases, the ELISA showed more or less, an underestimation of AOZ concentra-tion in comparison to the reference method. The slope of the graph showing the SPE-ELISA method, indicates less of an underestimation than for the SE- and BE-ELISA methods. The ELISA underesti-mation may be due to the incomplete derivatisation of AOZ, extraction efficiencies, matrix effects or other factors. However, these results are consist-ent with those found by Cooper et al. (2004b) and Diblikova et al. (2005).
AOZ monitoring in eggs using ELISA
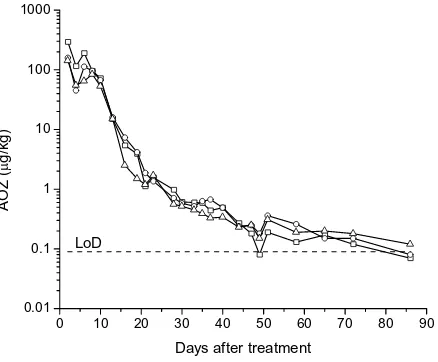
[image:8.595.64.290.86.265.2]The results of the AOZ monitoring in eggs col-lected from six chickens are shown in Figures 4 and 5. The samples were analysed using the SE-ELISA procedure over a course of 3 months. The AOZ con-centrations in egg samples from chickens treated with 30 mg/kg of furazolidone, determined 2 days after ending treatment, ranged from 11–17 µg/kg (Figure 4). AOZ concentrations of egg homoge-nates from chickens treated with 400 mg/kg of furazolidone, also determined 2 days after ending treatment, ranged from 142–293 µg/kg (Figure 5). A decrease in AOZ concentration towards the LoD (0.09 µg/kg) for chickens treated with 30 and 400 mg/kg occurred for 40 and 86 days after end-ing each treatment, respectively. This lengthy with-drawal period and the stability of AOZ residues
0 1 2 3 4 5 6
0 1 2 3 4 5 6
SPE-ELISA SE-ELISA BE-ELISA
E
LI
S
A
(
�
g/
kg
)
[image:8.595.309.528.539.720.2]LC-MS/MS (�g/kg)
Figure 3. Correlation of the results obtained by ELISA and LC-MS/MS. The regression equations for the SPE-ELISA, SE-ELISA and BE-ELISA are y1 = –0.03 + 0.94x, y2 = 0.015 + 0.65x, y3 = 0.097 + 0.58x, respectively
0 5 10 15 20 25 30 35 40
0.01 0.1 1 10 100
A
O
Z
(
�
g/
kg
)
Days after treatment LoD
0 10 20 30 40 50 60 70 80 90
0.01 0.1 1 10 100 1000
A
O
Z
(
�
g/
kg
)
Days after treatment LoD
[image:8.595.64.290.540.720.2]Figure 4. AOZ in eggs from 3 chickens after treatment for 10 days with 30 mg furazolidone per kg of feed
confirms that AOZ is a more relevant marker of the furazolidone ban than parent drug and also demonstrates the long-term stability of this me-tabolite in eggs.
CONCLUSIONS
Three different sample preparation methods linked with ELISA detection were investigated and compared with LC-MS/MS for the determi-nation of protein bound AOZ in eggs. The sim-plified ELISA, developed in this study, allowed the detection of AOZ in sample supernatant, and offers the analysis of high sample numbers in comparison with the methods based on traditional extraction procedures. The detection capability of the ELISA methods were between 0.3 µg/kgand 0.6 µg/kg and the LoD ranged between 0.09 and 0.16 µg/kg. This is well below the criteria set down by the Commission Decision (2003) that states the MRPL for tissue bound residues of nitrofurans is 1 µg/kg. With re-spect to the slight drop in detection capability, the simplified BE-ELISA approach performs comparably to other validated extraction methods and offers the advantage of time and cost efficiency. The results from the three ELISA methods and LC-MS/MS were highly correlated for incurred egg samples. When the AOZ concentrations determined by these ELISAs are corrected by control samples, the meth-ods can be used as a reliable analytical means for the quantification of AOZ in eggs. The simplified ELISA with the matrix-matched calibration can be less ef-fective if small numbers of various matrices are to be analysed. On the other hand, ELISAs in combination with conventional extraction procedures are better usable to a broader scale of food matrices such as muscle, liver, or honey samples.
Acknowledgement
The authors want to thank Eloise H. Kok for careful reading of the manuscript that improved its quality.
REFERENCES
Angelini N.M., Rampini O.D., Mugica H. (1997): Liquid chromatographic determination of nitrofuran residues in bovine muscle tissues. Journal of AOAC Interna-tional, 80, 481–485.
Botsoglou N.A. (1988): Determination of furazolidone in eggs by high-performance liquid-chromatography. Journal of Agricultural and Food Chemistry, 36, 1224–1227. Carignan G., Macintosh A.I., Sved S. (1990): An assay for
furazolidone residues by liquid-chromatography with electrochemical detection applicable to depletion stud-ies in pigs. Journal of Agricultural and Food Chemistry, 38, 716–720.
Commission Decision 2002/181/EC (2003): of 13 March 2003 amending Decision 2002/657/EC as regards the setting of minimum required performance limits (MR-PLs) for certain residues in food of animal origin. Official Journal of the European Communities, L71, 17–18. Commission Regulation (EC) 1442/95 (1995): of 26 June 1995
amending Annexes I, II, III and IV of Regulation (ECC) No 2377/90 laying down a Community Procedure for the es-tablishment of maximum residue limits of veterinary me-dicinal products in foodstuffs of animal origin. Official Journal of the European Communities, L143, 26–30. Conneely A., Nugent A., O’Keeffe M. (2002): Use of solid
phase extraction for the isolation and clean-up of a derivatised furazolidone metabolite from animal tis-sues. Analyst, 127, 705–709.
Cooper K.M., Caddell A., Elliott C.T., Kennedy D.G. (2004a): Production and characterisation of polyclonal antibodies to a derivative of 3-amino-2-oxazolidinone, a metabolite of the nitrofuran furazolidone. Analytica Chimica Acta, 520, 79–86.
Cooper K.M., Elliott C.T., Kennedy D.G. (2004b): Detec-tion of 3-amino-2-oxazolidinone (AOZ), a tissue-bound metabolite of the nitrofuran furazolidone, in prawn tissue by enzyme immunoassay. Food Additives and Contaminants, 21, 841–848.
Diblikova I., Cooper K.M., Kennedy D.G., Franek M. (2005): Monoclonal antibody-based ELISA for the quantification of nitrofuran metabolite 3-amino-2-oxa- zolidinone in tissues using a simplified sample prepa-ration. Analytica Chimica Acta, 540, 285–292. Draisci R., Giannetti L., Lucentini L., Palleschi L.,
Bram-billa G., Serpe L., Gallo P. (1997): Determination of nitrofuran residues in avian eggs by liquid chromatog-raphy UV photodiode array detection and confirmation by liquid chromatography ionspray mass spectrometry. Journal of Chromatography A, 777, 201–211.
European Commission (2005): Rapid Alert System for Food and Feed, Annual Report 2004. http://europa. eu.int/comm/food/food/rapidalert/index_en.htm Gottschall D.W., Wang R. (1995): Depletion and
Bioavail-ability of [C-14] Furazolidone residues in swine tissues. Journal of Agricultural and Food Chemistry, 43, 2520– 2525.
Kuiper H.A. (1991): Use of pig hepatocytes to study the inhibition of monoamine oxidase by furazolidone. Food and Chemical Toxicology 29, 185–191.
Hoogenboom L.A., Berghmans M.C., Polman T.H., Parker R., Shaw I.C. (1992): Depletion of protein-bound furazolidone metabolites containing the 3-amino-2-oxazolidinone side-chain from liver, kidney and muscle tissues from pigs. Food Addit Contam, 9, 623–630.
Horne E., Cadogan A., O’Keeffe M., Hoogenboom L.A.P. (1996): Analysis of protein-bound metabolites of fura-zolidone and furaltadone in pig liver by high-perform-ance liquid chromatography and liquid chromatography mass spectrometry. Analyst, 121, 1463–1468.
Kumar L., Toothill J.R., Ho K.B. (1994): Determination of nitrofuran residues in poultry muscle tissues and eggs by liquid-chromatography. Journal of AOAC In-ternational, 77, 591–595.
Leitner A., Zollner P., Lindner W. (2001): Determination of the metabolites of nitrofuran antibiotics in animal tissue by high-performance liquid chromatography-tandem mass spectrometry. Journal of Chromatogra-phy A, 939, 49–58.
McCalla D.R. (1983): Mutagenicity of nitrofuran derivatives – Review. Environmental Mutagenesis, 5, 745–765. McCracken R.J., Kennedy D.G. (1997a): The
bioavailabil-ity of residues of the furazolidone metabolite 3-amino-2-oxazolidinone in porcine tissues and the effect of cooking upon residue concentrations. Food Additives and Contaminants, 14, 507–513.
McCracken R.J., Kennedy D.G. (1997b): Determination of the furazolidone metabolite, 3-amino-2-oxa- zolidinone, in porcine tissues using liquid chromatog-raphy-thermospray mass spectrometry and the oc- currence of residues in pigs produced in Northern Ire-land. Journal of Chromatography B, 691, 87–94. McCracken R.J., Blanchflower W.J., Rowan C., Mccoy
M.A., Kennedy D.G. (1995): Determination of fura-zo-lidone in porcine tissue using thermospray liquid chro-matography-mass spectrometry and a study of the pharmacokinetics and stability of its residues. Analyst, 120, 2347–2351.
McCracken R.J., Mccoy M.A., Kennedy D.G. (1997): The prevalence and possible causes of bound and extract-able residues of the furazolidone metabolite
3-amino-2-oxazolidinone in porcine tissues. Food Additives and Contaminants, 14, 287–294.
McCracken R.J., Spence D.E., Floyd S.D., Kennedy D.G. (2001): Evaluation of the residues of furazolidone and its metabolite, 3-amino-2-oxazolidinone (AOZ), in eggs. Food Additives and Contaminants, 18, 954–959. Mottier P., Khong S.P., Gremaud E., Richoz J., Delatour
T., Goldmann T., Guy P.A. (2005): Quantitative deter-mination of four nitrofuran metabolites in meat by isotope dilution liquid chromatography-electrospray ionisation-tandem mass spectrometry. Journal of Chromatography A, 1067, 85–91.
Nouws J.F.M., Laurensen J. (1990): Postmortal degrada-tion of furazolidone and furaltadone in edible tissues of calves. Veterinary Quarterly, 12, 56–59.
O’Keeffe M., Conneely A., Cooper K.M., Kennedy D.G., Kovacsics L., Fodor A., Mulder P.P.J., van Rhijn J.A., Trigueros G. (2004): Nitrofuran antibiotic residues in pork The FoodBRAND retail survey. Analytica Chim-ica Acta, 520, 125–131.
Parks O.W., Kubena L.F. (1990): Liquid chromatography-electrochemical detection of furazolidone and metabolite in extracts of incurred tissues. Journal of the Association of Official Analytical Chemists, 73, 526–528.
Van Koten-Vermeulen J.E.M. (1993): Report of the 40th Meeting of the Joint FAO/WHO Expert Committee on Food Additives (JECFA), World Health Organisa-tion, Geneva. 85.
Vass M., Kotkova L., Diblikova I., Nevorankova Z., Cooper K.M., Kennedy D.G., Franek M. (2005): Production and characterisation of monoclonal anti-bodies for the detection of AOZ, a tissue bound metabolite of furazolidone. Veterinarni Medicina, 50, 300–310.
Vroomen L.H., van Bladeren P.J., Groten J.P., Wissink C.J., Kuiper H.A., Berghmans M.C. (1990): In vivo and in vitro metabolic studies of furazolidone: a risk evaluation. Drug Metabolism Reviews. 22, 663–676. Yoshida K., Kondo F. (1995): Liquid chromatographic
determination of furazolidone in swine serum and avian egg. Journal of AOAC International, 78, 1126–1129.
Received: 2005–12–11 Accepted after corrections: 2006–04–14
Corresponding Author: