Effect of High Temperature and Pressure on Quantification
of MON 810 Maize
Zuzana GODÁLOVÁ, Eva BERGEROVÁ and Peter SIEKEL
Department of Microbiology, Molecular Biology and Biotechnology, Food Research Institute, Bratislava, Slovak Republic
Abstract
Godálová Z., Bergerová E., Siekel P. (2013): Effect of high temperature and pressure on quantifica-tion of MON 810 maize. Czech J. Food Sci., 31: 376–381.
Maize MON 810 (Zea mays L.) is the only transgenic cultivar grown in the European Union countries and food products with its content higher than 0.9% must be labelled. Processing such as high temperature (121°C), elevated pressure (0.1 MPa), and low pH 2.25 fragmented DNA. A two order difference in the species specific gene content compared to the transgenic DNA content in plant materials used has led to false negative results in the quantification of trans-genic DNA. The maize containing 4.2% of the transgene after processing appeared to be as low as 3.0% (100°C) and 1.9% (121°C, 0.1 MPa). The 2.1% amount of the transgene dropped at 100°C to 1.0% and at 121°C, 0.1 MPa to 0.6%. Determination of GMO (Genetically Modified Organism) content in processed foods may lead to incorrect statement and labelling could mislead consumers in these cases.
Keywords: DNA degradation; PCR; highly processed foods
Supported by the Ministry of Agriculture and Rural Development of the Slovak Republic, Project No. 5200/2008-8620. Food inspection bodies in the EU countries focus
on food quality and safety. Genetically modified foods are of specific interest due to a long-term controversy accompanying their cultivation and consumption (Klintman 2002; Frewer et al. 2004). Maize and soybean represent the majority of ge-netically modified food crops cultivated until now (James 2010). Maize MON 810 (Zea mays L.) is the only transgenic cultivar grown in the EU countries. Determination of the precise content of a transgenic constituent in food is an obligatory requirement of the EU legislative (Regulation EU 1829/2003; Regulation EU 1830/2003). The European legislation requires labelling of the GMO (Genetically Modified Organism) content in foods; however, the analytical methods were developed for raw plant materials only (Mazzara et al. 2011). Food processing, and DNA degradation associated with it, may affect the quality of analytical results. It was found that the degree of technological treatment of foods affects the quantity assessment of the transgenic ingredient. Then, the
declared GM content of the processed food may be under- or overestimated (Berdal & Holst-Jensen 2001), which may mislead consumers. Labelling of the GMO content is obligatory except the amount lower than 0.9% of the accidentally and technically unavoidable admixture.
The biological methods for detection of food components are generally protein- or DNA-based. The method widely used for DNA detection and quantification is PCR (Michelini et al. 2008). The qualitative and quantitative methods, primarily DNA-based polymerase chain reaction (PCR), were developed and validated by JRC of EU for raw plant materials, not for processed foods (http:// gmo-crl.jrc.ec.europa.eu/statusofdoss.htm).
nega-tively influenced by processing (Gryson et al. 2008; Hrnčírová et al. 2008; Bergerová et al. 2010, 2011).
Moderate food processing has shown no signifi-cant effect on relative quantification of transgenic content (Debode et al. 2007; Bergerová et al. 2010). A successful quantification of extremely processed meat products by the real-time PCR was achieved when amplicons up to 351 base pairs were used (Hird et al. 2006). Several authors found out that food processing associated DNA degradation may affect the quality of PCR analytical results (Meyer et al. 1996; Straub et al. 1999; Gryson et al. 2008). Significant differences between the raw materials and the trial-produced processed foods were shown later (Yoshimura et al. 2005). Thermal sterilisation is a basic procedure of food preservation. Temperature up to 121°C is used in the canning industry to inactivate toxicogenic microflora. Pickles, including maize in sweet and sour vinegar brine, are usually offered as side meals or as appetisers.
The aim of this study was to determine how technological processing such as high temperature, elevated pressure and low pH may affect DNA degradation and quantification in the transgene content of the plant matrix using PCR.
MATERIAL AND METHODS
Plant material. Raw and canned maize (Zea mays L.) grains were purchased from local markets. The modified samples of maize MON 810 were obtained from Agrokomplex Kunovice, Czech Republic.
Processing methods. Maize seeds were pickled in three different brines. The control brine was salty (pH 7.6; 20 g table salt/1 l of drinking water). The 1st experimental brine was sweet and sour (pH 2.25; 20 g table salt, 100 g table sugar, 250 ml 8% vinegar and 1 l of drinking water). The 2nd sweet and sour brine (pH 4.25) was the same as the first one with the exception that only 3 ml of vinegar were used. Samples of maize seeds were processed by two different sterilisation procedures – the first one (100°C; 10, 20, and 30 min) in a water bath, and the second one (121ºC; 2, 5, and 10 min; 0.1 MPa) – autoclaving. The samples were left in these brines for 3 weeks and afterwards DNA was extracted.
DNA extraction. Sterilised samples were homog-enised by the AY47R1 mixer (Moulinex, Barcelona, Spain). Each of the flour fractions was extracted in
triplicate by the cetyl trimethyl ammonium bromide (CTAB) method (Trifa & Zhang 2004), as this method appeared to be the most suitable in our experiments due to a high yield of good quality DNA and was used in all extraction procedures. DNA concentration was determined spectropho-tometrically (SmartSpecPlus spectrophotometer; BioRad, Hercules, USA), the final volume of DNA solution was set to 60 µl.
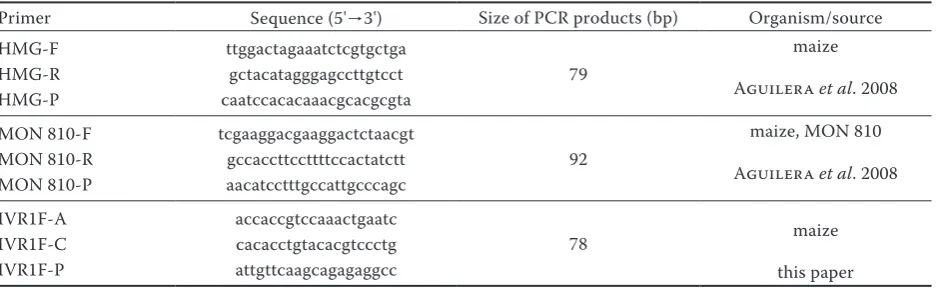
Monitoring of DNA degradation. PCR in quali-tative setting was used to monitor DNA degrada-tion. It was performed in 25 ml volumes using the Thermal Cycler (BioRad iCycler; Bio-Rad Labo-ratories, Sergate, Italy). The protocols for PCR involved 40 cycles of initial denaturation at 95°C for 5 min, denaturation at 95°C for 30 s, annealing at 60°C for 30 s, polymerisation at 72°C for 1 min and final extension at 72°C for 10 minutes. The sequences in the GeneBank (National Center for Biotechnology Information, Bethesda, USA) for maize hmg, cry1Ab, and inv genes (Table 1) were used for primer design, which was performed by the Primer 3 program (Whitehead Institute Nine Cambridge Center, Cambridge, USA). Negative control samples consisted of the master mix only with no DNA added.
Quantitative analysis of transgene DNA and plant specific DNA. The cyclers GeneAmp PCR System 7900 (Applied Biosystems, Foster City, USA) and the BioRad iCycler for quantitative analysis of transgene DNA of MON 810 were used. The reaction mixture consisted of 1× concentrated PCR buffer (Qiagen,Hilden, Germany); 2.5 mmol/l MgCl2; 200 µmol/l dNTP (Invitrogen, Carlsbad, USA); 0.3 µmol/l primers (Table 1); 10 mmol/l probe (Table 1); 1 U Hot Star Taq polymerase (Qiagen); and 2.5 µl of DNA. The real-time PCR was performed in 96-well reaction plates covered by optical caps or optical films (Applied Biosys-tems, Foster City, USA). The protocols for PCR involved 45 cycles of initial denaturation at 95°C for 5 min, denaturation at 95°C for 30 s and an-nealing at 60°C for 30 seconds.
Table 1. Primers and probes used
Primer Sequence (5'→3') Size of PCR products (bp) Organism/source HMG-F ttggactagaaatctcgtgctga
79
maize HMG-R gctacatagggagccttgtcct
Aguilera et al. 2008 HMG-P caatccacacaaacgcacgcgta
MON 810-F tcgaaggacgaaggactctaacgt
92
maize, MON 810 MON 810-R gccaccttccttttccactatctt
Aguilera et al. 2008 MON 810-P aacatcctttgccattgcccagc
IVR1F-A accaccgtccaaactgaatc
78 maize
IVR1F-C cacacctgtacacgtccctg
IVR1F-P attgttcaagcagagaggcc this paper
HMG – primers for high mobility gene (reference gene); MON 810 – primers for the maize MON 810 (transgene); IVR – primers for invertase gene (reference gene); F – forward primer; R – reverse primer; P – probe; bp – basic pair
RESULTS AND DISCUSSION
The influence of technological processes on the measurement of transgenic DNA content in geneti-cally modified food samples was studied by the real-time PCR. This study proved that harsh food processing affects the quantification of transgenic content of maize products. Maize was processed under various technological conditions (tempera-ture, pressure, pH) and collected at different time intervals.
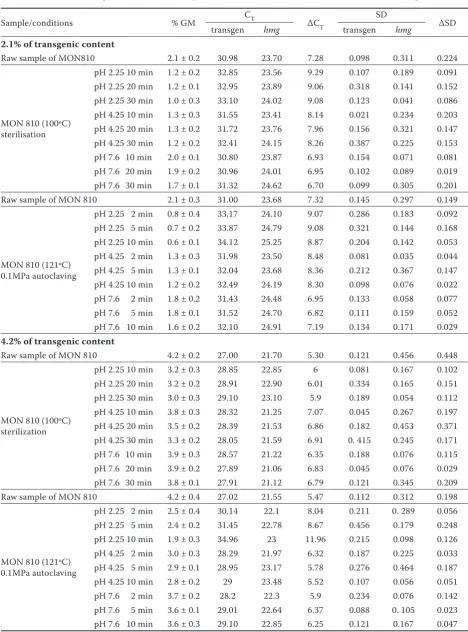
Quantitative analyses of experimentally processed foods containing maize MON 810 at two percentage levels of the transgenic content (4.2 and 2.1%) were studied in this publication (Table 2). The results showed that DNA degradation is affected consid-erably by the type of processing used. The type of plant matrix had a smaller impact (Table 2). After processing (100°C) of the maize samples containing 4.2 and 2.1% of MON 810 the transgenic content was 3.13 and 1.13%, respectively (Table 2). The most pronounced effect on DNA integrity was exerted by the combination of pressure, pH, and temperature (121°C and 0.1 MPa). Transgenic content after such processing showed a lower percentage (0.7 and 2.26%) than was the initial one (2.1 and 4.2%) at the beginning of the experiment (Table 2). We assume that the determination of the lower content in our processed samples was on the account of a two or-der difference in the species specific gene content compared to the transgenic DNA content in plant materials used. Under such experimental make up the DNA degradation of transgenic content showed a 2 or 3 times higher decrease as a consequence of the unequal gene presence when the transgene
is present in one copy per cell, while housekeep-ing gene is present in two copies. Moreover, this inequality is accentuated by the above-mentioned two order differences in the percentage content of the compared genes when the species specific genes are present as 100% and the content of transgenic genes is 2.1% or 4.2%. Such disparity is expressed as a considerable decrease in the transgenic content while the decrease in species specific gene content remains unnoticed. In such a case labelling of the GMO content in foods may be underestimated and incorrect as such.
When moderate processing conditions were used, no effect on DNA quantification was observed in our previous experiments. We recommended the application of amplicons shorter than 300 bp if amplification was done in highly processed food (Bergerová et al. 2011). Contrary to our earlier findings the discrepancy in the quantification of MON 810 transgenic content in maize pickled in vinegar brine and preserved by sterilisation is shown in this paper.
Table 2. Effect of technological treatment on the quantification DNA in MON 810 – 2.1% and 4.2% of transgenic content
Sample/conditions % GM CT ∆CT SD ∆SD
transgen hmg transgen hmg
2.1% of transgenic content
Raw sample of MON810 2.1 ± 0.2 30.98 23.70 7.28 0.098 0.311 0.224
MON 810 (100ºC) sterilisation
pH 2.25 10 min 1.2 ± 0.2 32.85 23.56 9.29 0.107 0.189 0.091 pH 2.25 20 min 1.2 ± 0.1 32.95 23.89 9.06 0.318 0.141 0.152 pH 2.25 30 min 1.0 ± 0.3 33.10 24.02 9.08 0.123 0.041 0.086 pH 4.25 10 min 1.3 ± 0.3 31.55 23.41 8.14 0.021 0.234 0.203 pH 4.25 20 min 1.3 ± 0.2 31.72 23.76 7.96 0.156 0.321 0.147 pH 4.25 30 min 1.2 ± 0.2 32.41 24.15 8.26 0.387 0.225 0.153 pH 7.6 10 min 2.0 ± 0.1 30.80 23.87 6.93 0.154 0.071 0.081 pH 7.6 20 min 1.9 ± 0.2 30.96 24.01 6.95 0.102 0.089 0.019 pH 7.6 30 min 1.7 ± 0.1 31.32 24.62 6.70 0.099 0.305 0.201 Raw sample of MON 810 2.1 ± 0.3 31.00 23.68 7.32 0.145 0.297 0.149
MON 810 (121ºC) 0.1MPa autoclaving
pH 2.25 2 min 0.8 ± 0.4 33.17 24.10 9.07 0.286 0.183 0.092 pH 2.25 5 min 0.7 ± 0.2 33.87 24.79 9.08 0.321 0.144 0.168 pH 2.25 10 min 0.6 ± 0.1 34.12 25.25 8.87 0.204 0.142 0.053 pH 4.25 2 min 1.3 ± 0.3 31.98 23.50 8.48 0.081 0.035 0.044 pH 4.25 5 min 1.3 ± 0.1 32.04 23.68 8.36 0.212 0.367 0.147 pH 4.25 10 min 1.2 ± 0.2 32.49 24.19 8.30 0.098 0.076 0.022 pH 7.6 2 min 1.8 ± 0.2 31.43 24.48 6.95 0.133 0.058 0.077 pH 7.6 5 min 1.8 ± 0.1 31.52 24.70 6.82 0.111 0.159 0.052 pH 7.6 10 min 1.6 ± 0.2 32.10 24.91 7.19 0.134 0.171 0.029 4.2% of transgenic content
Raw sample of MON 810 4.2 ± 0.2 27.00 21.70 5.30 0.121 0.456 0.448
MON 810 (100ºC) sterilization
pH 2.25 10 min 3.2 ± 0.3 28.85 22.85 6 0.081 0.167 0.102 pH 2.25 20 min 3.2 ± 0.2 28.91 22.90 6.01 0.334 0.165 0.151 pH 2.25 30 min 3.0 ± 0.3 29.10 23.10 5.9 0.189 0.054 0.112 pH 4.25 10 min 3.8 ± 0.3 28.32 21.25 7.07 0.045 0.267 0.197 pH 4.25 20 min 3.5 ± 0.2 28.39 21.53 6.86 0.182 0.453 0.371 pH 4.25 30 min 3.3 ± 0.2 28.05 21.59 6.91 0. 415 0.245 0.171 pH 7.6 10 min 3.9 ± 0.3 28.57 21.22 6.35 0.188 0.076 0.115 pH 7.6 20 min 3.9 ± 0.2 27.89 21.06 6.83 0.045 0.076 0.029 pH 7.6 30 min 3.8 ± 0.1 27.91 21.12 6.79 0.121 0.345 0.209 Raw sample of MON 810 4.2 ± 0.4 27.02 21.55 5.47 0.112 0.312 0.198
MON 810 (121ºC) 0.1MPa autoclaving
pH 2.25 2 min 2.5 ± 0.4 30.14 22.1 8.04 0.211 0. 289 0.056 pH 2.25 5 min 2.4 ± 0.2 31.45 22.78 8.67 0.456 0.179 0.248 pH 2.25 10 min 1.9 ± 0.3 34.96 23 11.96 0.215 0.098 0.126 pH 4.25 2 min 3.0 ± 0.3 28.29 21.97 6.32 0.187 0.225 0.033 pH 4.25 5 min 2.9 ± 0.1 28.95 23.17 5.78 0.276 0.464 0.187 pH 4.25 10 min 2.8 ± 0.2 29 23.48 5.52 0.107 0.056 0.051 pH 7.6 2 min 3.7 ± 0.2 28.2 22.3 5.9 0.234 0.076 0.142 pH 7.6 5 min 3.6 ± 0.1 29.01 22.64 6.37 0.088 0. 105 0.023 pH 7.6 10 min 3.6 ± 0.3 29.10 22.85 6.25 0.121 0.167 0.047
the trueness of relative quantification of genetically modified foods were demanded (Engel et al. 2006). In our previous experiments we also showed that moderate food processing conditions resulted in no differences of the GMO content when compared to the untreated control (Hrnčírová et al. 2008; Bergerová et al. 2010).
Food processing degrades DNA and may affect the DNA-based food analyses (Meyer et al. 1996; Straub et al. 1999; Gryson et al. 2008; Bergerová et al. 2010). PCR analysis of the sterilised (100 and 121°C) samples revealed a reduction of the extracted DNA size in a time dependent manner and differ-ent conditions such as pH and increased pressure (Kollárovič et al. 2005; Moreano et al. 2005; Hrnčírová et al. 2008). A similar effect of baking on the DNA integrity was also described previously (Kollárovič et al. 2005; Moreano et al. 2005; Gryson et al. 2008; Hrnčírová et al. 2008).
Small or no differences in amplification rates of boiled or baked meat samples compared to raw samples for amplicons ranging from 81 bp up to 240 bp were proved (Hird et al. 2006). However, the more harsh treatment, such as canning, sig-nificantly increased CT (Cycle Threshold) values for all amplicons, where the highest values were for the larger ones (Hird et al. 2006). Similarly, we observed increased CT values for transgenic content after processing. These values increased with the harsh conditions expressed as ΔCT (delta Cycle Threshold). This was not the case of the two plant specific genes used as a control to each other.
CONCLUSION
The effect of technological processing parameters on the quantification of GM content in foods was monitored by the real time-PCR. We concluded that heat processing per se has no practical consequences for the quantification of transgene content in foods. In a model setting where high temperature process-ing was combined with higher pressure and low pH a pronounced effect on the integrity of plant DNA was demonstrated and thus the quantification of transgenic content in foods was influenced. The two- and three-fold drop of the transgenic content was shown. We assume that the lower transgenic content in processed samples compared to that before processing was observed due to uneven gene copy numbers of the involved genes. The two orders of magnitude of the higher content of
species specific genes compared to the transgenes combined with the harshness of processing were involved. As a consequence of this disparity the lower copy number gene degradation was seen as a drop of the GM content. The other reason for the discrepancies in GMO content is a difference in the size of the control and transgenic amplicon. It appears that the transgene is more affected and less stable after technological treatment than the reference gene. So in practical/routine analysis, the decrease in GMO content of processed food might be shown, as we observed.
References
Aguilera M., Querci M., Balla B., Prospero A., Er-molli M., Van den Eede G. (2008): A qualitative ap-proach for the assessment of the genetic stability of the MON 810 trait in commercial seed maize varieties. Food Analytical Methods, 1: 252–258.
Bergerová E., Hrnčírová Z., Stankovská M., Lopa- šovská M., Siekel P. (2010): Effect of thermal treatment on the amplification and quantification of transgenic and non-transgenic soybean and maize DNA. Food Analytical Methods, 3: 211–218.
Bergerová E., Godálová Z., Siekel P. (2011): Combined effect of temperature, pressure and low pH on the DNA amplification of plant derived foods. Czech Journal of Food Sciences, 29: 337–345.
Berdal K.H., Holst-Jensen A. (2001): Roundup Ready soybean event-specific real-time quantitative PCR assay and estimation of the practical detection and quantifica-tion limits in GMO analyses. European Food Research Technology, 213: 432–238.
Debode F., Janssen E., Berben G. (2007): Physical degrada-tion of genomic DNA of soybean flours does not impair relative quantification of its transgenic content. European Food Research and Technology, 226: 273–280.
Engel K.H., Moreano F., Ehlert A., Busch U. (2006): Quantification of DNA from genetically modified organ-isms in composite and processed foods. Trends in Food Science and Technology, 17: 490–497.
Frewer L., Lassen J., Kettlitz B., Beekman V., Berdal K.G. (2004): Societal aspects of genetically modified foods. Food and Chemical Toxicology, 42: 1181–1193. Gryson N., Messens K., Dwettinck K. (2008): PCR
detection of soy ingredients in bread. European Food Research and Technology, 227: 345–351.
fragmen-Corresponding author:
Doc. Ing. Peter Siekel, CSc., Výskumny ústav potravinársky, Oddelenie mikrobiológie, molekulárnej biológie a biotechnológií, Priemyselna 4, 824 75Bratislava, Slovak Republic; E mail: [email protected]
tation and implications for the detection of meat using a real-time polymerase chain reaction. Food Additives and Contaminants, 23: 654–650.
Hrnčírová Z., Bergerová E., Siekel P. (2008): Effects of technological treatment on DNA degradation in selected food matrices of plant origin. Journal of Food and Nutri-tion Research, 47: 23–28.
Hurst C.D., Knight A., Bruce I.J. (1999): PCR detection of genetically modified soya and maize in foodstuffs. Molecular Breeding, 5: 579–586.
James C. (2010): Global Status of Commercialized Biotech/ GM Crops: 2010. ISAAA Brief No. 42. ISAAA, Ithaca. Available at http://www.isaaa.org
Klintmann M. (2002): The genetically modified (GM) food labelling controversy. Ideological and epistemic crossovers. Social Studies of Science,32:71–91.
Kollárovič G., Kretová M., Siekel P. (2005): Degrada-tion of plant DNA by food processing. Chemické listy, 99: 255–258.
Mazzara M., Grazioli E., Savini C., Van den Eede G. (2011): Report on the Verification of the Performance of a MON810 Event-specific Method on Maize Line MON810 Using Real-time PCR – Validation Report and Protocol. Available at http://gmo-jrl.jrc.ec.europa.eu/gmomethods/ pcr/jrc56609_mon810_verificationreport _protocol.pdf (accessed 25/04/2012).
Meyer R., Chardonnens F., Hübner P., Lüthy J. (1996): Polymerase chain reaction (PCR) in the quality and safety assurance of food: detection of soya in processed meat products. Zeitschrift für Lebensmittel-Untersuchung und -Forschung, 203: 339–344.
Michelini E., Simoni P., Cevelini L., Mezzanotte Z., Roda A. (2008): New trends in bioanalytical tools for the detection of genetically modified organisms: an update. Chemistry and Materials Science, 392: 355–367.
Moreano F., Busch U., Engel K.H. (2005): Distortion of genetically modified organisms quantification in pro-cessed foods: Influence of particle size composition and heat-induced DNA degradation. Journal of Agriculture and Food Chemistry, 53: 9971–9979.
Regulation (EC) No 1829/2003 of the European Parliament and of the Council of 22 September 2003 on genetically modified food and feed.Official Journal of the European Union, L 268:1–23.
Regulation (EC) No 1830/2003 of the European Parliament and of the Council of 22 September 2003 concerning the traceability and labelling of genetically modified organ-isms and the traceability of food and feed products pro-duced from genetically modified organisms and amending Directive 2001/18/EC. Official Journal of the European Union, L 268: 24–28.
Straub J.A., Hertel C., Hammes V.P. (1999): Limits of PCR-based detection method for genetically modified soya beans in wheat bread production. Zeitschrift für Lebens- mittel-Untersuchung und -Forschung A., 208: 77–82. Trifa Y., Zhang D. (2004): DNA content in embryo and
endosperm of maize kernel Zea mays L: Impact on GMO quantification. Journal of Agricultural and Food Chem-istry, 52: 1044–1048.
Yoshimura T., Kuribara H., Matsuoka T., Kodama T., Iida M., Watanabe T., Akiyama H., Maitani T., Furui S., Hino A. (2005): Applicability of the quantification of genetically modified organisms to food processed from maize and soy. Journal of Agriculture and Food Chem-istry, 53: 2052–2059.