Much attention has been paid to studying the nutrient properties in different areas and plots, dealing with total nutrient content, their forms and variability in the soil profile, with respect to their availability to plants.
In recent years the attention has been focused on spatial variability of nutrients in soils, comparing different ground covers and locations (Gallardo and Parama 2007, Wang et al. 2007). Differences in this characteristic were compared between individual plots, as well as within a plot; they were related to the possibility of exact identifica-tion of the plot and its parts and further usage of these data for specific measures, locally applied (Dahiya et al. 1985, Brodský et al. 2001, Baxter et al. 2003, etc.).
Apart from the spatial variability of the nutrient content of soil it is important to study its changes with time; these changes are clearly more distinct at labile forms, whose conclusiveness is time-lim-ited. Knowledge of these facts might be useful as a basis for fertilisation management practices.
In many areas, soils are enriched with sulphur in the form of fertilisers, especially for crops with
higher sulphur demands (Scherer 2001, Matula and Pechová 2002, Mathot et al. 2008, Skwierawska et al. 2008, etc.). This trend has become especially important in areas where atmospheric sulphur emission has been reduced. In relation to this, possibilities of sulphur nutrition diagnosis have been widely studied (Blake-Kalff et al. 2000, Matula and Pechová 2007, etc.). However, data on the total S content in soil and mainly on its spatial variability in different parts of the plots are rather scarce. From the global sulphur cycle it is clear that the majority of soil S is bound in organic compounds (Marschner 1995, Marschner and Rengel 2007); even a significant increase of S input from air does not result in a significant increase in S content in soil (Zhao et al. 1998, etc.). Therefore, most of S is washed out in the form of sulphates, especially under leaching conditions. As is evident in numer-ous studies, the most important sulphur forms for plant nutrition are sulphates or other more labile, easily mineralisable, organic compounds.
Attention paid to nitrogen is related to efforts that establish a basis for nitrogen fertiliser study. Different forms of soil N were measured to
estab-Spatial variability of total soil nitrogen and sulphur content
at two conventionally managed fields
V. Vaněk, J. Balík, J. Šilha, J. Černý
Czech University of Life Sciences, Prague, Czech Republic
ABSTRACT
Spatial variability of total soil nitrogen and sulphur content has been observed in two plots (I – 54 ha and II – 32 ha). Soil samples were taken from the topsoil in a regular grid, which was localised by GPS (individual sam-pling points were 80 m apart); subsequently total soil N and S contents were analysed. The average N content in plot I was 0.16%; in plot II it was 0.12%. The content of S in plots I and II was 0.09% and 0.08%, respectively. Spatial variability of total N differed in separate parts of the plots. A higher variability was recorded in plot I, where the co-efficient of variation (CV) was 15.7%, whereas in plot II it was only 11.1%. However, sulphur showed only little vari-ability, and thus its coefficient of variation was low (2.5 a 2.3% in plots I and II, respectively). A positive and mostly conclusive relationship has been observed between the N content of soil and the crop yield. This effect was more significant in plot II. The S content in soil showed no correlation with yield. Furthermore, positive correlations were observed between field altitude, soil moisture and crop yield in both plots.
Keywords: soil; nitrogen; sulphur; spatial variability; yield
lish their relationship to crop yield, including the possibility of use in precision agriculture (Baxter et al. 2003, Haberle et al. 2004, Šilha 2006, etc.).
The aim of our work was to study the correlation of spatial variability of total soil N and S contents with crop yield, slope of the plots and soil mois-ture in two plots and to specify individual zones within the plots for differential fertilisation man-agement.
MATERIAL AND METHODS
The measurement of total N and S contents was performed in two fields (plot I – 54 ha, plot II – 32 ha). The general characteristics are shown in Table 1. Both fields are located near the town of Český Brod, Czech Republic; they face south to southeast. Plot II has a higher slope and gen-erally greater differences in soil granularity. The exact location of the plots, their exposition and the slope rates are specified by the coordinates on the used maps. Both fields have been used for intensive cultivation of cereals and rape.
The soil on both plots is orthic luvisol, and the average annual precipitation and average annual temperature are 579 mm and 9.2°C, respectively.
The farm has no animal production and thus no manure has been used since 1990. The soil is enriched with post-harvest residues and green manure incorporation.
[image:2.595.63.533.87.159.2]Soil samples (up to the depth of 30 cm) were taken in a regular grid with the distance between individual sampling points of 80 m; in plot I, the organization of the grid was square, in plot II it was triangular. The sampling itself was carried out
Table 1. General characteristics of plots under study
Plot Area (ha) of sampling Number points (n)
Slope (%)
Crop cultivated
2002 2003 2004
I 54 88 4 winter wheat grain corn sunflower
[image:2.595.66.532.200.337.2]II 32 41 9 grain corn spring barley winter rape
Table 2. Total soil N and S contents (ppm) and their ratios in the plots under study
Parameter Plot I Plot II
N S N:S N S N:S
Average 1590 880 1.8 1224 825 1.5
Minimum 1135 813 1.4 904 774 1.2
Maximum 2025 927 2.2 1500 859 1.7
Median 1653 883 1.9 1223 826 l.5
Standard deviation 249 22 0.3 135 19 0.14
Coefficient of variation (%) 15.7 2.5 16.3 11.1 2.3 9.6
[image:2.595.307.527.436.738.2]with a drill hole in autumn 2001; eight samples were taken within a radius of 3 m around each point localised by GPS.
Total soil N and S contents were determined using the LECO CNS-2000 analyser, the results are given in ppm.
In the established points of the plots spatial variability of other parameters was also observed, including crop yield, slope rate, soil moisture, C content, content of available nutrients, pH, and the content of soilmineral and mineralisable N and total nitrogen content in plants during the growing
period. The obtained data were used to specify the correlation between total soil N and S contents and the above parameters. These have been largely discussed by Brodský et al. (2001), Borůvka et al. (2002), Štípek et al. (2004), and Šilha (2006).
The basic evaluation of data [arithmetic mean, median, standard deviation – σ, coefficient of variation – CV(%)] was carried out using the Statgraphics programme. Map plots displaying the spatial distribution of the parameters studied were processed in the Surfer v.6 (Golden Software) programme with the default girding method set-tings (interpolation – kriging with the default linear variogram).
RESULTS AND DISCUSSION
The values of total soil N and S contents in both study plots are given in Table 2. It is evi-dent that plot I shows a higher N content (around 0.16%), whereas plot II contains less N (around 0.12%). These values are common for arable soils (Marschner 1995, Vaněk et al. 2007, etc.). Other statistical data show that a higher oscillation of total N content was observed in plot I; the N content in the range between 0.11 and 0.20% resulted in the CV
of 15.7%. However, plot II with the N content oscil-lating between 0.09–0.15% had the CV 11.1%.
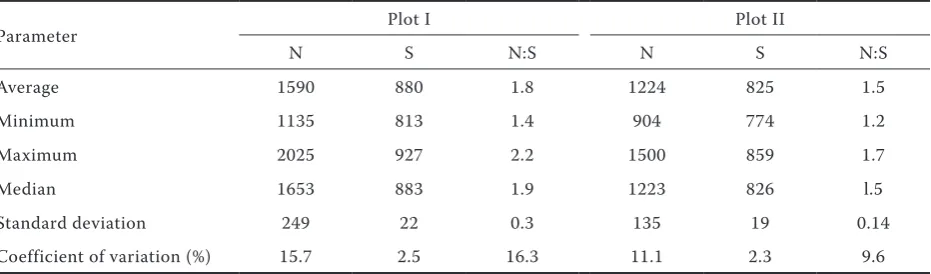
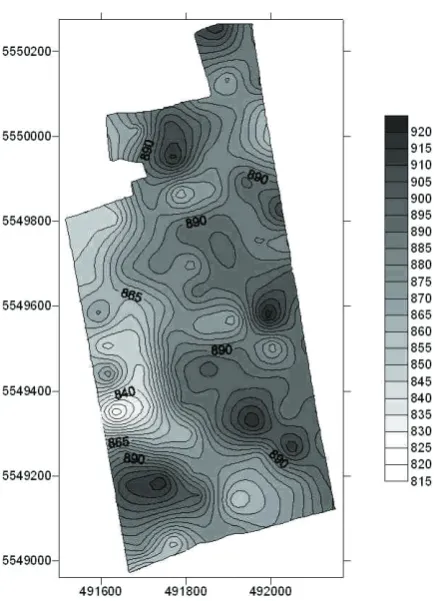
[image:3.595.131.462.59.227.2]Spatial variability of N content is shown in Figures 1 and 2; Figure 1 shows higher content of N in the western than in the eastern part of plot I. N content does not correlate with the slope (Figure 5), as was expected; in contrast, it is in-fluenced by different history of management at individual parts of the field. Plot II (Figure 2) had a less significant spatial variability of N content;
[image:3.595.62.280.444.745.2]Figure 2. Total soil N content in plot II (ppm N)
however, a higher content is evident in southern, i.e. lower, part of the plot, and therefore a cor-relation between N content and the slope rate is marked here.
The total soil S content recorded in plots I and II was 0.088% and 0.083%, respectively; differences are thus not very significant. Still, the S content is relatively high, which manifests good total status of this element in both soils. The other statistical data given in Table 2 show that the differences between individual sampling points are low as is
the variation within the results; this is confirmed by the values of the coefficient of variance reaching only 2.5 and 2.3% in plots I and II, respectively. These values do not correspond to the results of Gallardo and Parama (2007), who reported a high
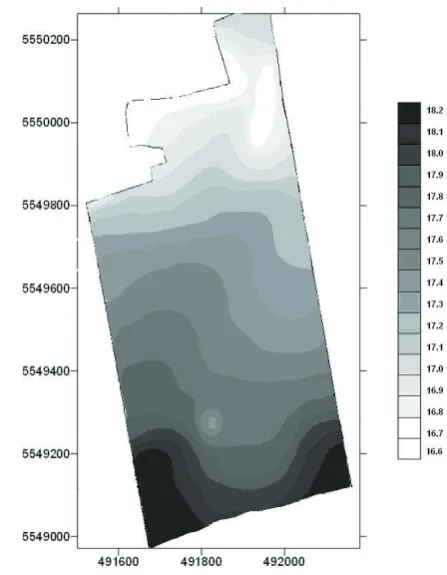
[image:4.595.122.476.65.250.2]CV of sulphur, especially in the case of grassy cover. Furthermore, maps showing spatial distri-bution of S content confirm a balanced content of this element in both plots (Figures 3 and 4). This balance is probably a result of regular and even sulphur imission in the past and suggests that the
[image:4.595.301.525.449.737.2]Figure 4. Total soil S content in plot II (ppm S)
[image:4.595.76.334.450.733.2]stability of this nutrient, bound in soil mainly in organic compounds, is only insignificantly influ-enced by management practices. Zhao et al. (1998) reported that the total S content in the soil under grass cover at a site in Rothamsted (UK) did not change during a long-term observation, not even with significantly higher imission inputs.
The N:S ratio is higher in plot I (1.8), compared to plot II (1.5). This is attributed mainly to the higher N content in plot I. Considering that the differences in N content were much more significant than those of S, N is the determining element of this ratio. Similarly, CV values correspond to N content. The
values obtained for S content and N:S ratio are common for most arable soils in the area.
The evaluation of spatial variability of the total N and S contents and crop yield allowed us to state a largely positive significant correlation between total N content and yield. A higher correlation was observed in plot II where Šilha (2006) recorded relatively a high correlation between crop yield and the content of mineralisable and mineral N at the beginning of the crop growing period. Based on the 3-year observation of the content of these N forms in the soil before and during growth, he concluded that time variability of mineral N con-tent is higher than its spatial variability. During the growth of crops, the content of mineral N in soil is low and spatially rather balanced.
No correlation was observed in either plot be-tween total S content and crop yield. This indicates that S content is not a limiting factor for yield, and that the plots under study have sufficient supplies of S in all their parts, even for crops with high S demands, such as rape.
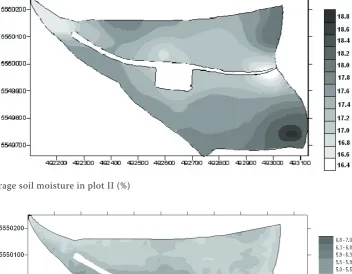
[image:5.595.61.290.49.338.2]Evaluation of the correlation between the other measured parameters suggests that there is a rather high correlation between slope, soil moisture and crop yield, as shown by Figures 5–7 (plot I) and 8–10 (plot II). This is similar to the results by Persson et al. (2005) who report the topography of a plot as an important factor for potato yield. Additionally, Kumhálová et al. (2008) observed that topography influences moisture conditions of the field in relation to weather conditions in individual years. Borůvka et al. (2002), when evalu-ating pedological characteristics of plot I, reported higher content of Corg and found dust in southern, i.e. lower part of the plot. Understandably, these local differences influence soil nutrient supplies
Figure 7. Yield map of plot I (t corn grains/ha)
[image:5.595.136.468.572.734.2]and the water regime, and consequently more or less affect crops and their yields.
REFERENCES
Baxter S.J., Oliver M.A., Gaunt J. (2003): A geostatis-tical analysis of the spatial variation of soil mineral nitrogen and potentially available nitrogen within an arable field. Prec. Agr., 4: 213–226.
Blake-Kalff M.M.A., Hawkesford M.J., Zhao F.J., McGrath S.P. (2000): Diagnosing sulphur deficiency in field-grown oilseed rape (Brassica napus L.) and wheat (Triticum aestivum L.). Plant Soil, 225: 95–107. Borůvka L., Donátová H., Němeček J. (2002): Spatial
distribution and correlation of soil properties in a field: a case study. Rostl. Výr., 48: 425–432. Brodský L., Vaněk V., Száková J., Štípek K. (2001):
Spa-tial heterogeneity of soil properties. Rostl. Výr., 47: 521–528.
Dahiya I.S.R., Ablauf K.C., Kersebaum K.C., Richter J. (1985): Spatial variability of some nutrient constitu-ents of an Alfisol from loess. II. Geostatistical analy-sis. Z. Pfl.-Ernähr. Bodenkde, 148: 268–277. Gallardo A., Parama M. (2007): Spatial variability of
soil elements in two plant communities of NW Spain. Geoderma, 139: 199–208.
Haberle J., Kroulík M., Svoboda P., Lipavský J., Krejčová J., Cerhanová D. (2004): The spatial vari-ability of mineral nitrogen content in topsoil and subsoil. Plant Soil Environ., 50: 425–433.
Kumhálová J., Matějková Š., Fifernová M., Lipavský J., Kumhála F. (2008): Topography impact on nutrition content in soil and yield. Plant Soil Environ., 54: 255–261.
Marschner H. (1995): Mineral Nutrition of Higher Plants. Academic Press, London.
[image:6.595.121.474.71.345.2]Marschner P., Rengel Z. (2007): Nutrient Cycling in Terrestrial Ecosystems. Springer-Verlag, Berlin, Hei-delberg.
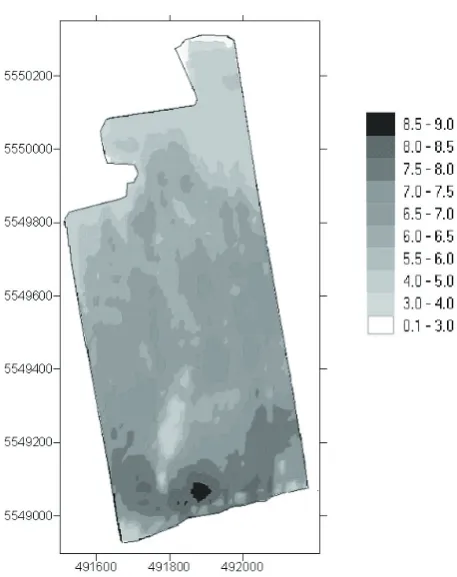
[image:6.595.120.481.277.453.2]Figure 9. Average soil moisture in plot II (%)
Corresponding author:
Prof. Ing. Václav Vaněk, CSc., Česká zemědělská univerzita v Praze, Fakulta agrobiologie, potravinových a přírodních zdrojů, Kamýcká 129, 165 21 Praha 6, Česká republika
phone: + 420 224 382 734, e-mail: [email protected] Mathot M., Mertens J., Verlinden G., Lambert R. (2008):
Positive effect of sulphur fertilisation on grasslands yields and quality in Belgium. Eur. J. Agron., 28: 655–658.
Matula J., Pechová M. (2002): Sulfur and sulfate centrations in leaves of oilseed rape under field con-ditions. Rostl. Výr., 48: 433–440.
Matula J., Pechová M. (2007): The influence of gypsum treatment on the acquirement of nutrients from soils by barley. Plant Soil Environ., 53: 89–96.
Persson A., Pilesjö P., Eklundh L. (2005): Spatial in-fluence of topographical factors on yield of potato (Solanum tuberosum L.) in central Sweden. Prec. Agr., 6: 341–357.
Scherer H.W. (2001): Sulphur in crop production – in-vited paper. Eur. J. Agron., 14: 81–111.
Šilha J. (2006): Nitrogen fertilisation in precision ag-riculture. [Ph.D. Thesis.] Czech University of Life Sciences in Prague, Czech Republic. (In Czech)
Skwierawska M., Zawartka L., Zawadzki B. (2008): The effect of different rates and forms of applied sulpur on nutrient composition of planted crops. Plant Soil Environ., 54: 179–189.
Štípek K., Vaněk V., Száková J., Černý J., Šilha J. (2004): Temporal variability of available phosphorus, potas-sium and magnepotas-sium in arable soil. Plant Soil Envi-ron., 50: 547–551.
Vaněk V., Balík J., Pavlíková D., Tlustoš P. (2007): Nu-trition of Field and Horticultural Crops. Profi Press, Prague. (In Czech)
Wang L., Mou P.P., Huang J., Wang J. (2007): Spatial heterogeneity of soil nitrogen in a subtropical forest in China. Plant Soil, 295: 137–150.
Zhao F.J., Spiro B., Poulton P.R., McGrath S.P. (1998): Use of sulphur isotope ratios to determine anthro-pogenic sulphur signals in a grassland ecosystem. Environ. Sci. Technol., 32: 2288–2291.