Microstructure and Thermoelectric Properties of Hot-Pressed n-Type
Bi
1:9Sb
0:1Te
2:6Se
0:4Alloys Prepared Using a Rapid Solidification Technique
Yuma Horio, Hiroyuki Yamashita and Takahiro Hayashi
Material & Components Development Center, YAMAHA Corporation, Iwata-gun 438-0192, Japan
N-type Bi1:9Sb0:1Te2:6Se0:4 alloys were prepared by a rapid solidification technique and subsequent hot-pressing method. The
microstructure and thermoelectric properties of the alloys were investigated as a function of the hot-pressing temperature and pressure. The
X-ray diffraction measurements indicate that the grains are preferably aligned with thec-axis perpendicular to the direction of the hot-pressing
force by the hot-pressing. Hot-pressing at higher temperature promotes the grain growth in the alloys. The Seebeck coefficient () and electrical resistivity () decrease with an increase in the hot-pressing temperature, whereas the thermal conductivity () increases. The specimens prepared
at higher temperature greater than 733 K show better thermoelectric performance: the largest dimensionless figure of merit (ZT) is 1.08 at room
temperature.
(Received October 29, 2004; Accepted September 28, 2005; Published November 15, 2005)
Keywords: bismuth-telluride, rapid solidification, thermoelectric properties, crystal orientation, hot-pressing method
1. Introduction
Controlling the crystal orientation and grain size is well known to be practically effective for optimizing the thermo-electric properties of bismuth-telluride based alloys. Bi2Te3 crystallizes in a rhombohedral structure with a space group
D53d (R33m) and with five atoms in a trigonal cell.1) The
structure can be represented as a stack of hexagonally arrayed
atomic planes; each consisting of only one type of atom.1–4)
The electrical resistivity () of this alloy is well known to be
anisotropic. Theis higher along thec-axis than in the basal
plane due to the Te-Te double layer being parallel to the basal
plane (c-plane). The crystal is therefore easily cleaved at this
layer in the hexagonal unit cell, due to the weakness of the
van der Waals type bond between the layers.1)
Powder metallurgy techniques such as the hot-pressing method with a pulverized ingot have been widely employed to improve thermoelectric properties of the product. They have an advantage of producing a homogeneous material
with reduced thermal conductivity (). However, the crystal
orientation may potentially be lost during the pulverizing
process, resulting in an increase in.5)We proposed a new
rapid solidification process for fabricating new
bismuth-tellurides for thermoelectric use.6,7)The rapid solidification
technique can be expected to makelower in the direction
parallel to the foil thickness rather than other directions. We previously reported that, in rapidly solidified foils fabricated using the single roller method, grains are formed with the
c-plane perpendicular to the surface of the cooling roller
during the solidification process.6)Furthermore, the
forma-tion of fine crystal grains in the alloy foil will also be
effective in obtaining a lowvalue.
The purpose of this work is to investigate the effects of hot-pressing conditions on the microstructure and thermoelectric
properties of the n-type Bi1:9Sb0:1Te2:6Se0:4 alloy prepared
using rapidly solidified foil. We also report on variations of the microstructure, including the crystal orientation, with the hot-pressing temperature and pressure.
2. Experimental Procedure
The Bi1:9Sb0:1Te2:6Se0:4 alloy ingots were prepared by
melting a mixture of pure Bi, Sb, Te and Se (=99:99%
purity). The raw materials were sealed into a fused silica tube with argon gas filled. Then, the raw materials were melted at 923 K for 1 h using a rocking furnace. The single roller melt spinning technique was then employed to obtain rapidly solidified foils. The copper roller with 400 mm diameter was
rotated at a speed of 10.5 s1. The obtained foils were 2.0 mm
in width and 10 to 20mmin thickness. They were annealed in
a Pyrex tube with hydrogen gas for 10 h at 653 K as part of the reduction process.
The foils were then carefully stacked in a die in order to maintain an effective crystal orientation. Careful handling of the foils was essential at this point since the foils were very brittle along their cleavage plane in the hexagonal unit cell and easily pulverized. The stacked foils were then hot-pressed in a direction parallel to the foil thickness. Two pellets with thickness of 8 mm were formed to have diameters of 10 and 26 mm, respectively. The two pressures, 10 and 50 MPa, were employed to examine the effect of hot pressing on the microstructure and thermoelectric properties of the pellets. We also expected optimization of the pressures to consolidate the foils without breaking them.
Two types of specimens (A) and (B) were fabricated. The specimens (A) were obtained by hot-pressing in the temper-ature range between 553 and 763 K in an argon atmosphere for 60 min at 10 and 50 MPa. The specimens (B) were fabricated by a two-step hot-pressing process. The foils were hot-pressed at 50 MPa for 60 min at temperatures ranging from 553 to 703 K in the initial hot-pressing step and subsequently hot-pressed at 30 MPa for 30 min at a temper-ature of 733 K in the second step. Hot-pressing conditions such as the pressure, temperature and time of the hot pressing were carefully chosen to control the grain size and crystal orientation of the specimens.
grains. The microstructure of the specimens was observed by optical micrograph.
The thermoelectric properties were measured at room temperature in a direction parallel to the pressing direction.
To measure the Seebeck coefficient () and of the alloy,
specimens with dimensions of 444mm were cut out
from the hot-pressed ingots. The thermoelectric motive force
(E) was also measured under the application of a small
temperature differential (T) between both ends of the
specimen. The value was determined from the formula
E=T. The value was measured using the static
compa-rative method, with a transparent SiO2 cubic block as a
standard sample in a vacuum of5103Pa. Thevalue was
measured using the four-probe technique. The figure of merit
(Z) was evaluated by the relation ofZ¼2=ðÞ.
3. Results and Discussion
3.1 X-ray diffraction
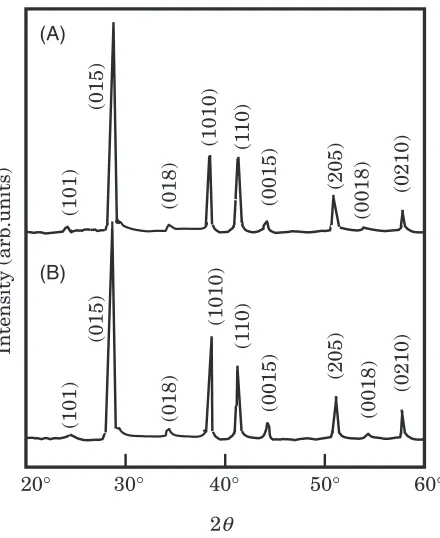
Figure 1 shows the X-ray diffraction of a specimen (A) hot-pressed at 50 MPa for 60 min at 553 K and a specimen (B) subsequently hot-pressed at 30 MPa for 30 min at 733 K for the specimen (A) in the second step. The X-ray diffraction intensities of basal planes such as (0015) and (0018) planes were weak in comparison with those of (110) and (1010) planes for both specimens (A) and (B). This finding indicates
that the grains are preferably aligned with their c-axis
perpendicular to the direction of the hot-pressing force by the hot-pressing. It is also concluded that the difference in the crystal orientation is small between the two specimens, even though the intensity of the (110) plane is reduced by the second pressing for the specimen (B).
Figure 2 shows the diffraction intensity ratio (R) of
specimens (A) and (B) as a function of the hot-pressing
temperature in the first step. Here, ‘‘R’’ has been determined
using the following equation,R¼Ið1;1;0Þ=Iðh;k;lÞ, where
‘‘I’’ is the X-ray diffraction intensity and Iðh;k;lÞ ¼
Ið101Þ þIð015Þ þIð018Þ þIð1010Þ þIð110Þ þIð0015Þ þ
Ið205Þ þIð0018Þ þIð0210Þ. Higher R values are found at
temperatures lower than 583 K for both specimens (A) and (B), suggesting that the hot-pressing temperature in the first step determines the orientation of the grains. The grain growth in the specimens (A) and (B) will be demonstrated in the optical micrographs.
3.2 Microstructure
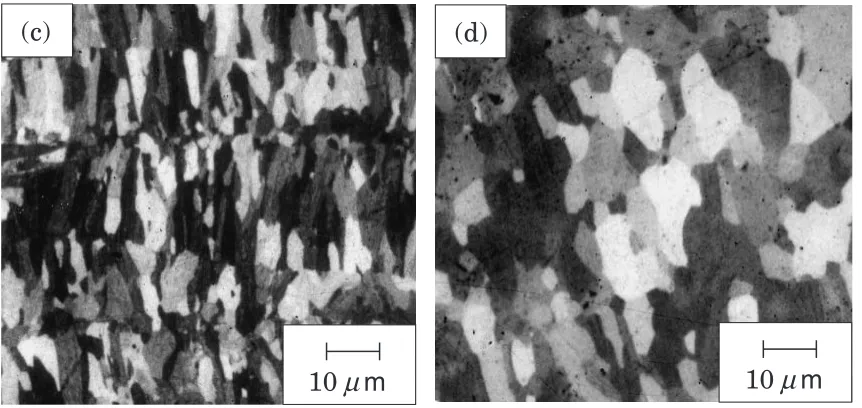
Optical micrographs are shown in Fig. 3 for Bi1:9Sb0:
1-Te2:6Se0:4 alloy specimens (A) hot-pressed at 50 MPa for
60 min at (a) 553 K and at (b) 763 K. Figure 4 also shows the optical micrographs of specimens (A) hot-pressed at 10 MPa for 60 min at (c) 673 K and (d) 763 K, respectively. Grain growth is found for the specimens hot-pressed at the higher temperature of 763 K irrespective of any difference in hot-pressing pressure. This is a strong evidence to show that the hot-pressing at higher temperature promotes grain growth in the specimens (A).
Figure 5 shows the optical micrographs of the specimens (B) pressed at (e) 553 K and (f) 703 K in the first hot-pressing step. It is found that the crystal grain size in (e) is still as small as those in (a) and (c). However, in (f), an appreciable grain growth is observed. Keeping in mind that the specimens (B) are fabricated by a further hot-pressing process at a temperature of 733 K and for a shorter time (30 min), it is concluded that hot-pressing at higher temper-ature (at higher than 700 K) promotes grain growth more.
3.3 Thermoelectric properties
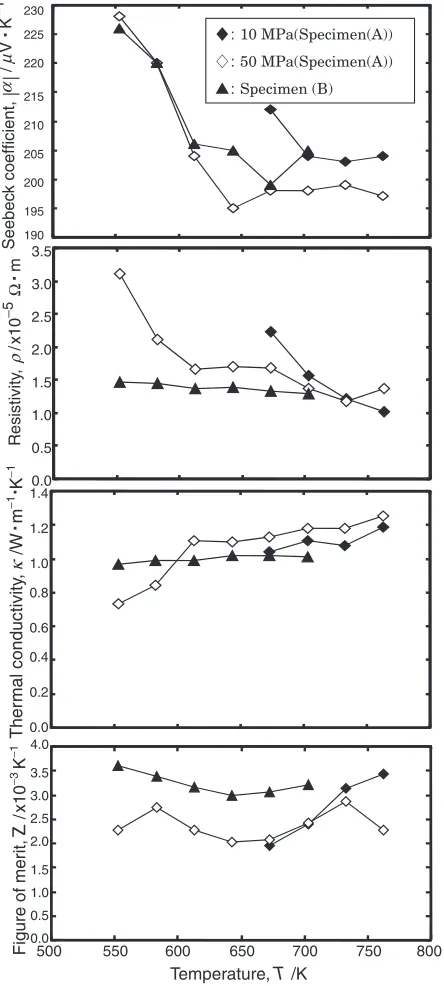
Figure 6 illustrates the variation of the,,and figure of
merit (Z) values of hot-pressed Bi1:9Sb0:1Te2:6Se0:4
speci-mens (A) and (B) as a function of the hot-pressing temper-ature in the first step.
Thevalue decreases with the increase in the hot-pressing
temperature to 673 K for the specimens (A) hot-pressed at 50 MPa and specimens (B). The relative variations of the
decrease invalues are 13% for both specimens. The same
temperature dependence of is observed in specimens (A)
hot-pressed at 10 MPa. Specimens that were hot-pressed at
Intensity (arb.units)
20° 30° 40° 50° 60°
2θ
(A)
(B)
(1010)
(1
10)
(205)
(015)
(0015) (0018)
(0210)
(101) (018)
(015)
(1
10)
(205)
(1010)
(0015) (0210)
(0018)
(101) (018)
Fig. 1 X-ray diffraction patterns of Bi1:9Sb0:1Te2:6Se0:4specimens (A) and
(B).
0.00 0.05 0.10 0.15 0.20 0.25
500 550 600 650 700 750
Temperature,T /K
Diffraction intensity ratio,
R
: Specimen (A)
: Specimen (B)
Fig. 2 Diffraction intensity ratio (R) as function of hot-pressing
[image:2.595.313.541.75.203.2] [image:2.595.60.280.489.758.2](a)
(b)
10
µ
m
10
µ
m
Fig. 3 Optical micrographs of Bi1:9Sb0:1Te2:6Se0:4specimens (A) hot-pressed at (a) 553 K and (b) 763 K. (50 MPa, 60 min)
(c)
(d)
10
µ
m
10
µ
m
Fig. 4 Optical micrographs of Bi1:9Sb0:1Te2:6Se0:4specimens (A) hot-pressed at (c) 673 K and (d) 763 K. (10 MPa, 60 min)
(e)
(f)
10
µ
m
10
µ
m
[image:3.595.88.510.74.273.2] [image:3.595.84.515.318.522.2] [image:3.595.85.512.570.769.2]temperatures of 613 K or higher, however, show small
variation in . There is no significant difference in the
temperature dependence of for the specimens (A)
hot-pressed at 10 and 50 MPa and the specimens (B); despite the fact that the hot-pressing temperature in the first step is lower than that in the second step for specimens (B).
Thevalue decreases by 65% with the increase in the
hot-pressing temperature for the specimens (A) hot-pressed at 10
and 50 MPa. The change inis large at temperatures ranging
from 553 to 613 K for specimens hot-pressed at 50 MPa. For
the specimens (B), thevalue gradually decreases as the
hot-pressing temperature increases. The variation in for the
specimens (B) is 12%, which is smaller than that for the specimens (A).
Thevalue increases by 13% as the hot-pressing
temper-ature rises in specimens (A) hot-pressed at 10 and 50 MPa.
For the specimens (B), thevalue is gradually increased by
4% as the hot-pressing temperature rises.
The figure of merit (Z) decreases by 18% as the
hot-pressing temperature rises in the specimens (B). TheZvalues
for the specimens (B) are higher than those for the specimens
(A) hot-pressed at 10 and 50 MPa. However, the Z shows
high values at higher temperatures than 733 K in the specimens (A).
Variation in, depending on the carrier concentration, has
been reported previously.8,9)The carrier concentration in
n-type thermoelectric materials is generally known to increase in correlation with the increase in the number of electrons. The increase in the carrier concentration has the effect of
lowering .10) In this study, an increase in hot-pressing
temperature causes bothandto decrease, thus showing
the close relationship betweenand.
Thevalue is also closely related to carrier concentration
and phonon scattering at grain boundaries because it can be
expressed as ¼elþph.11) Here, el is the electron
contribution to thermal conductivity and ph is the lattice
thermal conductivity. The grain growth, as shown in Figs. 3
and 4, contributes to the increase ofwith a higherphdue to
phonon scattering.12–16)Assuming the Wiedemann–Frantz’s
law, for the specimen (A) hot-pressed at 50 MPa for 60 min at
763 K, the el and ph are calculated to be 0.33 and
0.92 Wm1K1 respectively. It is indicated that
ph
con-tributes to the total value of.
For the specimens (A) hot-pressed at 10 MPa, is found
to have a low value of1:02105m with the increase in
the hot-pressing temperature. As shown in Fig. 6, the
specimens (A) exhibit a figure of merit (Z) of 3:43
103K1due to the low value of. It is found that a higherZ
value than3:40103K1is obtained through optimization
of the hot-pressing temperature in the one-step hot-pressing
process for Bi1:9Sb0:1Te2:6Se0:4 specimens using rapidly
solidified foils.
For the specimens (B), the values are as small as
1.0 Wm1K1; representing a high figure of merit (Z) of
above 3:10103K1 when the specimens (B) is
hot-pressed at hot-pressing temperatures below 613 K. The
values obtained are lower than those reported for alloys
prepared using conventional techniques.17) A maximum
figure of merit (Z) of 3:61103K1 is obtained for the
specimen hot-pressed at 553 K. This high Z value was
obtained with highand lowrespectively, even though this
specimen also exhibits a highof1:46105m.
There-fore, a dimensionless figure of merit (ZT) of 1.08 is obtained.
The value is higher than previously reported for hot-extruded
or hot-pressed alloys.18,19) At hot-pressing temperatures
exceeding 643 K, the Z value was seen to increase with an
increase in hot-pressing temperature for the specimens (B).
The resulting Z value of 3:22103K1 prepared at a
temperature of 703 K, is due to lower. It is thus concluded
that an essential factor in obtaining a highZ value involves
fabricating the specimens with a high and low by
lowering the hot-pressing temperature, or the specimens with
a lowby raising the hot-pressing temperature.
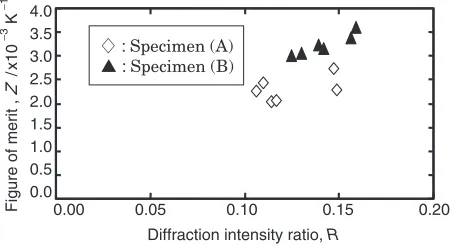
Figure 7 shows the variation ofZas a function ofRfor the
0.0 0.5 1.0 1.5 2.0 2.5 3.0 3.5 Seebec k coefficient, || 190 195 200 205 210 215 220 225 230 / µ α V K − 1
:10 MPa(Specimen(A))
:50 MPa(Specimen(A))
:Specimen (B)
0.0 0.5 1.0 1.5 2.0 2.5 3.0 3.5 4.0
500 550 600 650 700 750 800
0.0 0.2 0.4 0.6 0.8 1.0 1.2 1.4
Temperature, T /K
Resistivity , / x10 − 5 m Ω ρ
Figure of mer
it,
Z
/
x10
−
3 K
−
1
Ther
mal conductivity
, /W m
− 1 K − 1 κ
Fig. 6 Thermoelectric properties as function of hot-pressing temperature
[image:4.595.61.283.73.566.2]specimens (A) and (B). It shows thatZ values increase with
the increase ofR, especially for specimens (B). We conclude
that increasing of R to a high value is a vital factor in
obtaining a high value of Z for specimens using rapidly
solidified foils.
4. Summary
The,,andZvalues of hot-pressed specimens prepared
using rapidly solidified Bi1:9Sb0:1Te2:6Se0:4 have been
eval-uated. Their microstructures are observed and the crystal orientations are also investigated.
(1) The X-ray diffraction measurements indicate that the
grains are aligned with thec-axis perpendicular to the
direction of the hot-pressing force by the hot-pressing process.
(2) The hot-pressing at higher temperature promotes the grain growth for specimens (A) and (B).
(3) For both the specimens (A) and (B), the decreasing of the hot-pressing temperature is effective way to obtain a
high Z value with high and low . Whereas, the
specimens with low shows a high Z through the
raising of the hot-pressing temperature. By considering that the specimens (B) was hot-pressed at 733 K, the
raising of hot-pressing temperature is thought to be
more effective to obtain a higherZ.
(4) There is a little difference in the pressing pressure dependence for the specimens (A) hot-pressed at 10 and 50 MPa.
The specimens (B) fabricated by the two-step hot-pressing process exhibits the highest dimensionless figure of merit
(ZT) of 1.08.
REFERENCES
1) J. R. Wiese and L. Muldawer: J. Phys. Chem. Solids15(1959) 13–16.
2) J. R. Drabble and C. H. L. Goodman: J. Phys. Chem. Solids5(1958)
142–144.
3) M. H. Lachance and E. E. Gardner: Adv. Energy Conversion1(1961)
133–138.
4) S. Nakajima: J. Phys. Chem. Solids24(1963) 479–485.
5) S. K. Lee, T. S. Oh, D. B. Hyun and C. W. Hwang: Met. Mater.6(2000)
67–72.
6) Y. Horio, H. Yamashita and T. Hayashi: Mater. Trans.8(2004) 2757–
2760.
7) Y. Horio, H. Yamashita and T. Hayashi: Mater. Trans.12(2004) 3309–
3313.
8) F. E. Jaumot: Proceedings of the IRE.16(1958) 538–554.
9) J. M. Schultz, J. P. McHuugh and W. A. Tiller: J. Appl. Phys.33(1962)
2443–2450.
10) S. J. Hong and B. S. Chun: Mater. Res. Bull.38(2003) 599–608.
11) K. Uemura and I. Nishida:Theromoelecric Semiconductors and Their
Applications, (Nikkan-kogyo Shinbun Press, Tokyo, 1988) p. 145.
12) D. M. Rowe and V. S. Shukla: J. Appl. Phys.52(1981) 7421–7426.
13) D. M. Rowe: Proc. 4th International Conf. on Thermoelectric
conversion(Arlington, 1982) p. 96.
14) N. Savvides and H. J. Goldsmid: J. Phys. C: Solid State Phys.13(1980)
4671–4678.
15) C. M. Bhandari and D. M. Rowe: J. Phys. C: Solid State Phys.11
(1987) 1787–1794.
16) P. G. Klemens: Int. J. Thermophys.15(1994) 1345–1351.
17) J. Seo, K. Park, D. Lee and C. Lee: Mater. Sci. Eng. B49(1997) 247–
250.
18) D. B. Hyun, J. S. Hwang, J. D. Shim and T. S. Oh: J. Mater. Sci.36
(2001) 1285–1291.
19) D. Vasilevskiy, J. M. Simard, F. Belanger, F. Bernier, S. Turenne and
J. L’Ecuyer: Proc. 21th International Conf. on Thermoelectronics
(Long Beach, 2002) p. 24. 0.0
0.5 1.0 1.5 2.0 2.5 3.0 3.5 4.0
0.00 0.05 0.10 0.15 0.20
Diffraction intensity ratio, R
Figure of merit ,
Z
/
x10
−
3 K
−
1
:Specimen (A)
:Specimen (B)
Fig. 7 Figure of merit as function of diffraction intensity ratio (R) for
[image:5.595.57.283.74.197.2]